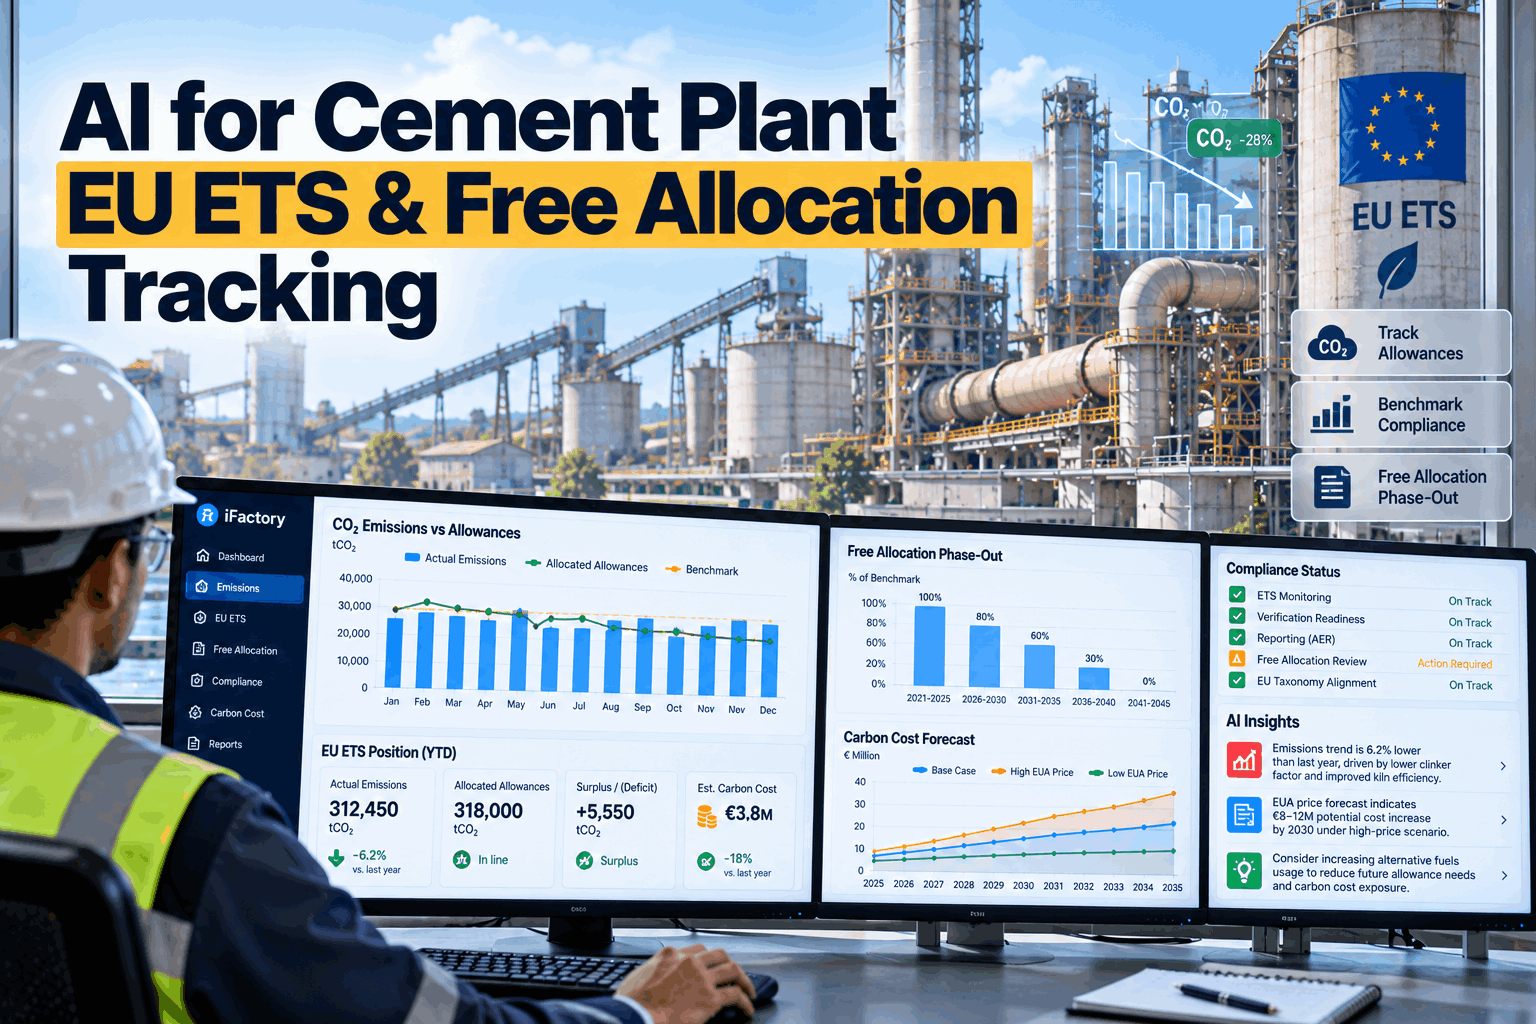
For a European cement producer, 2026 is the year the carbon bill stopped being a compliance footnote and became a line the CFO has to forecast. The clinker benchmark has been cut, free allocation has started its phase-out as the Carbon Border Adjustment Mechanism (CBAM) takes over, and every unplanned kiln stop now moves both emissions and the activity level that next year's allocation is built on. iFactory's AI Compliance + Reporting Engine tracks allowances, benchmarks and the phase-out continuously, turning plant data into a carbon position finance can trust. To see your own numbers modelled, book a cost review.
Know Your EU ETS Carbon Cost Before the Kiln Stop Becomes a Bill
iFactory connects kiln, fuel and laboratory data to the EU ETS rules that price them — the 2026–2030 clinker benchmark, the CBAM-linked phase-out and the ±15% activity-level band — so finance sees allowance exposure by plant, by month and by event, not once a year after verification.
- Free allocation forecast for every year to 2030
- Carbon cost attached to every kiln stop
- Verifier-ready evidence, kept inside your plant network
Three Numbers Moved in 2026 — and the Gap Got Wider
EU cement production of roughly 170 million tonnes a year releases around 110 million tonnes of CO2, and the Joint Research Centre puts the EU average near 0.81 tonnes of CO2 per tonne of clinker — about 0.53 from calcination that no fuel switch removes. The benchmark has never covered that in full. In 2026 the distance between what a plant emits and what it receives for free grew for three separate reasons at once, which is why last year's carbon budget is a poor guide to this one. For a second opinion on your own budget, speak with our support team.
The clinker benchmark was cut 5.3%
Implementing Regulation (EU) 2026/1412 of 26 June 2026 set the grey cement clinker benchmark at 0.656 allowances per tonne for 2026–2030, and white clinker at 0.890. Every tonne of clinker now earns fewer free allowances before any other factor is applied.
The phase-out has started
Cement is a CBAM sector, so its allocation is multiplied by a factor that falls each year: 97.5% in 2026, 95% in 2027, 90% in 2028, then steeply to 51.5% in 2030 and zero in 2034 under the law as it stands.
The price has a wide range
EU allowances have traded between roughly €70 and €90 a tonne during 2026 — a high near €89.60 in January, about €70 in late February and close to €83 at the end of August. A €20 swing on a six-figure shortfall is a seven-figure variance.
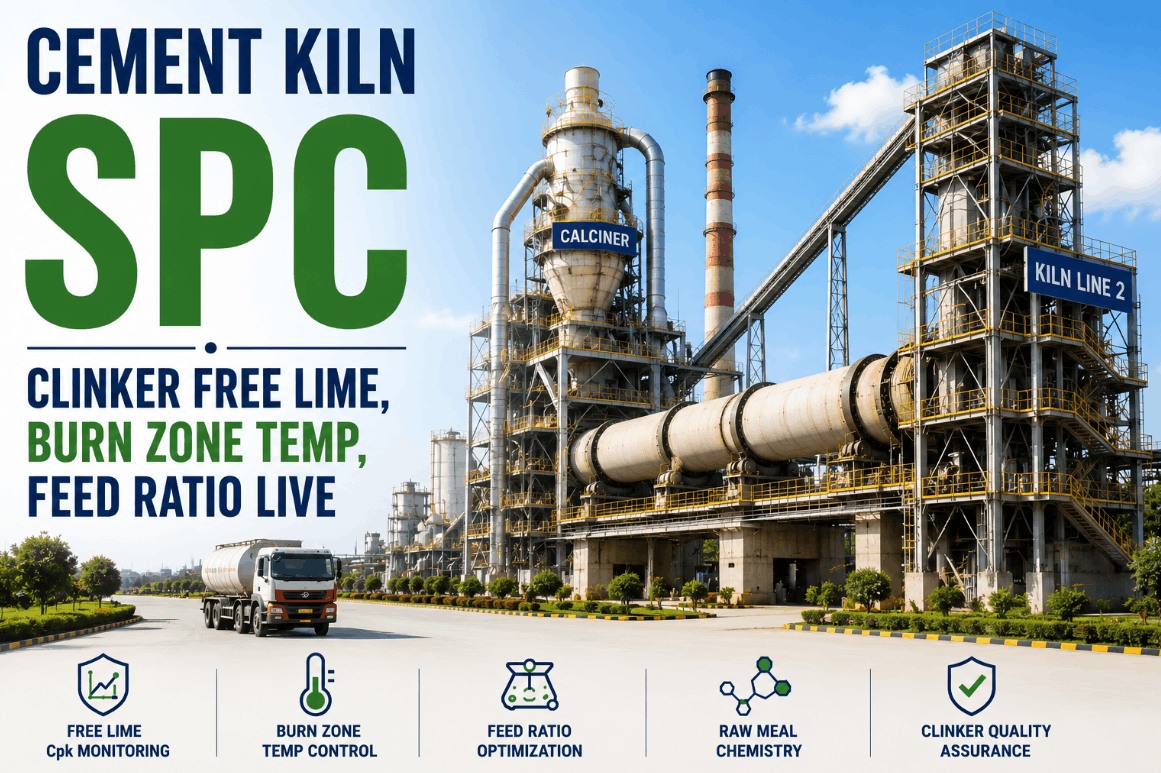
Put together on the illustrative plant in the hero — one million tonnes of clinker at 0.80 tonnes of CO2 each — the 2026 allocation is 53,400 allowances lower than the 2025 rules would have given. That is about €4.3 million a year at €80, without one extra tonne of CO2 leaving the stack.
The Free-Allocation Phase-Out, Year by Year
The schedule below is the current legal trajectory for CBAM sectors. It is back-loaded: the first three years remove 10% between them, and the following two remove almost 40%. A plant that budgets carbon by rolling last year forward will be badly short in 2029 and 2030. To have this schedule rebuilt with your plant's own emissions and output, book a modelling session.
What that does to one plant's allowance bill
Illustrative plant: 1,000,000 tonnes of clinker a year, 800,000 tonnes of verified CO2, benchmark 0.656, no activity-level or conditionality adjustment, flat €80 allowance price. Your figures will differ — which is the point of modelling them.
Four Levers Decide Your Free Allocation — Only Two Sit Inside the Plant
Free allocation is a multiplication, and a CFO-grade forecast needs every term. Two are set in Brussels and can only be planned around. Two are decided by how the plant runs, and those are the ones a monthly review can still change. iFactory tracks all four and shows which one moved when the forecast shifts — our specialists can walk your team through the logic.
Benchmark
0.656 allowances per tonne of grey clinker, fixed for 2026–2030.
Activity level
Two-year average clinker output against the historical level. Beyond ±15%, allocation is recalculated.
CBAM factor
97.5% in 2026, falling every year as the border mechanism phases in.
Conditionality
A 20% cut applies if energy-audit recommendations are not implemented, or if a high-emitting sub-installation has no climate-neutrality plan.
The conditionality term is the one most often missing from finance models. On the illustrative plant, a 20% reduction is 127,920 allowances — more than €10 million at €80 — and it turns on documentation an energy manager holds, not on anything the kiln does.
What One Kiln Stop Really Costs in Carbon
Maintenance teams cost a stop in lost clinker and repair hours. The carbon ledger has two more lines. The first is small and certain: reheating a kiln burns fuel with no clinker to show for it. The second is large and conditional: lost output lowers the two-year average activity level, and if that average ends up more than 15% below the historical level, the following year's allocation is reduced by the exact percentage. The same seven-day stop can cost €24,000 or €7.6 million depending on where the average stood beforehand.
Illustrative: historical activity level 1,000,000 t; 2027 allocation of 623,200 allowances reduced by 15.25%; €80 per allowance. Lower output also lowers emissions, which the platform nets off in the full position.
Finance can ask the question directly
iFactory keeps the activity-level position live — current-year clinker to date, forecast to year end, the two-year average and its distance to the band. When a stop is logged, the forecast is rerun and the difference is expressed in allowances and euros. The CFO, the plant manager and the ETS manager see the same figure, and anyone can question it in plain language.
The decision stays with management. The AI shows what a recovery plan, a brought-forward shutdown or a change in fuel mix would do to the position; it does not run the kiln or place orders. You can test the same questions against your own plant on a pilot call.
See Your Allowance Position to 2030 in Six Weeks
Share your monitoring plan, last verified report and two years of production data. The pilot returns a year-by-year allocation and purchase forecast, an activity-level watch for each kiln line, and a carbon cost for every stop in your history.
- 31 MarchVerified annual emissions report and activity-level report for the previous year
- 30 JuneImprovement report, where the verifier raised findings
- 30 SeptSurrender allowances equal to verified emissions
- All yearMonitoring plan kept current; data gaps closed as they occur
What the AI Compliance + Reporting Engine Does
Most plants already hold the data an ETS forecast needs. It sits in the DCS, the weighbridge system, the laboratory and three spreadsheets owned by different people. iFactory brings it into one model that follows the monitoring plan, so the number finance reports and the number the verifier checks come out of the same source.
Continuous emissions accounting
Process emissions by the kiln-input or clinker-output method, fuel emissions by source stream, and bypass and kiln dust — calculated daily against the tiers in your monitoring plan instead of once at year end.
Activity-level watch
Clinker output to date and forecast to 31 December, the two-year average and its margin to the ±15% band, with an early warning when a stop or a demand change puts next year's allocation at risk.
Allocation and purchase forecast
Benchmark, activity level, CBAM factor and conditionality combined into a free-allocation figure for each year to 2030, set against forecast emissions to give the allowances you will need to buy.
Alternative-fuel and biomass tracking
Each fuel delivery is tied to its laboratory analysis and biomass fraction, so the zero-rated share is evidenced load by load and the effect of the fuel mix on the allowance bill is visible the same week.
Verification evidence pack
Calibration records, sampling frequencies, data-gap treatment and an audit trail behind every figure, assembled continuously. The AI flags a missed analysis or a meter out of calibration when it happens, not when the verifier asks.
Conditionality tracker
Energy-audit recommendations and climate-neutrality plan milestones logged with owner, status and evidence, so the 20% of allocation that depends on them is never exposed by a missing document.
The engine prepares and evidences the figures; your accredited verifier still verifies them and your authorised representatives still make the submissions. For how the handover works in practice, ask our compliance team.
Plan for the Law as It Is — and the Reform That May Follow
On 17 July 2026 the Commission published its review of the EU ETS. It is a proposal, not law, and Parliament and Council are aiming for agreement in the first quarter of 2027. A carbon forecast built today has to hold both versions, because the difference between them runs to tens of millions of euros for a single plant in the early 2030s.
- Grey clinker benchmark of 0.656 for 2026–2030
- CBAM factor falling to 51.5% in 2030 and zero in 2034
- Allocation adjusted when the two-year activity average moves more than 15%
- 20% conditionality on energy-audit measures and climate-neutrality plans
- Linear reduction factor of 4.3%, rising to 4.4% from 2028
- A 15% share of free allocation added back for CBAM sectors from 2028
- End of the phase-out moved from 2034 to 2038
- From 2031, free allocation conditional on a verified decarbonisation investment plan — 80% on approval, 20% on verified results
- Linear reduction factor of 3.7% for 2031–2035 and 1.7% afterwards
- Market Stability Reserve intake rate halved to 12% from 2028
iFactory holds both as scenarios against the same plant data, alongside your own price assumptions. When the final text is agreed, the model is switched over and every forecast, chart and report follows — no spreadsheet rebuild. Regulatory details on this page reflect published sources as of October 2026; confirm them with your competent authority before relying on them. To see the two scenarios side by side, book a scenario review.
Delivered as a Turnkey AI System — Hardware and Software Together
iFactory ships as a complete bundle: a pre-configured NVIDIA AI server, racked and ready, with the compliance models, allocation engine and report library pre-loaded. Rack it, plug in power and Ethernet, and the AI is live — production, emissions and cost data stay inside your own network, which matters when the output is commercially sensitive. Our team handles cabling, network setup, PLC, SCADA and DCS integration, finance-system connections, operator training and 24×7 remote monitoring. For a scoped proposal, speak with our deployment team.
Ship, network and data
Server delivered and racked. Connections made to the DCS, weighing systems, laboratory and finance. Monitoring plan, source streams and two or more years of history loaded and reconciled to the last verified report.
Model training and pilot
Emissions, activity-level and allocation models configured per kiln line and checked against past verified figures. Forecasts run in parallel with your existing process while finance reviews the assumptions.
Go-live and training
Dashboards and alerts go live for finance, plant and environment teams. Users are trained, the monthly carbon review is set up, and the evidence pack is walked through with your verifier.
Annual Spreadsheet, Generic Carbon Software and iFactory Compared
The carbon accounting software market is growing at more than 20% a year, and most of it is built for corporate Scope 1–3 inventories. An ETS installation needs something narrower and deeper — installation-level rules, daily plant data and a figure that survives verification. Check how your current setup compares on an assessment call.
What Each Team Gets
CFO and finance
A carbon cost line that can be forecast, accrued and explained — by plant, by month and by cause — with price scenarios and the phase-out built in.
Plant manager
The carbon consequence of each stop, shutdown plan and fuel decision in the same units as the rest of the plant budget.
Environment and ETS manager
Emissions and activity-level reports that assemble themselves, evidence that is always current, and far fewer surprises in the verification visit.
Treasury and procurement
A dated forecast of allowances needed, so purchases and hedges for ETS trading desks are sized on plant data instead of last year's total.
Frequently Asked Questions
How is free allocation calculated for a cement plant under the EU ETS?
For clinker, it starts with the product benchmark — 0.656 allowances per tonne of grey clinker for 2026–2030 — multiplied by the plant's historical activity level. That figure is then multiplied by the CBAM factor for the year, adjusted if the two-year average activity level has moved by more than 15%, and reduced by 20% if conditionality requirements are not met. iFactory calculates each term from plant data and shows them separately.
How quickly is free allocation being phased out for cement?
Under current law, the share of benchmark allocation that cement keeps is 97.5% in 2026, 95% in 2027, 90% in 2028, 77.5% in 2029 and 51.5% in 2030, reaching zero in 2034. The Commission's July 2026 proposal would slow this and extend it to 2038, but it has not been adopted. The platform models both so finance can see the range.
What changed in the cement benchmark for 2026–2030?
Implementing Regulation (EU) 2026/1412 set the grey cement clinker benchmark at 0.656 allowances per tonne, compared with 0.693 for 2021–2025 — a reduction of about 5.3%. The benchmark remains clinker-based. With the EU average close to 0.81 tonnes of CO2 per tonne of clinker, a typical plant is short on every tonne before the CBAM factor is applied.
How can a kiln stop change our free allocation?
Allocation is reviewed each year against the average clinker output of the two preceding calendar years. If that average differs from the historical activity level by more than 15%, allocation is increased or reduced by the exact percentage. A long stop in a year that is already running low can push the average across the threshold. iFactory tracks the margin continuously and prices each stop accordingly.
Does iFactory replace our verifier or file reports for us?
No. Annual emissions and activity-level reports must be verified by an accredited verifier and submitted by your authorised people through the official channels. iFactory prepares the figures, keeps the evidence behind them and flags gaps early, which typically shortens verification — but responsibility for the submission stays with the operator.
Does the platform give carbon trading advice?
No. It forecasts how many allowances each plant will need and when, under the price scenarios you choose. Treasury or your trading counterparty decides what to buy and how to hedge. The value is in sizing those decisions on current plant data, and in showing the CFO how much of the variance comes from price and how much from operations.
How long does deployment take, and what do we need to provide?
A typical project is live in 6–12 weeks. You provide rack space, power, an Ethernet connection, read access to plant and laboratory data, your monitoring plan and recent verified reports. iFactory supplies the pre-configured NVIDIA AI server, software, integration, training and 24×7 remote monitoring. To scope your sites, book a scoping call.
Give Finance a Carbon Number It Can Defend
One turnkey system — NVIDIA AI server, compliance software, integration and training — delivered and live inside 12 weeks. Start with one kiln line, or cover every EU installation in the group.
- Allocation and purchase forecast for each year to 2030
- Activity-level margin for every kiln line
- Carbon cost of each stop in the last two years
- Current-law and reform scenarios side by side
- Evidence-gap list ahead of the next verification