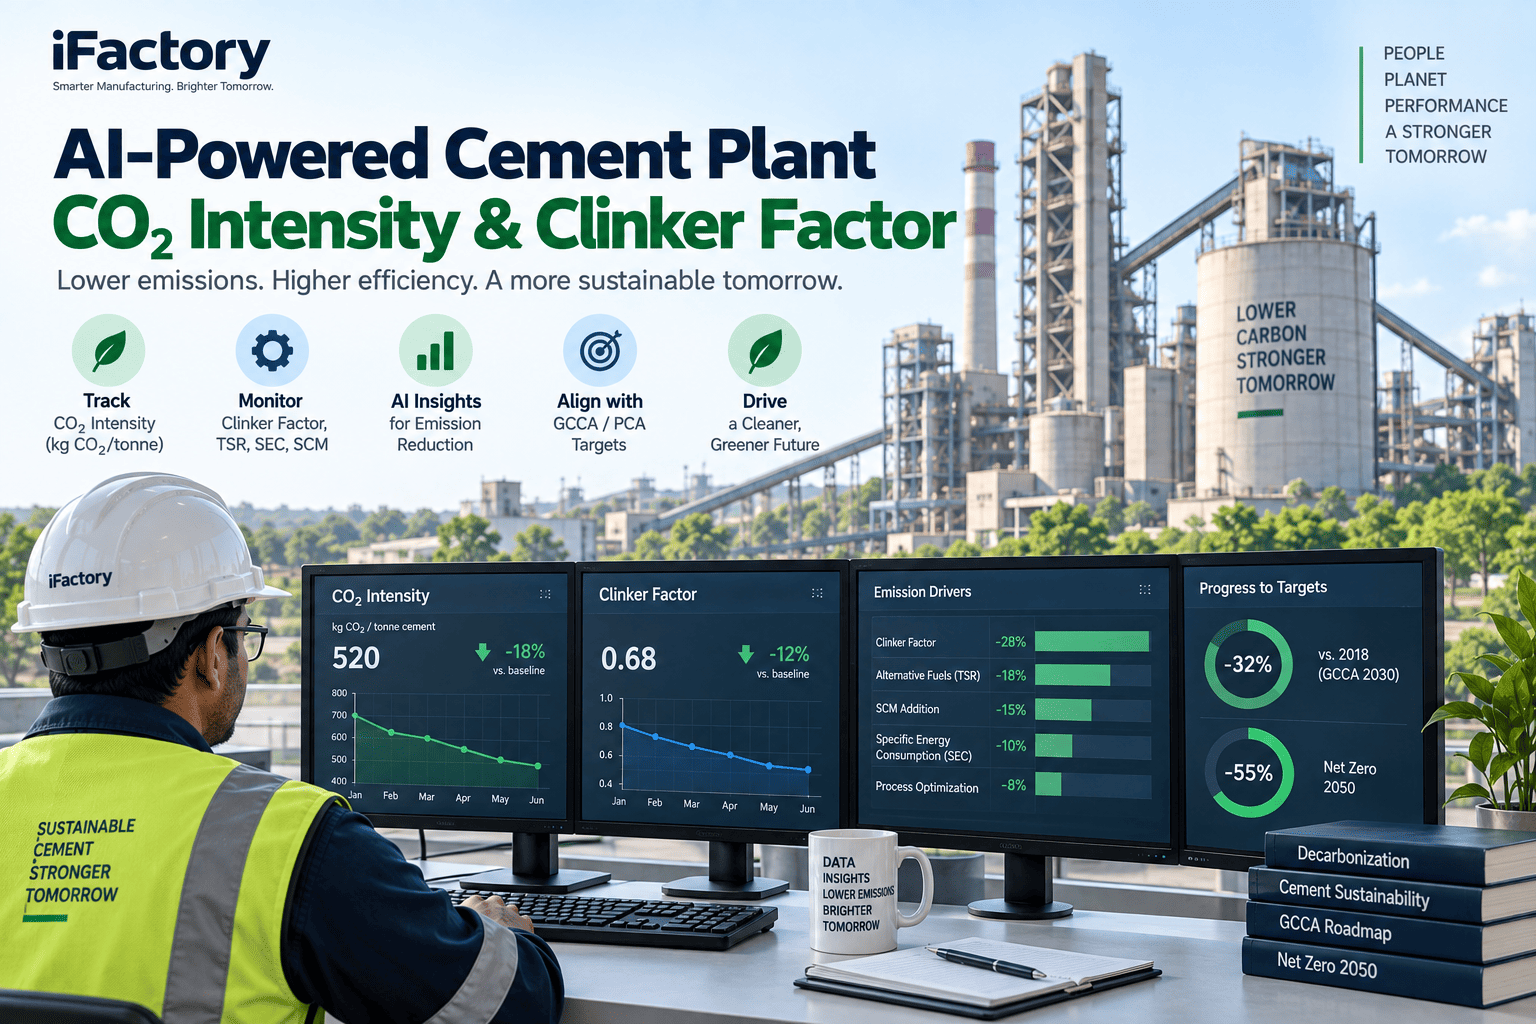
A cement plant's CO2 intensity — kilograms of CO2 per tonne of cement — is the single number that determines whether the operation is on track for GCCA's net-zero roadmap, whether the product qualifies for green procurement, and whether the carbon liability under EU CBAM or an emerging domestic scheme is manageable. Global average sits near 600 kg CO2 per tonne today; the GCCA Roadmap targets roughly 475 kg by 2030, on the way to net zero by 2050. Getting there means moving four levers at once — clinker factor, thermal substitution rate, specific energy consumption, and supplementary cementitious materials — and modeling their interactions against product performance and cost.
iFactory / Cement decarbonization analytics
Model the Four Decarb Levers Together — Against Product Spec and Cost
AI optimization and emissions analytics that model clinker factor, TSR, SEC, and SCM addition together — quantifying CO2 per tonne against product performance, fuel cost, and GCCA 2030 targets on one dashboard.
~600 → 475
kg CO2/t · today vs GCCA 2030
4 levers
clinker · TSR · SEC · SCM
Model
together, not in isolation
The Problem in Decarbonization Planning
Decarbonization at a cement plant is currently modeled in silos. The process engineer optimizes clinker factor and kiln SEC in one spreadsheet. The alternative fuels team tracks TSR and calorific value in another. The product team runs SCM trials (fly ash, GGBS, calcined clay) with an eye on strength gain and setting time — but not on CO2. The sustainability lead assembles all three into an annual disclosure that reports a single CO2/t number but hides the trade-offs. When the plant needs to shave 40 kg CO2/t inside two years to hit a supplier target, the model that answers 'which lever, by how much, at what cost, without compromising 28-day strength' does not exist.
Where the Decarb Number Actually Slips
Cement CO2 intensity fails to move for a small set of predictable reasons at almost every plant. Each is fixable, but only if the levers are modeled together.
Clinker factor plateau
Blend already at 0.75 and stuck. Further reduction would fall below strength spec at 7 days. Nobody has modeled the strength gain from a fine-ground SCM alternative to lift the ceiling.
TSR ceiling too low
Alternative fuel co-processing at 15% because the pre-heater chemistry starts drifting above that. Nobody has modeled the chloride and sulphur profile that would allow 25%+.
SEC hidden waste
Kiln SEC held at 3.4 GJ/t clinker; global best practice is 3.0. Nobody has quantified the false-air, preheater efficiency, and cooler recuperation gains available.
SCM without CO2 credit
Fly ash and GGBS already added but the CO2 credit is calculated with a generic factor. Real supplier data would show a bigger cut — and support a green-cement pricing conversation.
What Good Looks Like in Decarb Modeling
A working decarbonization system holds four disciplines together — CO2 baseline per source, four-lever optimization, product-spec constraint modeling, and GCCA/PCA target alignment with milestone tracking.
CO2 Baseline
Calcination, thermal, electrical, and Scope 3 CO2 modeled per kiln line and per cement product. Every tonne of cement traceable to a defensible source-by-source intensity.
kg CO2 per tonne, per source
Four-Lever Model
Clinker factor, TSR (alternative fuel substitution), SEC (specific energy consumption), and SCM addition modeled together. The trade-off between levers quantified, not assumed.
Levers modeled jointly
Product-Spec Constraints
Strength at 3/7/28 days, setting time, chloride, alkali, sulphate — the product specifications a lever cannot break. Optimization respects the constraint envelope.
Product spec first
Roadmap Alignment
Current intensity vs GCCA net-zero roadmap and Portland Cement Association (PCA) roadmap targets. Milestone tracking against 2030 and 2050 waypoints for the specific plant.
Aligned to roadmap
How iFactory AI Fits
iFactory AI works as an analytical overlay on your DCS, laboratory system (Polysius, KIMA, ABB), fuel management, and product testing — turning source data into a defensible four-lever decarbonization model without replacing the systems your process team already trusts.
CO2 Ledger
Analytics Layer
Per-line, per-product CO2 breakdown by source (calcination, thermal, electrical, Scope 3). The ledger every optimization run references and every disclosure ties back to.
Lever Optimizer
Analytics + Lab
Optimizer that moves clinker factor, TSR, SEC, and SCM together to minimize CO2 subject to product-spec constraints and cost bounds you set.
Scenario Library
Analytics Layer
Named scenarios (30% TSR by 2027, clinker factor 0.68 by 2028) with CO2, cost, and product-quality impact quantified — for capital planning and board-level target commitments.
Roadmap Tracker
Analytics + Reporting
Live intensity vs GCCA and PCA milestone waypoints. Deviation triggers a review before the next disclosure cycle, not after.
Ask your process team how much CO2 you would cut if you dropped clinker factor by 0.03 and lifted TSR to 25% at the same time. If the answer is a range or a guess, the joint model doesn't exist — and every year without it costs measurable ground on the 2030 target. Book a decarbonization review.
12-Week Modeling Pilot on One Kiln Line
One kiln line, one cement product family, twelve weeks. The pilot is scoped to build a defensible four-lever model, run three scenarios against it, and quantify the CO2 cut available inside product-spec constraints.
Weeks 1–2
Baseline & Data
Pull twelve months of clinker factor, TSR, SEC, SCM, product-test, and CO2 data for one kiln line. Establish the current baseline intensity source by source.
Weeks 3–4
Model Build
Build the four-lever model with product-spec constraints from your lab data. Validate the model against a known past period. Emission factors tied to your supplier data where available.
Weeks 5–8
Scenarios Run
Run three named scenarios: max clinker cut, max TSR lift, combined optimum. CO2 impact, cost impact, and product-spec risk quantified for each. Reviewed with process, fuel, and product teams.
Weeks 9–12
Roadmap Match
Twelve-week window closes. Selected scenario becomes the 24-month decarbonization plan. Roadmap alignment against GCCA 2030 confirmed. Rollout to remaining kiln lines scoped.
Who Owns the KPI
Decarbonization crosses process engineering, alternative fuels, product development, and sustainability. Each function needs a specific KPI they own or the four-lever model stays theoretical.
Process Head
Kiln SEC (GJ/t clinker)
Owns the thermal-efficiency lever — the specific energy consumption per tonne of clinker. Global best practice is around 3.0 GJ/t; gap to that is the number to work.
Alt Fuels Manager
TSR (%) with chemistry compliance
Owns the substitution lever — thermal substitution rate against calorific and chemistry limits. Rising TSR without chloride, sulphur, or NOx drift is the discipline.
Product Lead
Clinker factor at spec compliance
Owns the composition lever — the clinker factor achievable while meeting product spec at 3/7/28 days. Every 0.01 reduction traces to a measured CO2 cut per tonne.
Sustainability Lead
kg CO2 per tonne cement vs roadmap
Owns the outcome — the plant's cement CO2 intensity and its position on the GCCA and PCA roadmap. The number that reconciles operational levers to the board target.
FAQ
Is 475 kg CO2 per tonne by 2030 actually reachable without CCUS?
For most cement plants, most of the way — yes. The four operational levers (clinker factor to 0.65 range, TSR to 30-50%+, SEC to global best practice, SCM addition where local supply exists) collectively account for the largest share of the GCCA roadmap cut through 2030. CCUS enters the roadmap for the residual — the calcination emissions that no operational lever can eliminate — and scales from 2030 onward. A plant that maximises the four levers first buys time on the CCUS decision and typically lowers the CCUS retrofit scope when it comes.
How does SCM economics work if we're already using fly ash and GGBS?
The economics shift as the SCM supply chain shifts. Fly ash availability is declining in markets that are phasing out coal generation, forcing SCM sourcing toward GGBS, calcined clay (LC3 blends), and natural pozzolans. Each has different transport cost, availability, and reactivity profile. The four-lever model treats SCM addition as an optimization variable with supply-cost bounds — not as a fixed input — so scenarios can compare 'more fly ash' versus 'shift to calcined clay' on a common CO2 and cost basis.
Book a demo to see an SCM shift modeled live.
What about CBAM and how it affects the modeling?
EU CBAM (Carbon Border Adjustment Mechanism) applies to cement imports into the EU from 2026 and requires embedded emissions to be reported with a defensible methodology. For plants exporting to the EU, the four-lever model's per-tonne intensity output is the input to the CBAM declaration — with the same source-data traceability the reasonable-assurance auditor requires. For plants competing against imports, CBAM raises the cost of high-intensity foreign cement, which changes the payback economics on decarbonization investment. The model can run both perspectives.
Stop planning decarbonization one lever at a time.
Model One Kiln Line's Four Levers Together — Live
Bring twelve months of clinker factor, TSR, SEC, and SCM data for one kiln line, plus your product-spec test history. We'll build the four-lever model in a session, run three scenarios, and quantify the CO2 cut available inside your spec envelope.
GCCA + PCA
roadmap aligned
Spec-constrained
optimization
-syncs-back-to-mes-and-spc-in-real-time.png)