AI for Cement Plant Root Cause Analysis of Quality Deviations
By James C on August 27, 2026
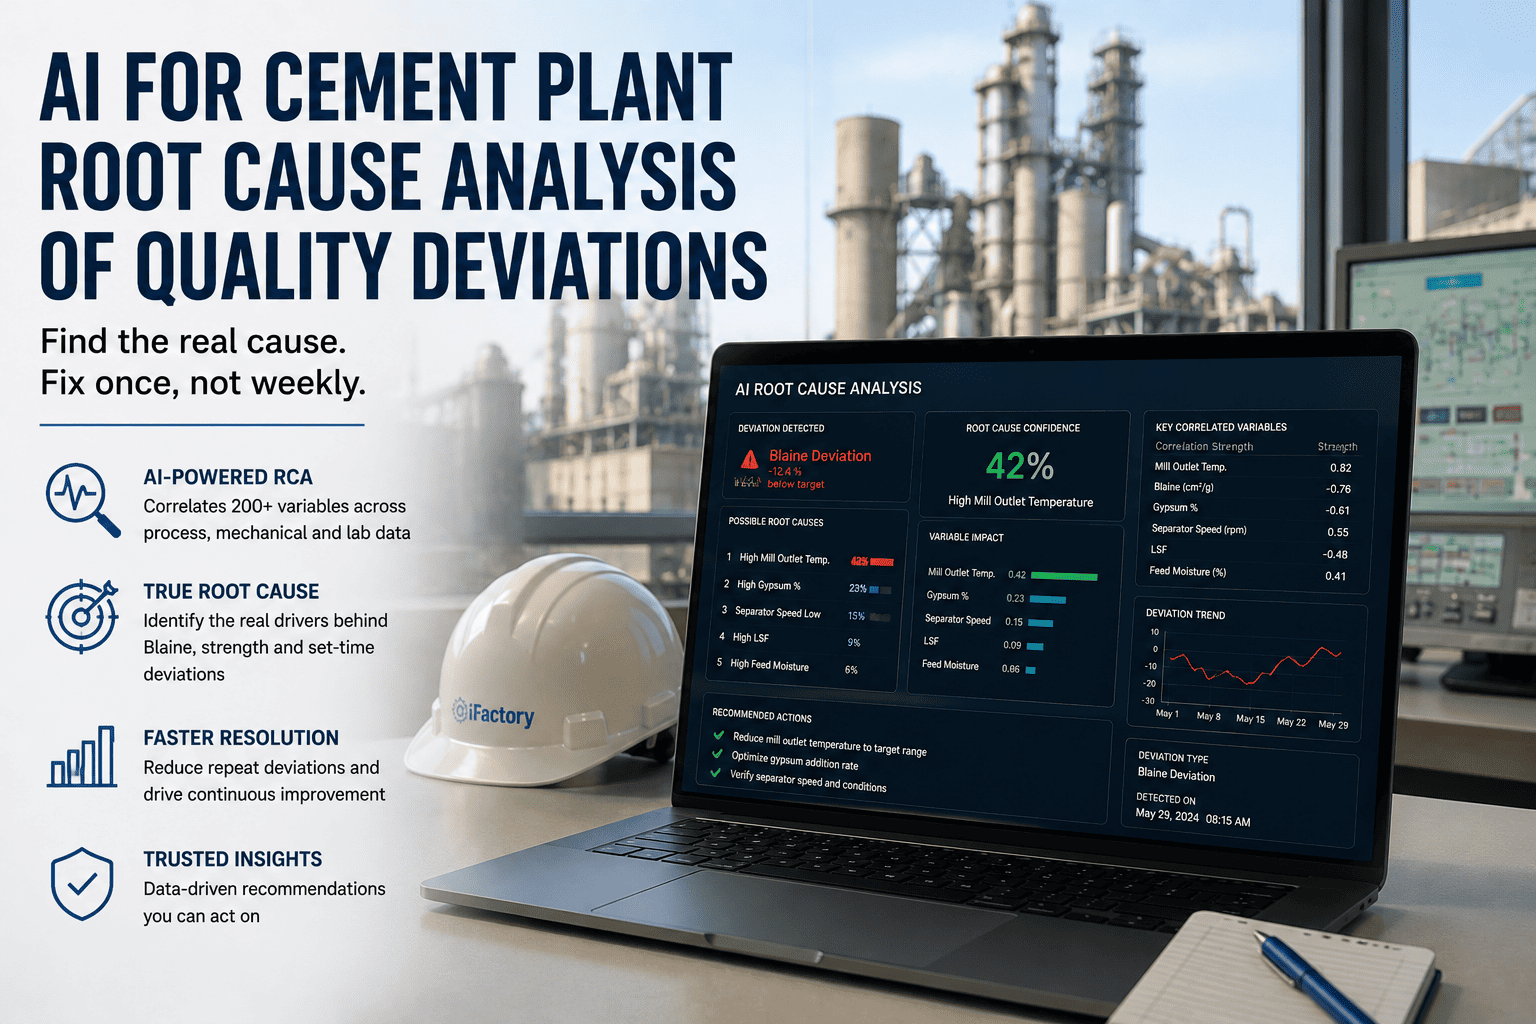
Every quality engineer knows the feeling. The 28-day strength comes back low, again. The team pulls a fishbone diagram, runs a five-why, blames the usual suspect — the gypsum, the separator, the moisture — makes a change, and the number recovers. Then three weeks later it drops again, because the thing you fixed was a symptom, or a variable that merely moved alongside the real cause, not the cause itself. Cement quality is decided by hundreds of interacting variables spread across process, mechanical, and lab systems, many of them acting with days or weeks of delay. Manual root cause analysis on siloed data cannot untangle that, so the same deviation keeps coming back. iFactory's AI Root Cause Analysis Engine correlates 200+ variables to surface the true driver behind a Blaine, strength, or set-time deviation — so you fix it once.
Quality Root Cause Analysis for Cement Plants
AI for Cement Plant Root Cause Analysis of Quality Deviations
Correlate 200+ process, mechanical, and lab variables to find the true root cause of Blaine, strength, and set-time deviations — with the contributing chain and the delay accounted for. Stop chasing symptoms and fix the deviation once, not weekly.
Recurring quality deviations are rarely a sign of a careless team — they are a sign that the investigation is outmatched by the problem. A manual root cause analysis can hold a handful of variables in view and reason about them one at a time. But cement quality does not fail one variable at a time; it drifts because several correlated things moved together, often triggered by something that happened days earlier and stages upstream. When the analysis reaches for the nearest plausible cause, it fixes something, and the recovery seems to confirm it — until the real driver reasserts itself and the deviation returns.
Two Hundred Variables, One Root Cause
The reason quality RCA is hard is breadth. The variables that can move Blaine, strength, or set time live in three separate systems that rarely talk to each other, and the true cause is a needle somewhere across all of them.
The engine correlates all 200+ across every silo, over the full history, to find the thread a manual analysis cannot hold
The Diagnosis, Not a Guess
Instead of one plausible cause, the engine returns the ranked contributors to the deviation, the most probable root cause behind them, and the causal chain that connects it to the result — including the variable that everyone usually blames but that is only riding along.
Root cause analysis — 28-day strength deviation
28-day strength down 3.2 MPa vs target · recurring
The gypsum was the usual suspect and a real contributor — but the recurring driver is upstream LSF control. Fix that and the deviation stops coming back.
Why the Cause Hides: Distance and Delay
The reason a manual investigation misses the real driver is that the symptom and the cause are separated by both distance and time. A strength result seen today was set in motion by raw-mix chemistry weeks ago, several process stages upstream. The engine aligns those lags automatically, so it can connect a deviation to a cause that a person, looking at this week's data, would never line up.
Tracing a strength result back to its cause
Raw mix / LSF
the cause
kiln
Clinker C3S
hours later
mill + silo
Cement
days later
cure
Strength result
28 days later
Symptom on the right, cause on the left, nearly a month apart. Aligning that delay is exactly what defeats manual analysis and what the engine does by default.
Fix Once, Not Weekly
The measure of a real root cause analysis is simple: the deviation stops recurring. When the true driver is addressed rather than a symptom, the weekly firefight ends.
Chasing symptoms produces the sawtooth on the left — recovered, then back again. Addressing the true root cause produces the flat line on the right.
How many hours a month does your team spend re-investigating the same deviation? Book a 30-minute demo and we'll run the engine on one of your recurring ones.
What AI Root Cause Analysis Delivers
Bringing the whole plant's data to bear on a deviation changes both the answer you get and how long it takes to get it.
True
Root cause
the driver, not the nearest suspect
Stops
Recurring
fixed once instead of every week
Faster
Investigation
minutes across 200+ variables
Unified
Process, mechanical, lab
one view instead of three silos
Frequently Asked Questions
Does the AI prove causation, or just correlation?
It surfaces the most probable root cause, not a mathematical proof. By combining multivariate correlation across the full history with time-lag alignment and known cement relationships, it separates the variables that merely move alongside a deviation from the one most likely to be driving it, and ranks the contributors. The output is a strong, evidence-based candidate with its causal chain, which your engineers confirm — but that is a far better starting point than a manual guess, and it is what breaks the recurrence.
How does it handle the long delays in cement, like 28-day strength?
Delay is central to how it works. The engine aligns each variable to the deviation with the correct lag, so a raw-mix change weeks ago and stages upstream can be connected to a strength result seen today. That automatic lag handling is precisely what manual analysis struggles with, because a person naturally looks at the data around the time the problem appeared rather than when its cause occurred.
Where does the 200+ variables figure come from?
From unifying data that normally sits apart: the process signals in your control system and historian, the mechanical condition data from your equipment, and the results in your lab system. Individually each is familiar; the value is in correlating them together against the deviation, because the true cause often lies in a relationship that spans two of the silos. The exact count varies by plant and by what is instrumented.
How is this different from your quality prediction?
They answer different questions. Quality prediction estimates what Blaine or strength will be, in real time, so you can control to target. Root cause analysis explains why a deviation happened once it has, so you can stop it recurring. They complement each other — prediction keeps you on target day to day, RCA removes the underlying problems that keep knocking you off it.
How do we try it?
Bring a deviation you have fought more than once. The best next step is a demo where we point the engine at a recurring Blaine, strength, or set-time problem using your own process, mechanical, and lab history, and show the ranked contributors, the probable root cause, and the causal chain. Seeing it explain a deviation you already know well is the clearest test.
Stop Chasing Symptoms.
Find the True Cause of Your Recurring Deviation
Bring a Blaine, strength, or set-time deviation you have fixed more than once. We'll run the engine on your process, mechanical, and lab history and show the ranked contributors, the most probable root cause, and the chain that connects it — so you can fix it once.