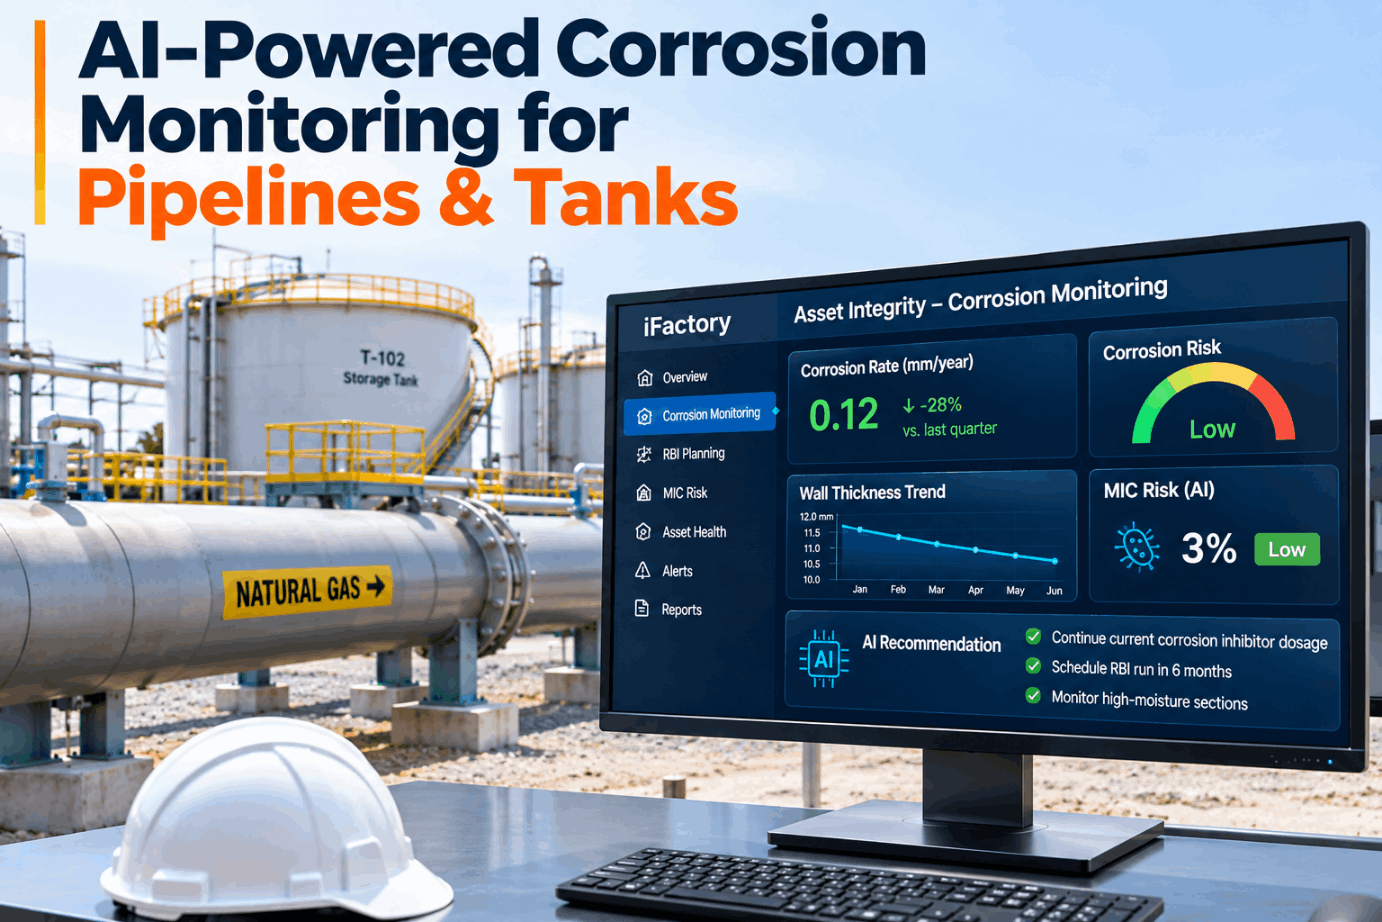
AI-Powered Corrosion Monitoring for Pipelines & Tanks

By James C on November 3, 2026

ai-corrosion-monitoring-pipelines-tanks

Corrosion is slow, patchy and easy to underestimate. One low point holds free water, one tank floor sits on damp sand, one crossing picks up stray current, and the evidence sits in an ILI report, a coupon spreadsheet and a CP survey file that nobody reads together. AI corrosion monitoring pulls those sources into one view, trends the rate for every segment and tank, and tells your integrity team where to look next. See it on sample segment data in a short integrity demo.

AI INTEGRITY ANALYTICS · PIPELINES AND TANKS

Predict Wall Loss on Pipelines and Tanks Before It Becomes a Repair

iFactory combines ILI, coupons, ER probes, CP surveys and sampling into one corrosion rate per segment and per tank. It ranks where to inspect next, grades MIC risk and shows whether your inhibitor dose is doing its job.

Line 14 · KP 22.4Rank 1 of 86
Low point · ILI and ER probe combined
6 o'clock
Nominal 9.5 mmMin 7.1 mm25% wall loss
Free water at low pointInhibitor 18 ppm vs 25 target
Illustrative values · next step: UT at the low point
ILI runsER probes and couponsCP and CIS surveysGas and water samplingTank floor scans
INTERNAL VS EXTERNAL CORROSION

Two Attack Fronts, Different Evidence for Each

Internal corrosion needs liquid water. Dissolved CO2, H2S and oxygen and microbial activity set how fast it moves, and it collects at low points, dead legs and tank bottoms. External corrosion depends on coating condition and cathodic protection, and on stray current from power lines or other pipelines nearby. The two need different data and different fixes, so iFactory scores them separately for every segment. Ask our integrity support team how your segments are split today.

Internal
Free waterCO2H2SOxygen ingressMICLow flow
EvidenceILI internal metal loss, coupons, ER probes, gas and water analysis
Usual fixesDehydration, cleaning pigs, inhibitor and biocide
External
Coating damageLow CPAC and DC interferenceWet soilsCP shielding
EvidenceILI external metal loss, test station readings, CIS, DCVG and ACVG
Usual fixesCoating repair, rectifier and anode work, interference mitigation
PIPELINE CORROSION AI DATA SOURCES

What Each Source Measures, and What It Misses

No single method sees everything. ILI gives a full-length snapshot every few years, probes and coupons give a local rate between runs, surveys show protection levels and sampling shows whether the conditions for corrosion are present. The value comes from reading them together. Compare your current sources with ours in a data mapping call.

Source
What it measures
Cadence
Strength
Limit
ILI (MFL, UT)
Metal loss depth, length and clock position along the line
Each assessment interval
Full-length coverage
A snapshot, with tool tolerance on depth
Coupons
Mass loss and pit type over the exposure period
Weeks to months per exposure
Direct and simple; shows pitting
One spot, averaged over time
ER probes
Metal loss as a change in electrical resistance
Near-continuous
Fast response to process changes
One spot; less sensitive to pitting
UT readings
Remaining wall at fixed points
Surveys or fixed sensors
Precise local thickness
Only where the sensor sits
CP surveys
Pipe-to-soil potential (test stations, CIS) and coating faults (DCVG, ACVG)
Annual readings plus surveys
Shows where protection is weak
Indirect; needs interpretation
Gas and liquid sampling
Water, CO2, H2S, O2, solids and bacteria
Per sampling plan
Shows the cause, not just the effect
A moment in time
MIC testing
Microbial populations by qPCR or culture
With sampling and at digs
Evidence for MIC risk
Bacteria present is not proof of MIC
CORROSION RATE PREDICTION

Turning Scattered Readings Into One Rate per Segment

A rate is only useful if you know where it came from. iFactory keeps the long-term rate from comparing successive ILI runs and the short-term rate from probes and coupons side by side, and plans on the more conservative one unless an engineer records why not. When the short-term rate jumps, the model looks for a cause in flow, water and inhibitor data. Review a rate history with our corrosion engineers.

ER probe P-7 · Line 14 · mm/yrIllustrative
0.06Q3 '25
0.07Q4 '25
0.08Q1 '26
0.17Q2 '26
0.24Q3 '26
Long-term rate0.11 mm/yr from ILI comparison
What changed in Q2Free water after a dehydrator upset
Planning rate0.24 mm/yr, the higher of the two
WALL THICKNESS AI · REMAINING LIFE

Remaining Life Is Simple Arithmetic on Honest Inputs

The core sum is (actual thickness − minimum required thickness) ÷ corrosion rate. The hard part is the inputs: a measured minimum, a defensible required thickness and the right rate. API 570 limits the next thickness check on in-service piping to half the remaining life. On transmission pipelines, a pit is judged on remaining strength, for example with ASME B31G methods, not on thickness alone. Check the sum on your own data in a remaining life walkthrough.

Nominal wall9.5 mm
Actual minimum wall, UT at the low point (assumed)7.1 mm
Wall loss so far(9.5 − 7.1) ÷ 9.5 = 25.3%
Minimum required wall (assumed)5.6 mm
Available margin7.1 − 5.6 = 1.5 mm
Life at long-term rate, 0.11 mm/yr (assumed)1.5 ÷ 0.11 = 13.6 years
Life at short-term rate, 0.24 mm/yr (assumed)1.5 ÷ 0.24 = 6.25 years
Plan on 6.25 years · next look within half6.25 ÷ 2 ≈ 3.1 years, sooner if the rate climbs
MIC PREDICTION FOR OIL AND GAS

Scoring MIC Risk Without Pretending to See Microbes

Microbiologically influenced corrosion cannot be seen from a control room. What can be scored is the likelihood: water that sits still, temperatures microbes like, nutrients, sampling results and the shape of past pits. iFactory combines these into a risk grade and names the sample or dig that would confirm or clear it. NACE TM0212 describes how to test for MIC on internal pipeline surfaces. Set up MIC scoring rules with our integrity team.

Free water held at low pointPresent
Flow below water sweep rateYes, at low demand
Biocide program on this lineNone
qPCR on pig returnsPending
Pit shape from last digNot yet examined
Low
Watch
Elevated
Confirmed by test

A grade is a prompt for sampling, not a finding. Only lab results and pit examination move a segment to confirmed.

Know Which Segment to Dig First, and Why

iFactory ranks segments and tanks by predicted wall loss and explains each rank in plain words. Your integrity engineers check the reasoning and make the decision.

Line 14 · Integrity engineer and iFactory
EngineerWhy is KP 22.4 ranked first this week?
iFactoryThree things moved together: free water at the low point since the spring dehydrator upset, the ER probe rate up from 0.08 to 0.24 mm/yr, and inhibitor residual at 18 ppm against a 25 ppm target.
EngineerIs it MIC?
iFactoryNot known yet. The MIC grade is elevated but the qPCR result is pending. I suggest UT at the low point and a pig-return sample before any dig.
CORROSION INHIBITOR OPTIMIZATION

Closing the Loop Between Dose, Residual and Rate

Inhibitor programs often run on a fixed pump rate set years ago. The better test is whether the residual reaches the far end of the line and whether the measured rate responds. iFactory links pump rate, flow, residual tests and probe data, and suggests dose changes that a person approves with your chemical supplier. Walk through an inhibitor loop in a dosing review session.

1MeasureResidual at the injection point and far-end test points
2CompareAgainst the target residual agreed with your supplier
3Check responseDoes the probe rate fall after a dose change?
4SuggestDose per unit of flow proposed, with the reasoning shown
5ApproveEngineer or supplier signs off; the field team sets the pump
GATHERING SYSTEM CORROSION

Why Gathering Lines Corrode Differently

Gathering lines carry wet, untreated gas and produced water, often at low and changing flow, so water and solids settle where a dry transmission line stays clean. PHMSA's 2021 gas gathering rule brought many Type C lines under corrosion control and other Part 192 requirements, and extended incident and annual reporting to Type R lines. Ask our support team how gathering segments are scored.

Produced water and solidsSettle at low points and under deposits, where inhibitor struggles to reach.
Oxygen ingressVapour recovery and low-pressure systems can pull in air, which speeds corrosion sharply.
Falling flowAs wells decline, flow falls below the rate that sweeps water out of low points.
Mixed recordsSteel, plastic and older lines with gaps in their history share the same system.
STORAGE TANK CORROSION

Tank Floors Under API 653: Where the Loss Hides

On aboveground tanks, the floor is the hard part: product-side pitting from water bottoms and soil-side corrosion you cannot see from inside. API 653 sets a minimum floor thickness at the next internal inspection, generally 0.10 in., or 0.05 in. with a release prevention barrier or a qualifying lining. It caps internal inspection intervals at 20 years, or 30 with a barrier, though RBI under API 580 can support other intervals where API 653 allows. MFL floor scans with UT follow-up feed iFactory's floor model. Review a floor scan with our tank integrity specialists.

Tank 31 · MFL floor scan · illustrative
Lowest reading, near the sump0.14 in.
Product-side rate (assumed)0.002 in./yr
Soil-side rate (assumed)0.001 in./yr
Years to next internal (assumed)10
Projected at next internal0.14 − 10 × 0.003 = 0.11 in.
Low lossModerateHighDeepest
PHMSA CORROSION RULE CHANGES

What the 2022 Gas Transmission Rule Changed for Corrosion

PHMSA's gas transmission final rule, published in August 2022 and effective May 24, 2023, tightened several corrosion requirements in 49 CFR Part 192. The summary below is a guide, not the legal text, so check the current regulation before acting. Map these duties to your records with our compliance support team.

§192.319 · §192.461Coating check after backfillAn above-ground coating survey, such as DCVG or ACVG, after backfill on onshore transmission projects of 1,000 ft or more, with damage repaired.
§192.465CP deficiencies and close-interval surveysLow readings evaluated, deficiencies generally corrected within one year, and close-interval surveys where a test station shows inadequate protection.
§192.473Interference current surveysSurveys when stray current rises or new sources appear, plus a remedial plan where AC current density reaches 100 A/m². Permits within 6 months; work done within 15 months of the survey or 6 months after permits, whichever comes first.
§192.478Internal corrosion monitoringWhere CO2, H2S, sulfur, microbes or liquid water are present, a monitoring and mitigation program, evaluated at least once each calendar year at intervals of no more than 15 months.
RBI PLANNING SOFTWARE

Plan Inspections and ILI Runs by Risk

Risk-based inspection under API 580 (4th edition, 2023) and the API 581 methodology (4th edition, 2025) applies to station piping, vessels and tanks, and yard piping also falls under API 570 (5th edition, 2024). Pipelines follow integrity management under 49 CFR Part 192 subpart O or §195.452, guided by ASME B31.8S for gas and API RP 1160 (3rd edition, 2019) for liquids. iFactory feeds both with the same corrosion rates, so the next run, dig or tank entry goes where risk is highest. See a ranked plan in a risk ranking demo.

1
Line 14 · KP 22.4 low pointRate up, free water, inhibitor below target
UT and sample this month
2
Tank 31 floorProjected 0.11 in. near the sump at next entry
Keep entry date, review soil side
3
Line 9 · river crossingLow CP readings after a rectifier fault
CIS in both directions
4
Station discharge header dead legShort-term rate above long-term rate
UT and API 570 interval check
5
Gathering line G-3Oxygen found at the vapour recovery tie-in
Seal ingress, add a probe
TURNKEY AI DEPLOYMENT

Integrity Models on a Server You Rack Yourself

iFactory delivers a pre-configured NVIDIA AI server racked and ready. Corrosion rate, MIC risk and tank floor models come pre-loaded, along with importers for ILI listings, probe data, CP survey files and lab results. You rack it, plug in power and Ethernet, and the AI is live. For a project scope sheet, contact our deployment engineers.

What's Included
  • Pre-configured NVIDIA AI server, racked and ready
  • Importers for ILI listings, CP survey files and lab results
  • Links to probe, coupon and SCADA data
  • Corrosion rate models for segments and tanks
  • MIC risk grading and inhibitor loop tracking
  • Ranked inspection plan with the reasons shown
  • Remote help with model tuning and hardware
Live in 6–12 weeks
Wk 1–4
Gather the Records

Past ILI runs, coupon and probe data, surveys and dig reports loaded and matched to segments.

Wk 5–8
Calibrate Against Digs

Rates and ranks checked against known dig results with your integrity engineers.

Wk 9–12
Go Live

Ranked plan, alerts and a weekly integrity review switched on.

HOW iFACTORY FITS

AI Integrity Analytics That Supports Your Integrity Program

iFactory sits beside your integrity management program and records. It ranks and explains, and your engineers decide. Watch it work in a live integrity walkthrough.

1
One rate per segment. ILI, probes, coupons and surveys combined, with the source of every rate shown.
2
Risk you can explain. MIC and external corrosion graded with the reasons listed.
3
Dose tied to result. Inhibitor residual and rate response tracked together.
4
Plans by risk. Digs, ILI runs and tank entries ranked for the next budget cycle.
1000+
Industrial clients running iFactory
99.9%
Platform uptime for integrity data
6-12 wks
From power-on to the first ranked dig list
FREQUENTLY ASKED QUESTIONS

What Integrity Managers Ask About AI Corrosion Monitoring

Can AI see corrosion inside a buried pipeline?
No. It predicts where corrosion is likely and how fast, from measured data. Only an inspection such as ILI, UT or a dig confirms wall loss. iFactory tells you where that inspection is most likely to find something.
How does iFactory predict MIC?
As a risk grade, not a detection. It combines water hold-up, flow, temperature, sampling results and pit history. Confirmation needs testing such as qPCR or culture on samples, plus examination of the pits. See how a MIC grade is built in a short session.
Does it support API 570 and API 653 work?
Yes. For station and terminal piping under API 570 and aboveground tanks under API 653, it calculates corrosion rates and remaining life and flags intervals that need a review. Your authorized inspectors still set and sign the intervals. Transmission lines follow Part 192 or 195 integrity management instead.
What data do we need to begin?
At least one ILI run or thickness survey, plus whatever probe, coupon, CP and sampling data you have. Gaps are fine: the model shows lower confidence where data is thin. Our support team can check your files before a pilot.
Will it change our inhibitor pump rates automatically?
No. It suggests a dose with the reasons behind it, and a person approves and makes the change with your chemical supplier. Walk through the dosing logic with our team.
Where should a first project focus?
On one system with a known problem, such as a wet gas line with rising probe rates or a tank due for entry. Load its history, compare iFactory's ranking with your engineers' view and past dig results, then widen the scope. Book a 30-minute integrity demo to scope it.

See Every Segment and Tank Floor Ranked by Risk

Combine ILI, probe, coupon, CP and sampling data, trend one honest corrosion rate and send the next dig, run or tank entry where it counts. Delivered turnkey and live in 6 to 12 weeks.
Example weekly integrity summary
Assets scored86 segments, 12 tanks
Top rankLine 14 · KP 22.4 low point
MIC grade elevated2 segments, samples pending
Inhibitor below target3 injection points
Plan: UT at KP 22.4 this month

Share This Story, Choose Your Platform!