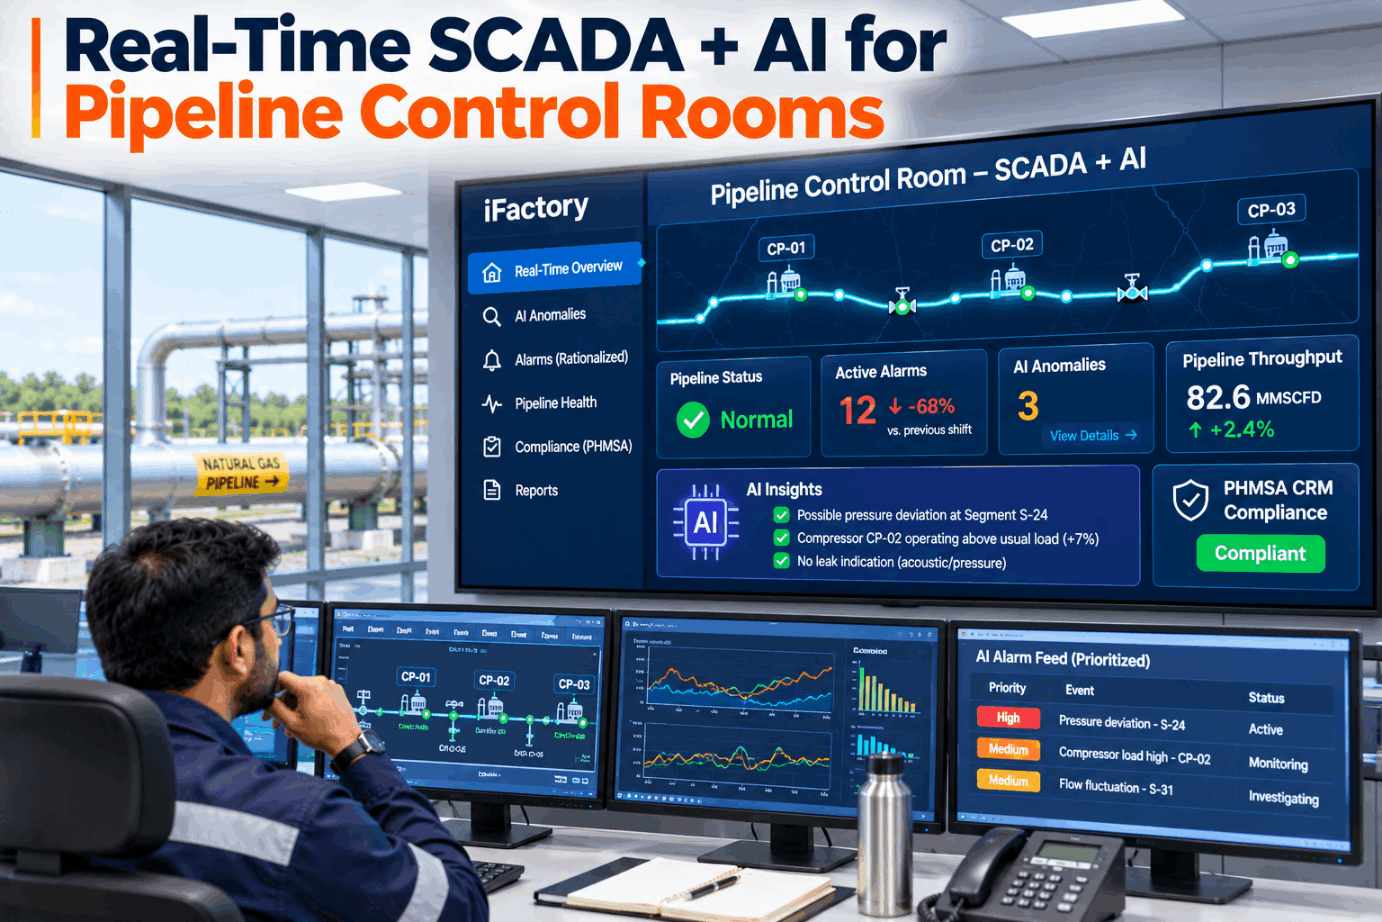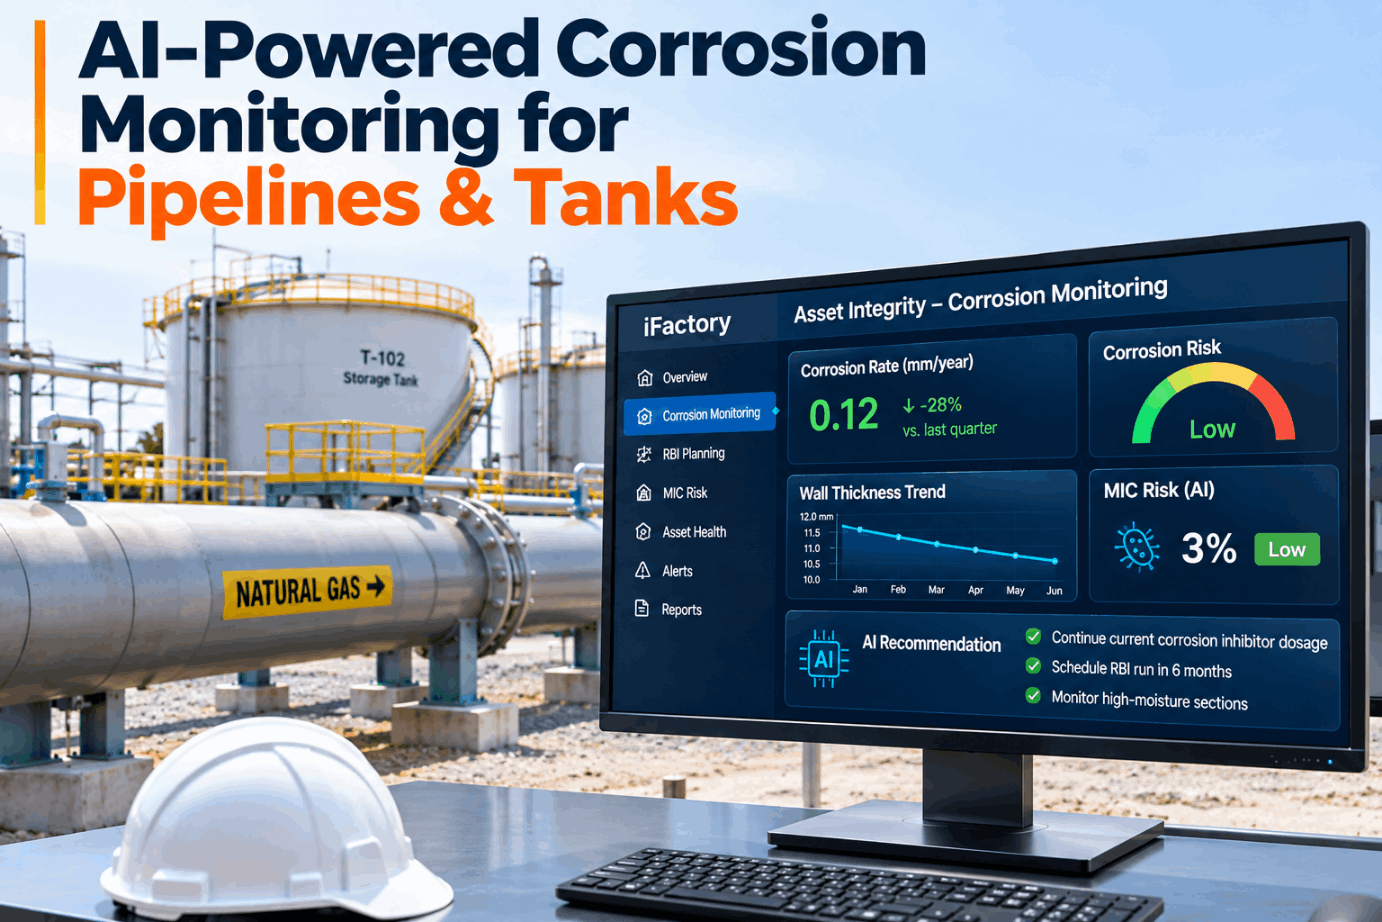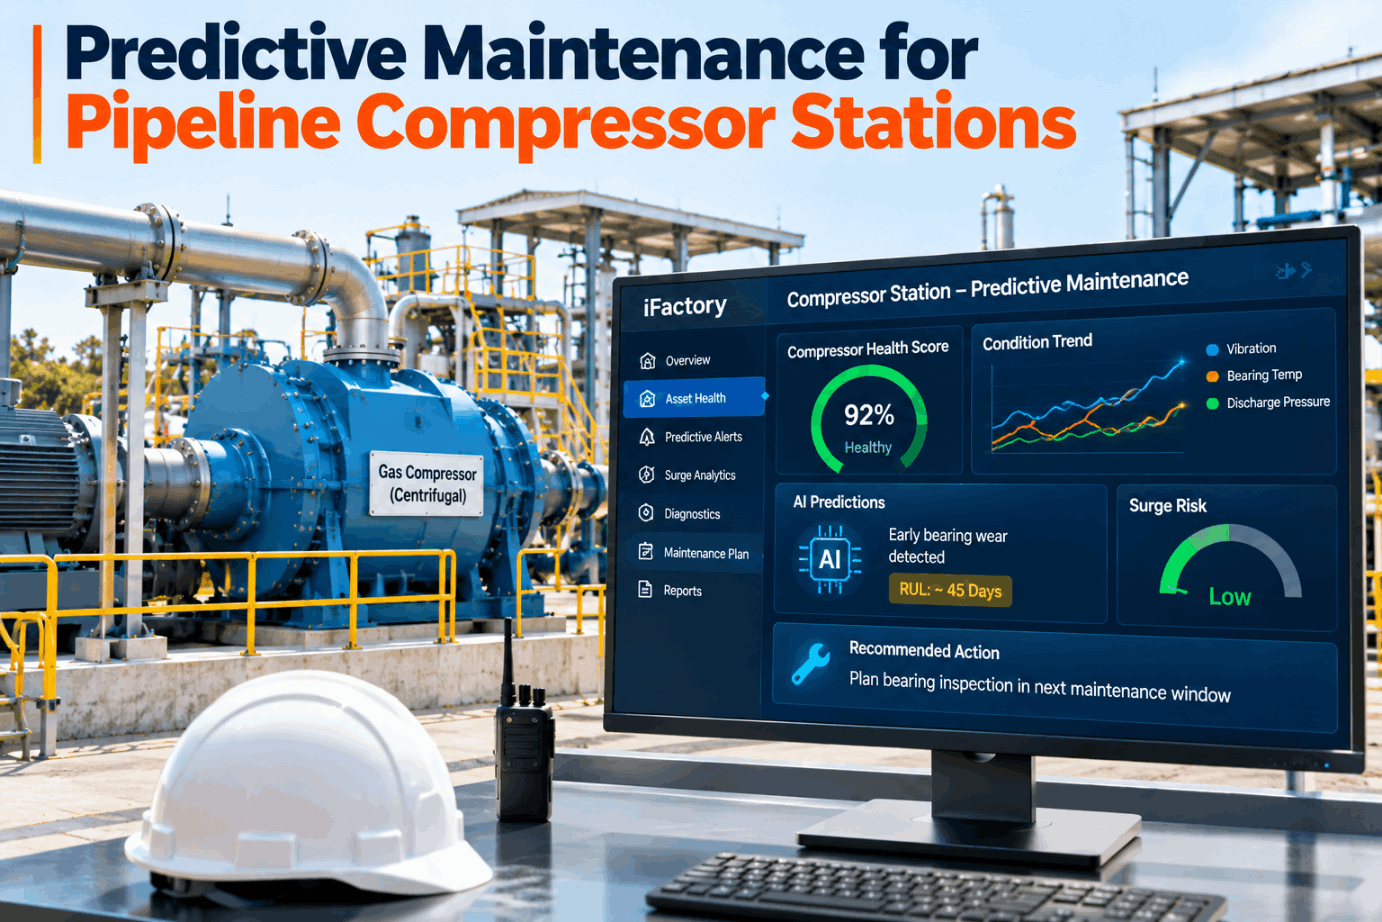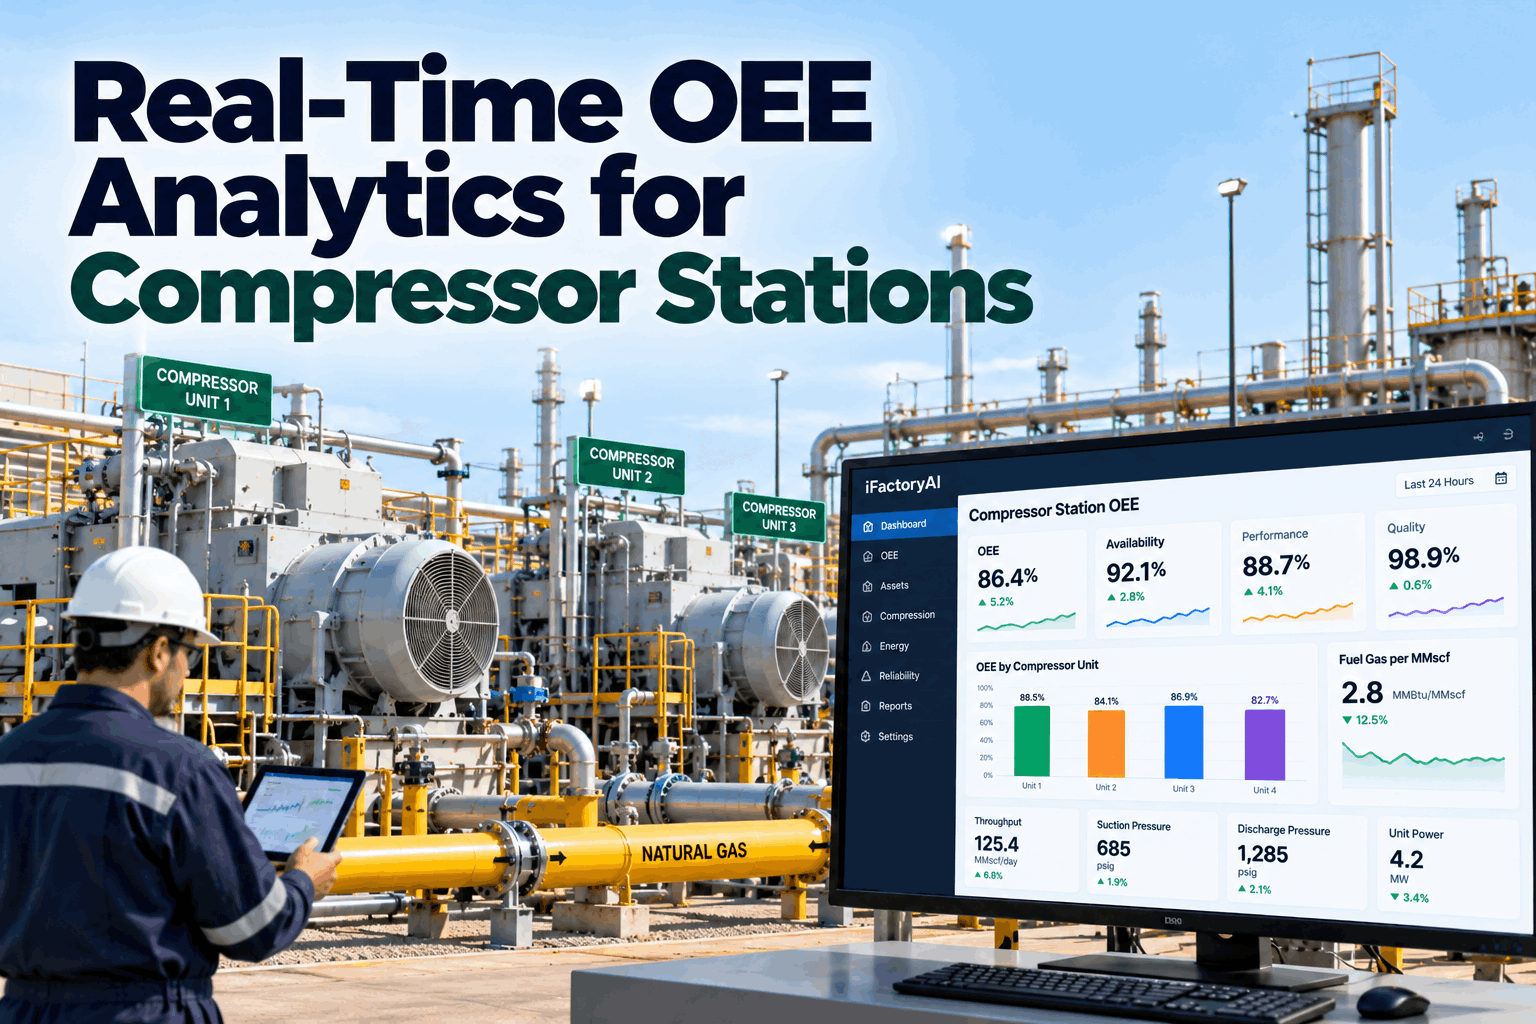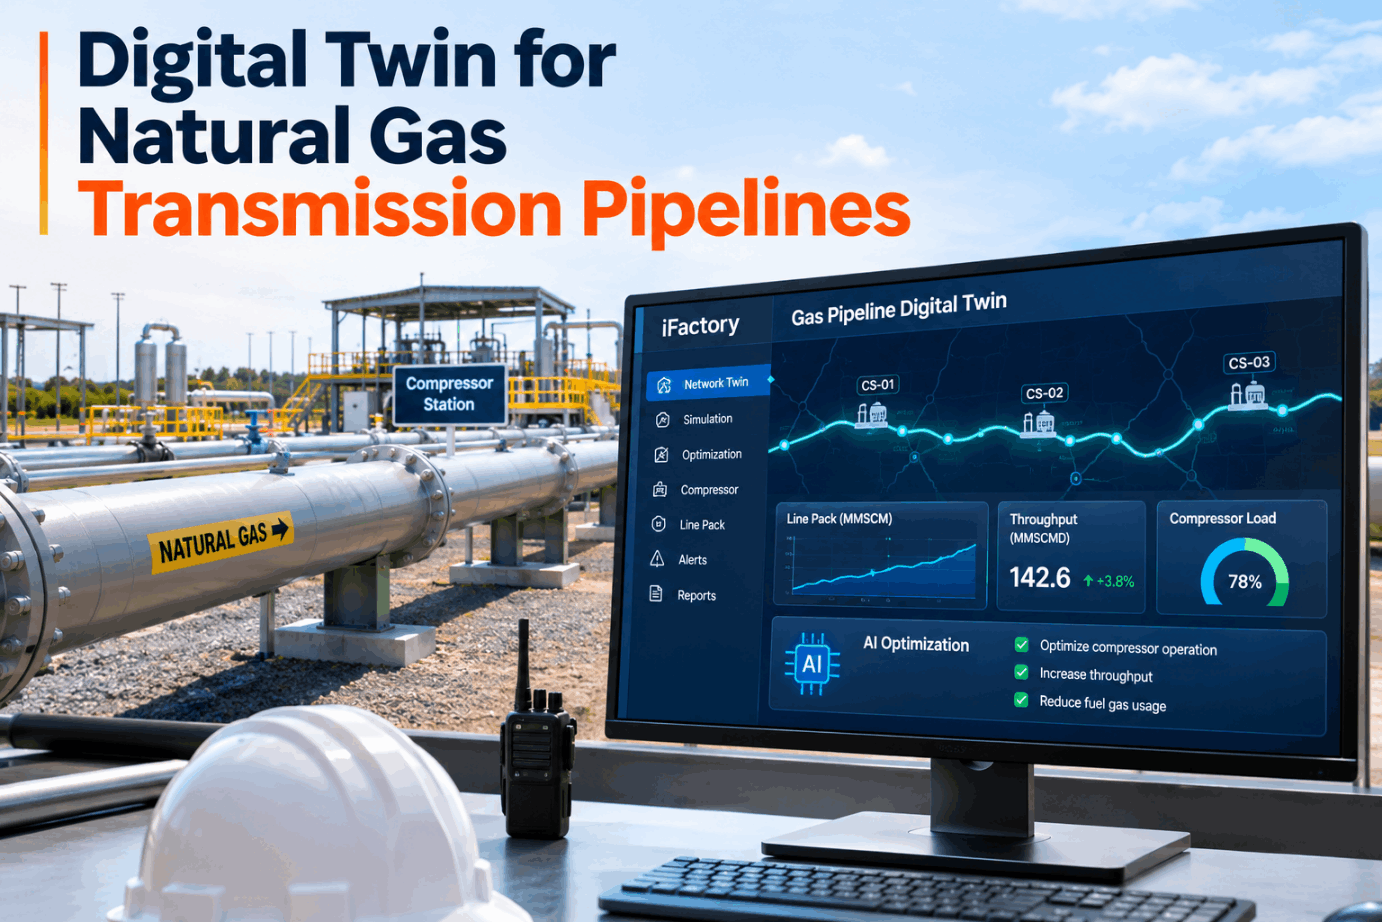
A gas transmission controller always works with incomplete information. SCADA reports pressures and flows at stations and meters, but not what happens in the hundreds of miles of pipe between them, or what the system will look like at six tomorrow morning when a cold front arrives. A gas pipeline digital twin fills that gap with a calibrated hydraulic model that runs alongside live data, tracks line pack hour by hour and tests compressor moves before anyone makes them. See how it handles a cold-snap morning in a short pipeline twin demo.
See Line Pack, Station Load and Tomorrow's Pressures Before the Gas Day Turns
iFactory Digital Twin + AI Optimization runs a transient model of your mainline next to live SCADA. It projects pressures and line pack hours ahead and suggests compressor set points that meet delivery pressures with less fuel burned.
Steady-State and Transient Models Answer Different Questions
Most gas pipeline models fall into two families. A steady-state model assumes flows and pressures are not changing, which suits capacity studies and design checks. A transient model solves how pressure waves and flow changes move through the pipe over time, which is what a controller faces during a real gas day. The twin uses both, and the difference matters for how much you should trust each answer. Talk through your current modelling setup with our hydraulics support team.
- Assumes receipts equal deliveries and nothing is moving in time
- Answers "can this system carry X MMscf/d at these pressures?"
- Fast, good for capacity, expansion and outage planning
- Cannot show packing, drafting or how long a pressure dip lasts
- Tracks how pressure and flow change hour by hour along the line
- Answers "where will pressure be at 06:00 if load ramps at 05:00?"
- Shows line pack rising and falling through the gas day
- Needs good initial state from SCADA and regular calibration
The Schedule Changes Five Times a Day, the Pipe Has to Keep Up
In the US, the standard gas day runs from 9:00 a.m. to 9:00 a.m. Central Clock Time, and shippers can change their scheduled quantities in five NAESB nomination cycles. Each cycle can shift receipts and deliveries, so the controller manages the gap through line pack, the gas stored in the pipe itself. Packing raises average pressure ahead of a peak; drafting draws it down when deliveries run ahead of receipts. The twin shows each cycle's effect before flows change. Watch a full gas day replay in a line pack session.
When a shipper takes more than it nominated, or a supply point under-delivers, the difference comes out of line pack. The twin tracks that imbalance against your operating limits so the controller sees how many hours of cushion remain, not just today's total.
How Much Gas Is in the Pipe, Worked Through
Line pack is usually reported in MMscf for a segment or Bcf for a whole system. At its simplest it is the pipe's internal volume converted to standard conditions using average pressure, temperature and gas compressibility. The example below uses assumed inputs and holds compressibility and temperature constant to keep the arithmetic visible. A real twin calculates it section by section along the line. Ask our support engineers how your SCADA estimate compares.
In practice Z rises as pressure falls, so the true change is a little smaller than this simple sum. That is why the twin uses an equation of state, such as AGA Report No. 8, with live gas composition rather than one fixed factor.
Seven Inputs That Decide Whether the Model Can Be Trusted
A pipeline hydraulics model can never be better than the data feeding it. Most of what it needs already exists in SCADA, GIS and engineering records. The work is in lining it up, checking it and keeping it current as the system changes. Map your data sources against this list in a data readiness call.
Ask the Twin Before You Move a Unit
Controllers can type a what-if in plain words and get a projected profile back in minutes. The twin shows which delivery points stay above contract pressure, how line pack moves, and what each option costs in fuel. The controller still makes the call.
Set Points, Units Online and the Fuel Gas They Burn
Most transmission compressor stations burn pipeline gas to drive their turbines or engines, so every horsepower has a fuel cost that comes straight out of the gas stream. The controller's levers are discharge pressure set points, which units run and how load is shared between them. Higher discharge builds pack and margin, but burns more fuel. The twin looks for set point combinations that meet every delivery pressure with the least fuel, inside MAOP and unit limits. Review your station constraints with our optimisation support team.
All values above are illustrative. The twin proposes set points; the controller accepts, adjusts or ignores them through normal SCADA commands. Nothing is written to the field without a person deciding.
A Twin Earns Trust One Pressure Point at a Time
Calibration compares modelled pressures with measured ones at every station and meter, then tunes friction and efficiency factors until the gaps are small and stable. A point that drifts away after calibration is useful information in its own right. It can mean a stuck transmitter, a valve not in the position SCADA reports, or liquids collecting in a low spot. Set a calibration routine for your system with our twin engineers.
Three What-Ifs Controllers Run Most Often
The value of a transient model shows up when something is about to change. The twin starts from the live system state and runs forward, so each scenario reflects today's pack and pressures, not a design case. These examples are illustrations of typical use, not results from a specific operator. Bring your own scenarios to our support team.
What Is Measured, What Is Modelled, What Needs a Field Check
A twin blends real readings with calculated values, and controllers need to know which is which on every screen. Between stations, almost everything is modelled. That is useful, but it is never proof. The twin labels each value by source so a modelled pressure is never mistaken for a reading. Walk through the labelling in a twin walkthrough.
Under 49 CFR 192.631(f), operators must include the control room in planning significant hydraulic or configuration changes. Twin look-aheads give that planning a shared, documented starting point. They do not replace your CRM procedures or the controller's authority.
Price Each Unit of Fuel Before Claiming a Saving
We do not quote a fuel saving percentage, because it depends on your system, your contracts and how far current set points are from optimal. What you can do is price fuel per unit, then apply whatever reduction your own pilot measures. Every line marked assumed is a placeholder for your own figure. Our fuel analysts can help swap in metered values.
Fuel retained under your tariff may belong to shippers rather than to you, so check who keeps the value before counting it. Lower fuel burn can also mean lower combustion emissions at the station.
Hydraulic Twin and Optimiser Arrive on a Ready-Built Server
iFactory delivers the pipeline twin as a turnkey bundle. A pre-configured NVIDIA AI server ships racked and ready with the hydraulic engine, optimiser and data connectors pre-loaded, and it sits inside your OT network next to SCADA. You rack it, plug in power and Ethernet, and the AI is live. To scope it for your system, request a turnkey quote.
- Pre-configured NVIDIA AI server, racked and ready
- Transient hydraulic model built from your pipe and GIS data
- Read-only SCADA and historian connection
- Gas quality and weather feeds wired in
- Compressor unit maps and fuel models per station
- Controller what-if console and plain-language chat
- 24×7 remote monitoring of model health and calibration
Server installed, SCADA tags mapped, pipe, elevation and unit data loaded into the model.
Model tuned against measured pressures and run beside the control room without changing operations.
Controllers trained, what-if console opened, set point suggestions switched on.
A Midstream Digital Twin That Works Beside Gas Control
iFactory adds a calibrated, always-running model to the tools your controllers already use. It reads from SCADA, keeps its own assumptions visible and leaves control decisions with people. Ask our support team how it would sit on your network.
What Gas Control Teams Ask About Pipeline Digital Twins
Know Where Pressure Will Be Before the Morning Peak
Start with one mainline system. Build the model, calibrate it against your own SCADA, run it in shadow and let controllers test it before any suggestion goes live.