AI Vehicle per Hour Throughput vs Target | iFactoryAi
By David Cook on July 3, 2026
Every automotive line is quoted, sized, staffed, and judged on one number: vehicles per hour. The OEM contracts for 60, the integrator designs the line to run a little faster than that to leave headroom, and from day one the whole plant is measured against whether it hits and holds the target. The problem is not usually knowing the number at the end of the shift — it is the six hours in between, where a string of two-minute micro-stops and a single station running slow quietly bleeds away vehicles nobody logged. By the time the shift total comes in under target, the causes have scrolled off the screen. Live throughput with root cause on every miss changes that, and an iFactory on-prem AI layer is where it runs.
iFactory · Automotive Throughput AI
Vehicles per Hour vs Target — Live, With Root Cause on Every Miss
Hitting the number once is luck. Holding it every hour is a system. AI tracks vehicles per hour against target in real time, and the moment the line dips, it names the station and the reason — while the shift can still be saved.
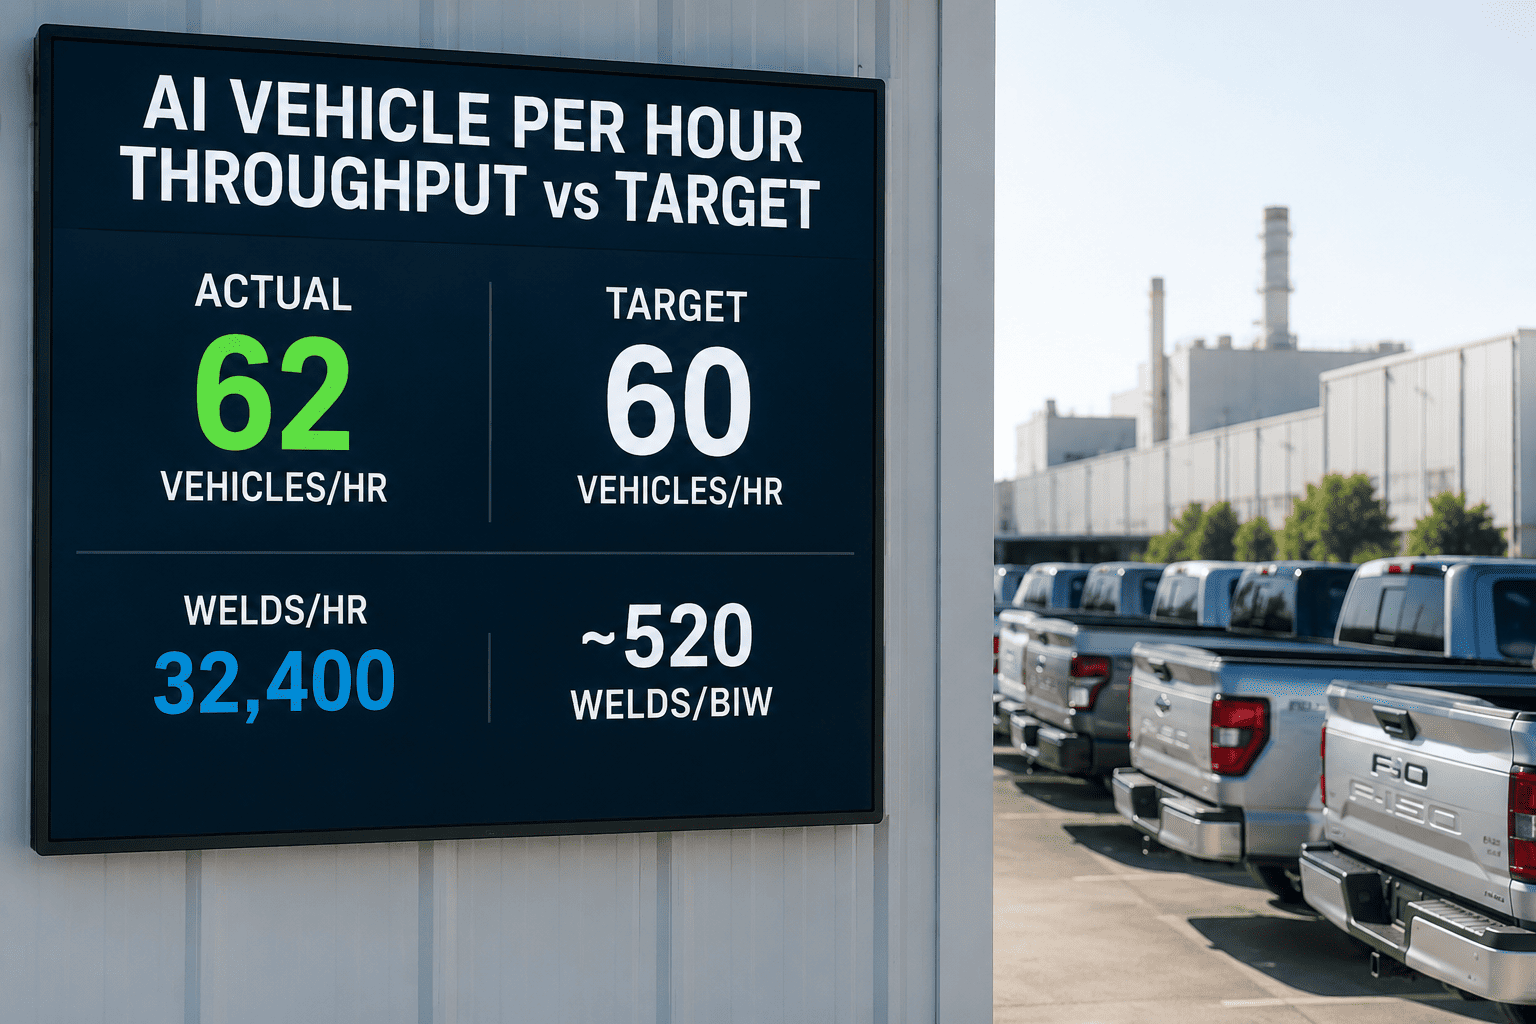
Vehicles per hour is the OEM's headline production target, and every design decision on the line traces back to it — robot count, conveyor speed, fixture cycle, buffer sizing, and staffing. Because real operation always carries losses, integrators design the line to a tighter cycle than the contract demands, banking headroom to absorb tool changes, rework loops, and micro-stops. That is why a healthy line shows 62 actual against a 60 target: the two-vehicle cushion is the margin being defended every hour. Lose it quietly and the shift falls short. The job of monitoring is to protect that cushion in real time, not to explain its absence after the fact.
62 actual
60 target
The gap between actual and target is the cushion. Two vehicles an hour of headroom is what absorbs the day's inevitable variation — and what a bad hour silently spends.
The Real Problem: The Shift You Cannot See Live
A line does not usually miss its target in one dramatic failure. It misses through accumulation — the hidden factory of small losses that no one logs. Most plants believe utilization sits at 75 to 85 percent; when it is actually measured, it is often 55 to 65. That twenty-point gap is machines idling, running below speed, and producing scrap, invisible because the events are too short and too frequent to write down. Walk one shift and watch where the vehicles go.
Throughput through one shift — vs the 60/hr target line
late start -3breakdown -10recovery +14
target 60/hr
This shift hit its total — but only by burning overtime to recover a breakdown it saw too late. The events are visible here; on the floor they scrolled past unlogged.
Want to see your own shift plotted as a live deviation curve against target? Talk to a throughput specialist and we will build it on one line's data.
Where the Vehicles Actually Go
When you measure the losses instead of guessing, they sort into a short list. On a real assembly facility studied at 89 percent of its purchased rate, the losses broke down cleanly — and starvation and blockage between stations, not any single machine, was the biggest drain. Each lost vehicle carried a real cost in labor, overhead, and forgone revenue.
Starvation & blockage7.8%
One station waiting for the last or blocked by the next — the handoffs, not the machines
Other losses1.9%
Maintenance events, late production starts, and assorted interruptions
Scrap1.3%
Defective units that consumed cycle time but never counted toward target
Purchased at one rate, running at 89% of it. Every point of that gap is vehicles — and each lost vehicle costs real labor, overhead, and revenue.
Root Cause on Every Miss — Not Just a Red Number
A dashboard that only shows you are below target is a smoke alarm with no address. The value is in the diagnosis: the instant vehicles per hour dips, the system names the station that caused it and the reason, indexed to the VIN, so a line manager acts on a cause instead of hunting for one. This is the difference between knowing the shift is behind and knowing exactly why — in time to run a countermeasure this hour, not to write it up next week.
Shift total comes in under target
becomes
Vehicles/hr tracked live against target
A red number with no explanation
becomes
The station and reason named on every dip
Micro-stops too small to log
becomes
Every stop captured, ranked, and totaled
Causes lost by end of shift
becomes
Each miss indexed to VIN for traceability
Correction planned for next week
becomes
Countermeasure run inside the same shift
Want the line to name the station and the reason the instant it dips below target? Book a demo and we will scope it to your VPH target.
Welds per Hour: The Leading Signal Behind the Number
Vehicles per hour is the outcome; the process signals underneath it move first. In the body shop, a line running 60 vehicles an hour at around 520 welds per body-in-white is laying down roughly 32,400 welds an hour. That weld rate is a leading indicator: when a weld gun starts slowing, mis-firing, or waiting, the welds-per-hour signal sags before a single vehicle falls off the count. Watching the process rate, not just the finished-unit rate, is how AI sees a throughput miss coming instead of reporting it after it lands.
~520
welds per BIW
× 60/hr
32,400
welds per hour
signals
62
vehicles per hour
The weld rate sags before the vehicle count does. Read the leading signal and you catch the miss while it is still preventable.
Why On-Prem AI for Throughput
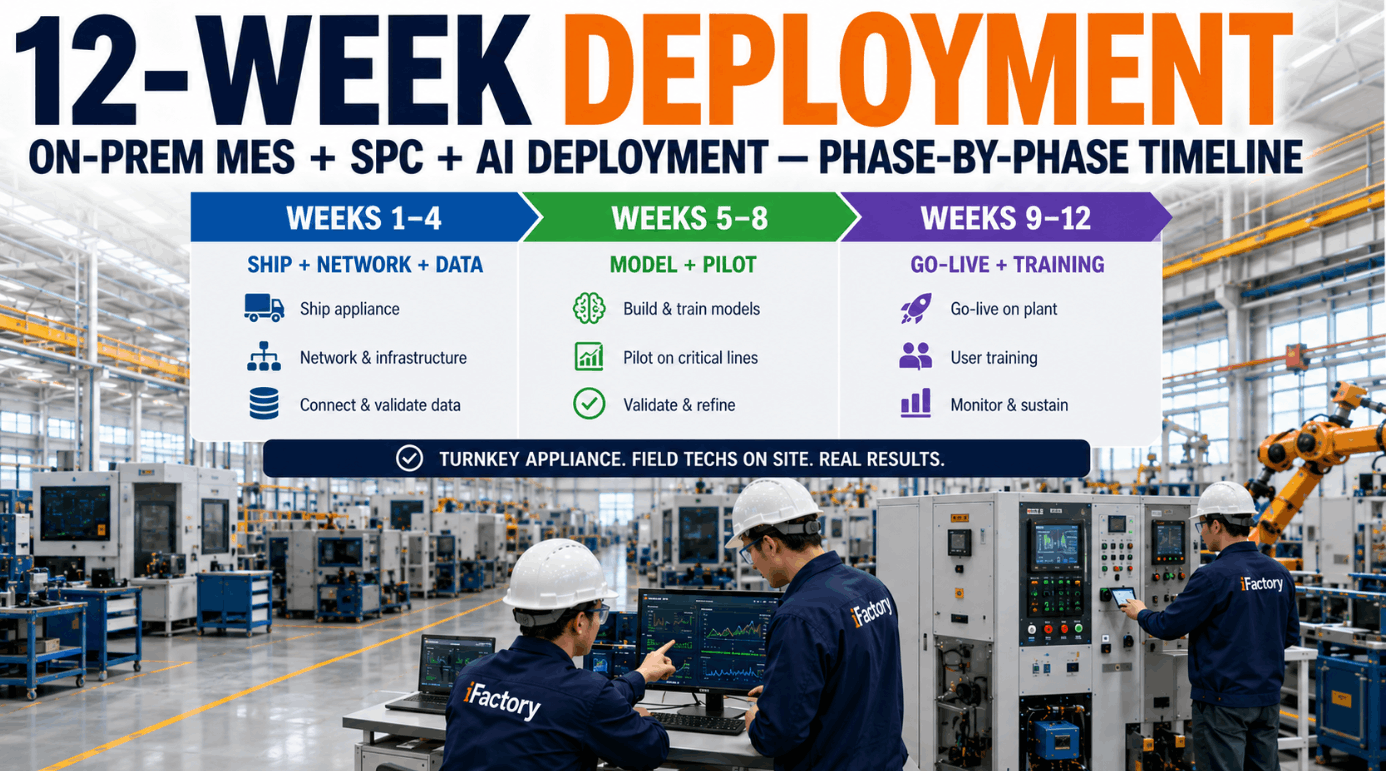
Throughput and process data is high-frequency and describes exactly how you build your vehicles. Running the AI on-premise keeps the loop fast enough to matter — intra-shift decisions need response now, not after a cloud round-trip — keeps sensitive production data inside the plant, and keeps the line's visibility alive even if the outside link drops. It trains on your line and runs in your network, and a typical deployment is live in six to twelve weeks.
Real-time
Intra-shift countermeasures need answers now. Local inference keeps target-tracking and alerts instant.
Private
Line rates and weld signatures are proprietary. On-prem keeps that production data inside your walls.
6-12 weeks
A turnkey deployment trained on your line and running in your network, live in a quarter or less.
Frequently Asked Questions
Why does a line run 62 when the target is 60?
Because integrators design to a tighter cycle than the contracted rate on purpose, banking headroom. Real operation always carries losses — tool changes, rework, micro-stops — so a line built to exactly 60 would fall short the moment any variation appeared. The extra two vehicles an hour are the cushion that absorbs the day's variation; running above target is how a line reliably holds target.
If we hit our shift total, why do we need live tracking?
Because hitting the total and holding the rate are different things. A shift can make its number while hiding a breakdown that was only recovered with expensive overtime — the events scroll past unlogged during the day. Live tracking against target lets a supervisor see the line trailing at the halfway point and reallocate resources in time, rather than discovering the shortfall when it is too late to fix cheaply.
What usually causes the biggest throughput losses?
Not the machines themselves, but the handoffs between them. On a studied assembly facility running at 89% of its purchased rate, starvation and blockage between stations was the single largest loss, ahead of scrap and maintenance. That is why cell-by-cell visibility matters: the constraint is often a station waiting or being blocked, which a plant-level number averages away.
How does welds-per-hour help predict vehicle throughput?
It is a leading indicator. A body shop making 60 vehicles an hour at roughly 520 welds each is running about 32,400 welds an hour. When a weld gun slows, mis-fires, or waits, that weld rate sags before any vehicle drops off the finished count. Watching the process signal rather than only the outcome lets the system flag a coming miss while it can still be prevented.
Why on-premise rather than cloud, and how long to deploy?
Three reasons: intra-shift decisions need real-time response a cloud round-trip cannot guarantee; line and weld data is proprietary process IP; and the line should keep its visibility even if the internet link drops. The AI trains on your line and runs inside your network. A typical turnkey deployment is live in six to twelve weeks.
Stop finding out you missed target after the shift ends.
See Vehicles per Hour vs Target, Live and Diagnosed
Bring one line. We will track vehicles per hour against your target in real time, read the welds-per-hour signal underneath it, and name the station and reason the instant the line dips — indexed to VIN, in time to run a countermeasure this shift. Turnkey on-prem AI: it trains on your line, runs in your network, and is live in six to twelve weeks.