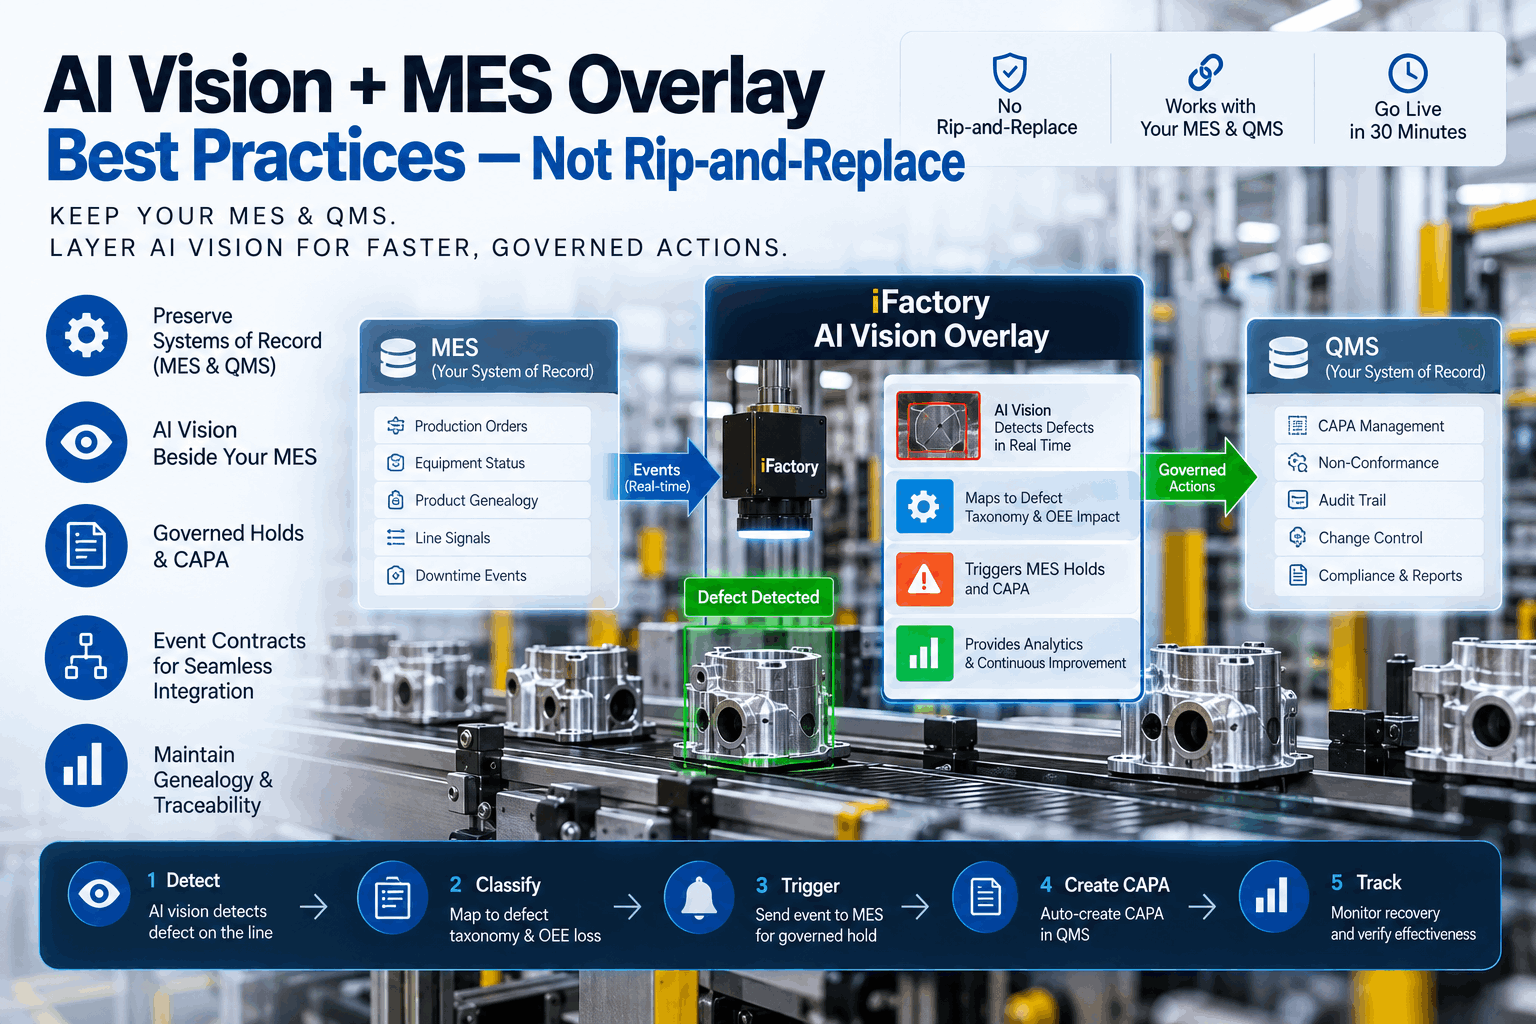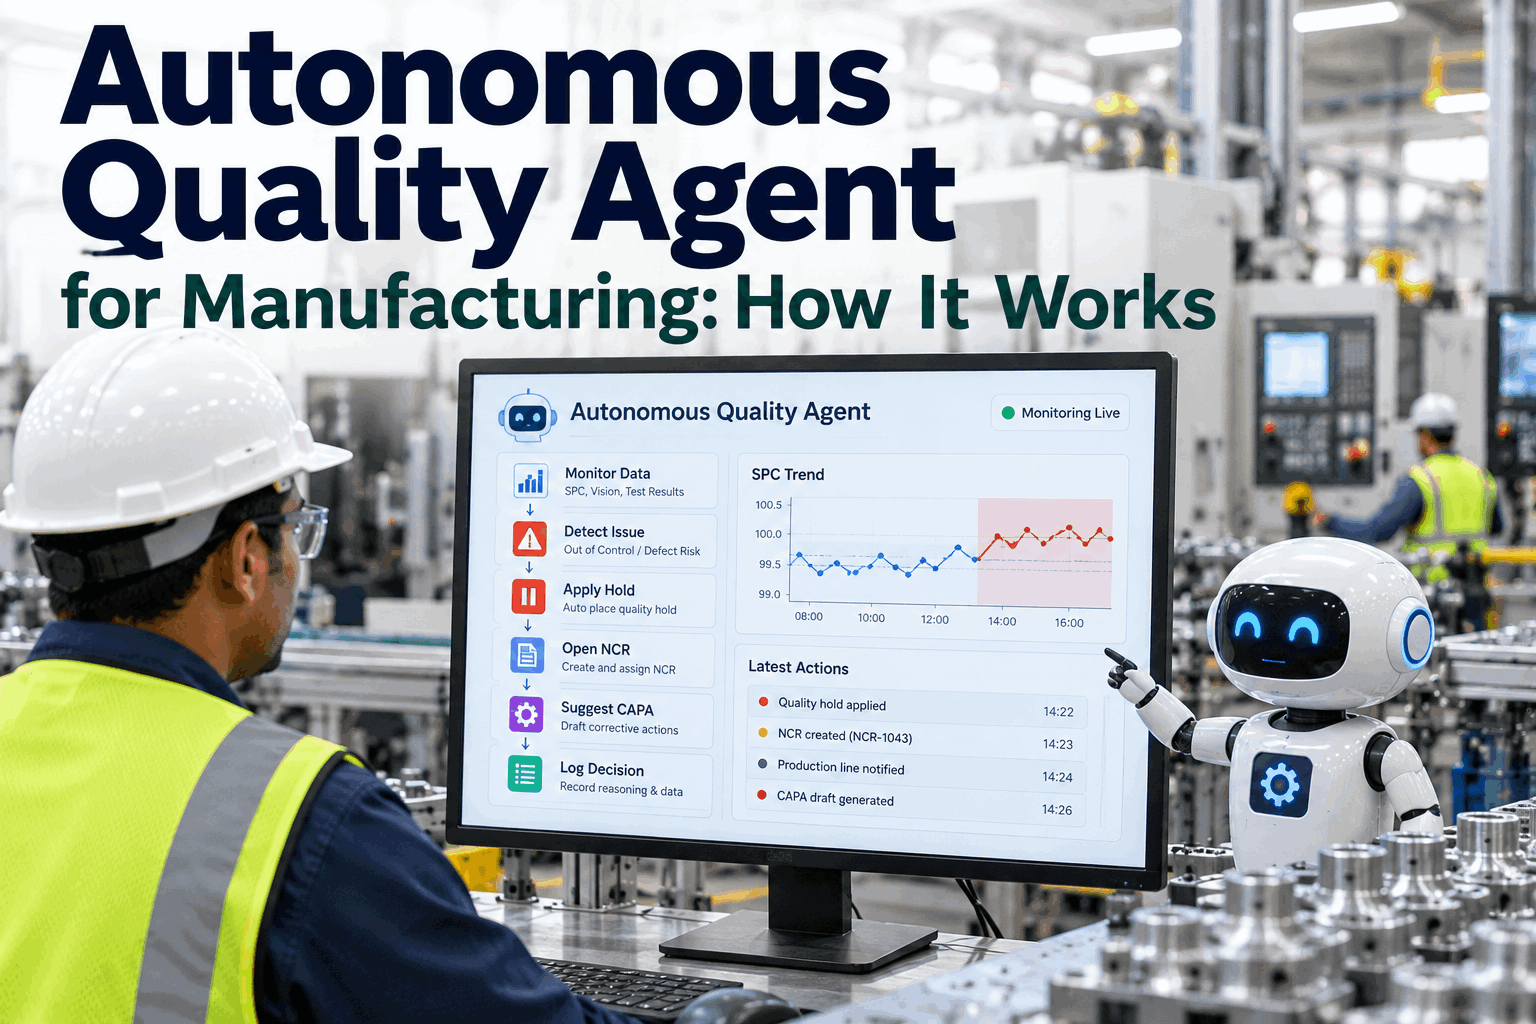
Most quality systems find a defect after the part has been made, measured and often packed. Predictive quality analytics turns that around. It reads the process signals that come before a defect, estimates the quality of each part while it is still being made, and warns the operator early enough to adjust the machine. See how that looks on a live line in a short predictive quality demo.
Know Which Parts Will Fail Before the Machine Makes Them
iFactory Predictive Quality Models score every part from live process signals. When risk rises, the operator hears a voice alert with the likely cause and a recommended setting change, while there is still time to act.
Three Moments a Defect Can Be Caught
Every defect has a history. A condition in the process starts to move, the part is formed under that condition, and only later does someone measure the result. Traditional inspection works at the end of that chain. SPC on finished measurements works a little earlier, but still after parts exist. Predictive quality works at the start, on the process conditions themselves, which is the only point where the operator can still save the part rather than sort it. To see where your current checks sit on this timeline, ask our quality team for a quick review.
Which Process Signals Predict Which Defects
Predictive quality works because most defects are physical consequences of conditions you already record. A falling cushion in moulding, a rising spindle load in machining or a slow change in oven temperature leaves a signature before the part goes out of tolerance. The matrix below gives typical examples. The warning horizon is how far ahead a model can usually see, and it depends on how quickly the defect develops. These are starting points to test on your own data, not guaranteed results. Our engineers can map your machines in a signal mapping session.
Score the Risk, or Predict the Measurement
Predictive quality models answer one of two questions. A classification model asks whether this part is likely to fail, and returns a risk score. A regression model predicts the measurement itself, such as a weight, a diameter or a coating thickness, with a confidence range around it. The second approach is often called virtual metrology. It began in semiconductor fabs, where models estimate wafer properties such as deposited layer thickness from equipment and sensor data to avoid measuring every wafer. Many plants use both: regression where a clear measurement exists, and classification for defects that are only judged pass or fail. Ask our support team which fits your defect types.
- Output: probability that the part is defective, from 0 to 1
- Best for visual or pass/fail defects such as flash, porosity or leakers
- Needs labelled history of good and bad parts
- Alert when the score crosses a threshold you agree with quality
- Output: predicted value with a range, such as 41.74 g ± 0.05 g
- Best for measured features such as weight, diameter or thickness
- Needs measurement results linked to the process data of each part
- Alert when the predicted value heads toward a spec limit
A Short Shot Caught Before It Happened
Here is a typical sequence on an injection moulding press making a cover housing with a weight spec of 42.0 g ± 0.4 g. The values are illustrative, but the pattern is common. Cushion falls slowly after a new resin lot is loaded, which can mean the check ring is letting material flow back. The model sees the cushion trend and the predicted part weight moving toward the lower limit long before a short shot appears. If you want to try this on one of your own presses, start with a pilot planning call.
At shot 18,442 the operator heard the alert, added 1 mm to the dosing stroke as recommended, and confirmed it on the HMI. Cushion recovered within a few shots. The system raised a maintenance request to inspect the check ring at the next mould change. No short shots reached the box, and quality still checked the next sample as planned.
Alerts the Operator Can Act On in Seconds
A warning only helps if someone hears it and knows what to do. iFactory speaks the alert at the machine, names the driver and suggests a setting change. The operator can ask follow-up questions out loud and confirm the action, and every step is logged.
The Slow Causes Behind Sudden Scrap
Scrap often seems to appear suddenly, but the cause usually built up over hours or days. Settings stay the same while the conditions around them change, so the same recipe makes a different part. These six sources of drift explain a large share of quality problems on most lines. A predictive model watches them together, which is hard for a person to do across many machines and shifts. Talk to our engineers about which ones matter most on your lines.
A One-Page Canvas for Each Use Case
The most common reason predictive quality pilots fail is a vague goal, such as "use AI to reduce scrap." A good use case names one defect on one process, the signal that predicts it, how much warning is needed and who acts on the alert. Fill in these eight boxes before any model is trained. If you cannot fill one in, that gap is the first thing to fix. We can complete the canvas with you in a use case workshop.
How to Tell if a Model Is Good Enough for the Floor
Accuracy on its own is a misleading number. If only 4% of parts are defective, a model that always says "good" is 96% accurate and useless. Look at two numbers instead. Recall is the share of real defects the model catches. Precision is the share of alerts that turn out to be real. Operators lose trust quickly if most alerts are false, so the threshold is a trade-off you set with quality and production together. In the example below, from 1,000 parts with 40 real defects, the model catches 34 and raises 16 false alarms. Our quality team can help you set thresholds for your lines.
The Data a Predictive Quality Model Needs
The hard part of predictive quality is rarely the algorithm. It is linking each quality result to the exact process conditions under which that part was made. Without that link, the model has nothing reliable to learn from. Most plants already collect the right data, but with timestamps that don't line up, part IDs missing or results kept on paper. Fixing that link is the first step of every deployment. Book a data readiness review to see what your lines already have.
What Works, and What Usually Goes Wrong
Plants that get value from predictive quality tend to follow the same few habits. They start narrow, involve operators early and treat the model as a process tool that needs care, not a one-time project. Plants that struggle usually try to predict everything at once or never agree on who acts on an alert. If you want a second opinion on your plan, our support team is happy to review it.
- Start with one costly defect on one process
- Link every quality result to its process data first
- Agree the alert threshold with quality and production together
- Give each alert a recommended action and an owner
- Check model performance every week and retrain when the process changes
- Keep sampling inspection running while trust builds
- Trying to predict every defect on day one
- Training on data where quality results can't be traced to the part
- Judging the model on accuracy alone
- Alerts sent to a dashboard nobody watches
- Ignoring material lot and maintenance events as inputs
- Turning off inspection too early
Models, Voice Alerts and AI Server in One Package
iFactory delivers Predictive Quality Models as a turnkey bundle. A pre-configured NVIDIA AI server ships racked and ready with the models, PLC connectors and voice alerting pre-loaded, so process data stays on site and scoring runs in real time. You rack it, plug in power and Ethernet, and the AI is live. To scope it for your lines, request a turnkey quote.
- Pre-configured NVIDIA AI edge server, racked and ready
- PLC, historian and quality system connectors
- Per-part data linking for process and quality results
- Predictive models trained on your own history
- Voice alerts and HMI prompts at each machine
- Operator, technician and quality engineer training
- 24×7 remote monitoring of models and hardware
Server installed, machines connected, quality results linked to each part's process data.
Models trained on your history and run silently, with predictions checked against real results.
Voice alerts switched on, thresholds agreed, operators trained and scrap baseline recorded.
Predictive Quality Built for the Plant Floor
iFactory's Predictive Quality Models are designed for the people who have to act on them: operators at the machine, technicians on the line and quality engineers who own the spec. Our support team can walk you through a pilot plan.
What Plant Managers Ask About Predictive Quality Analytics
Make Good Parts Instead of Sorting Bad Ones
Connect your machines, link your quality results and let iFactory warn operators while there is still time to adjust. The full system is delivered turnkey and goes live in 6 to 12 weeks.