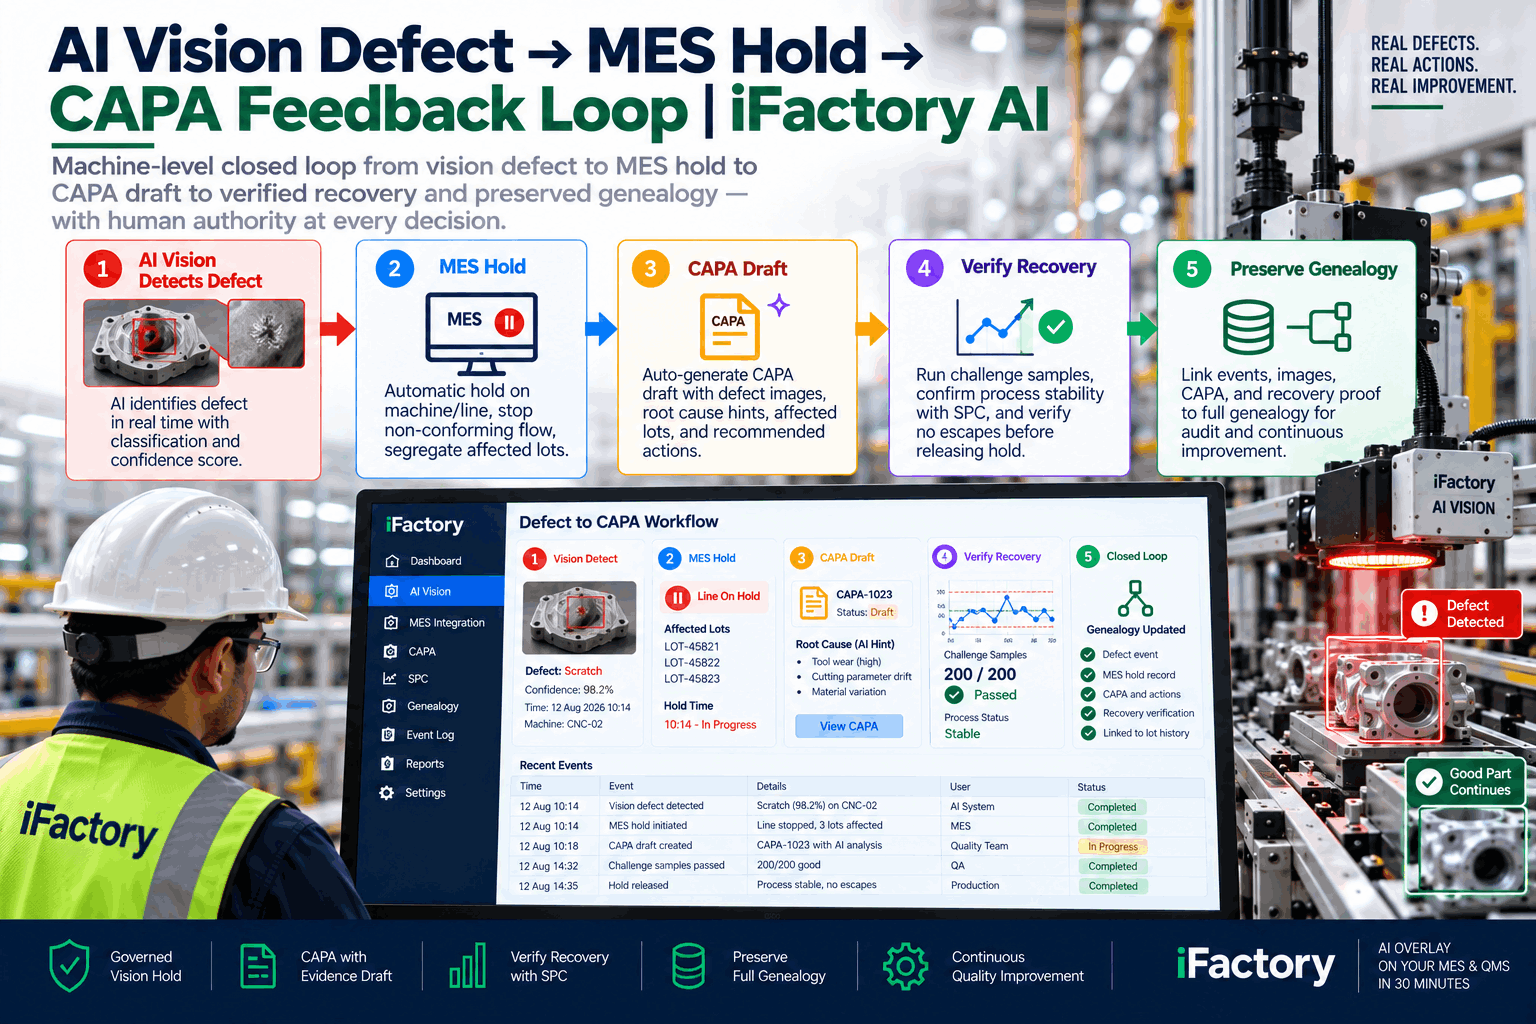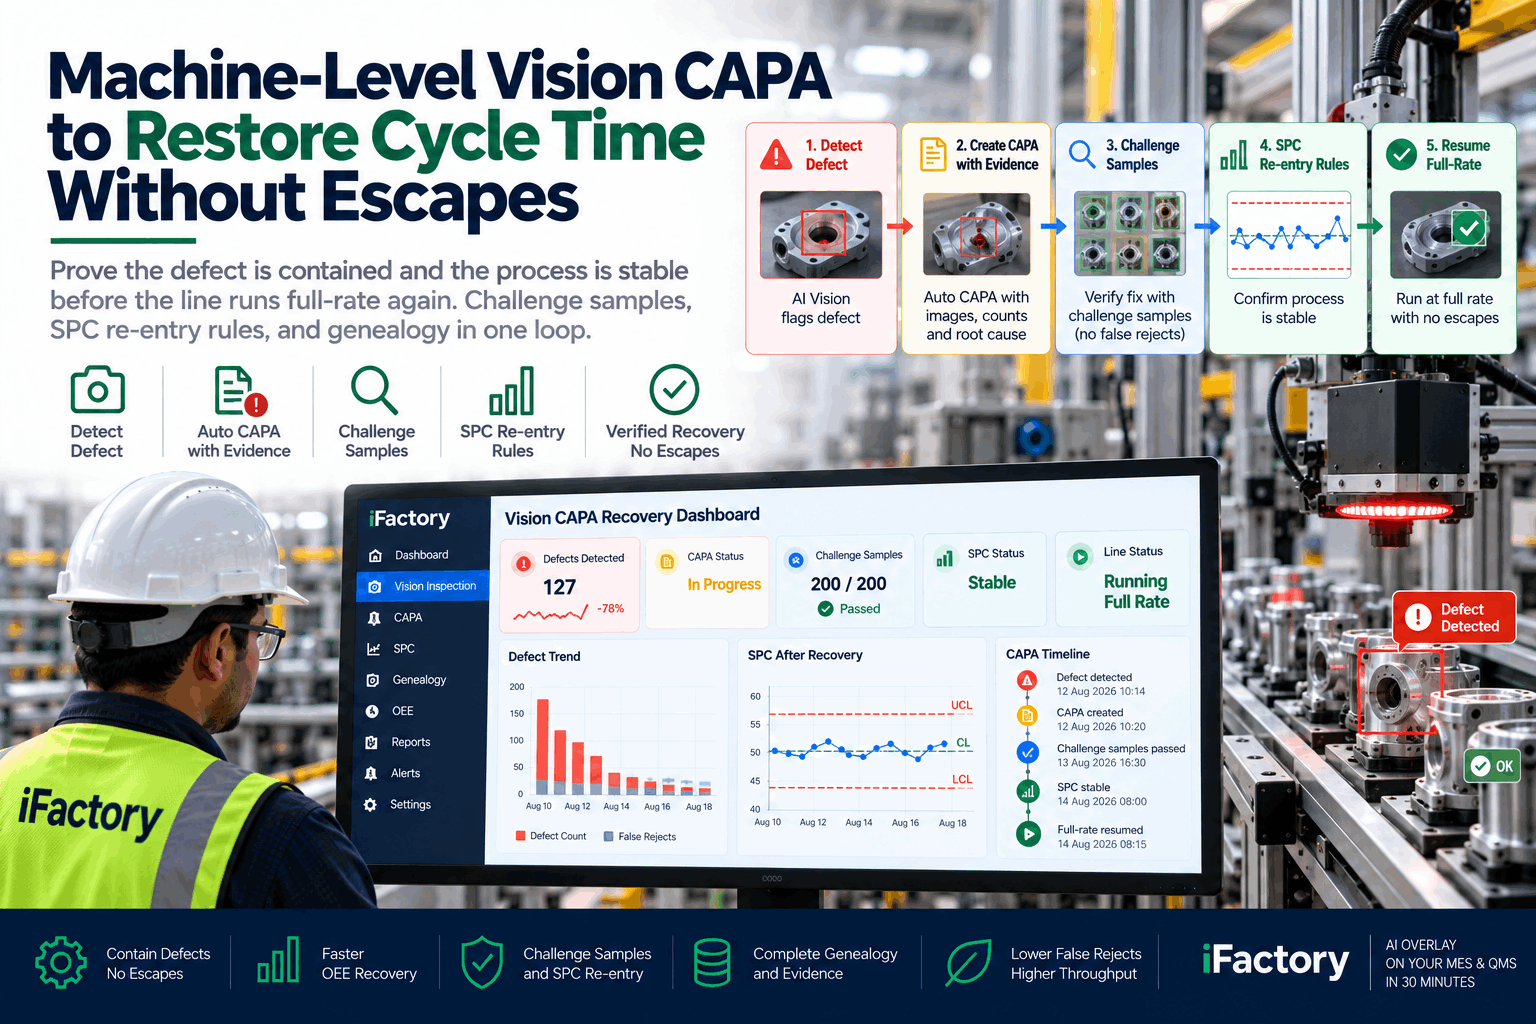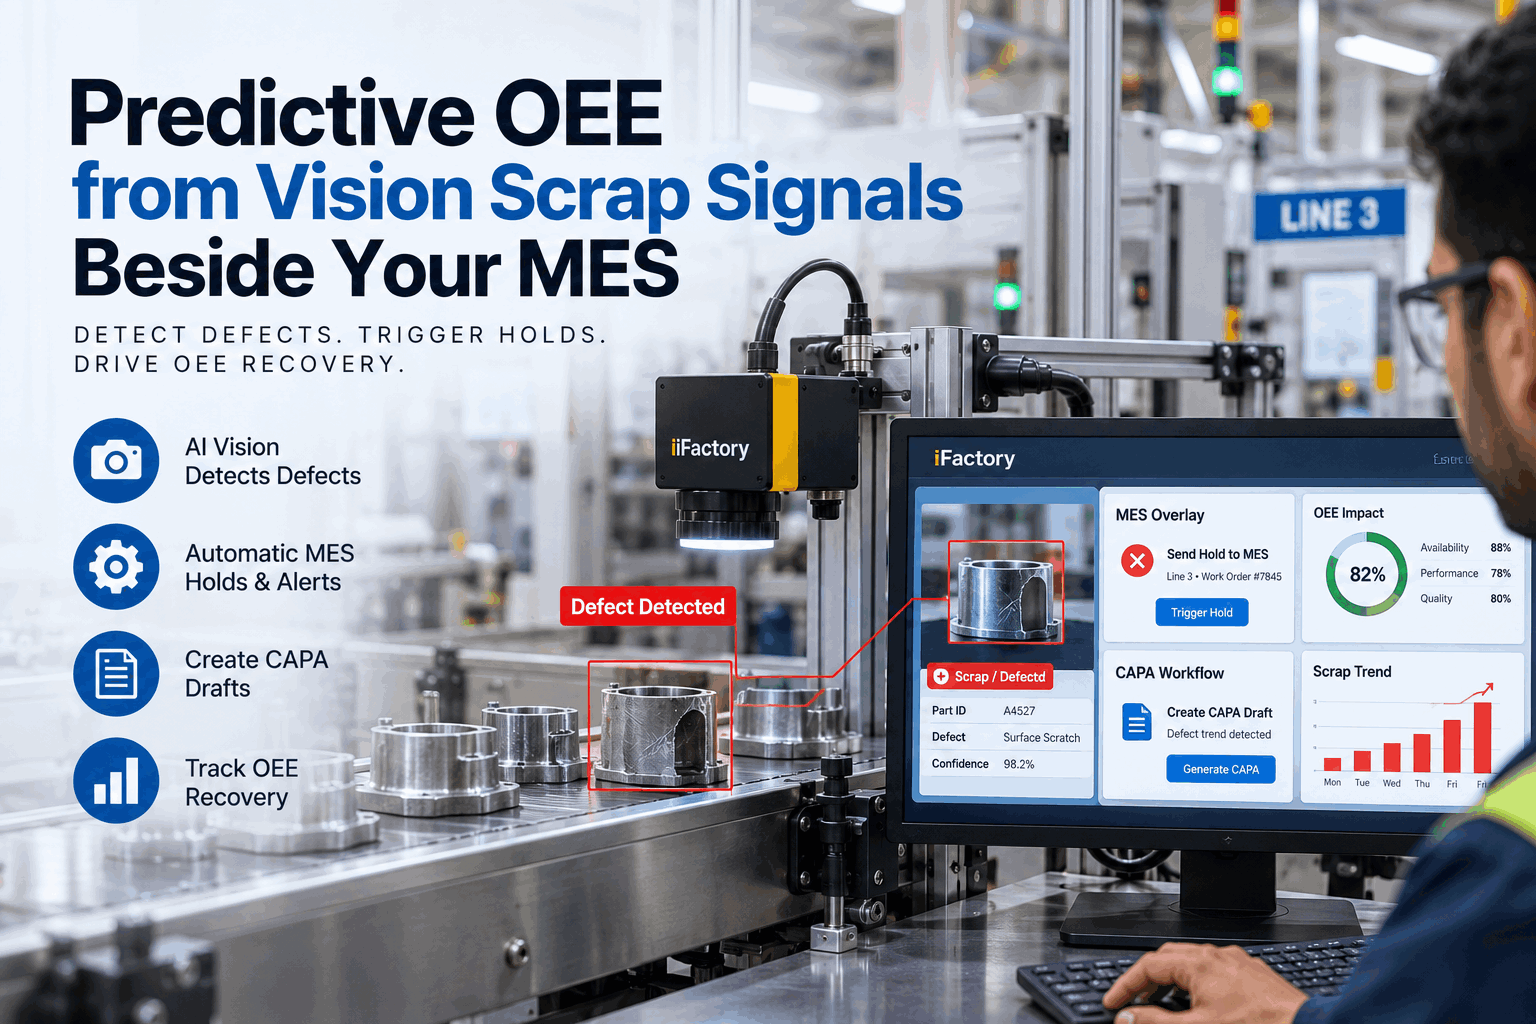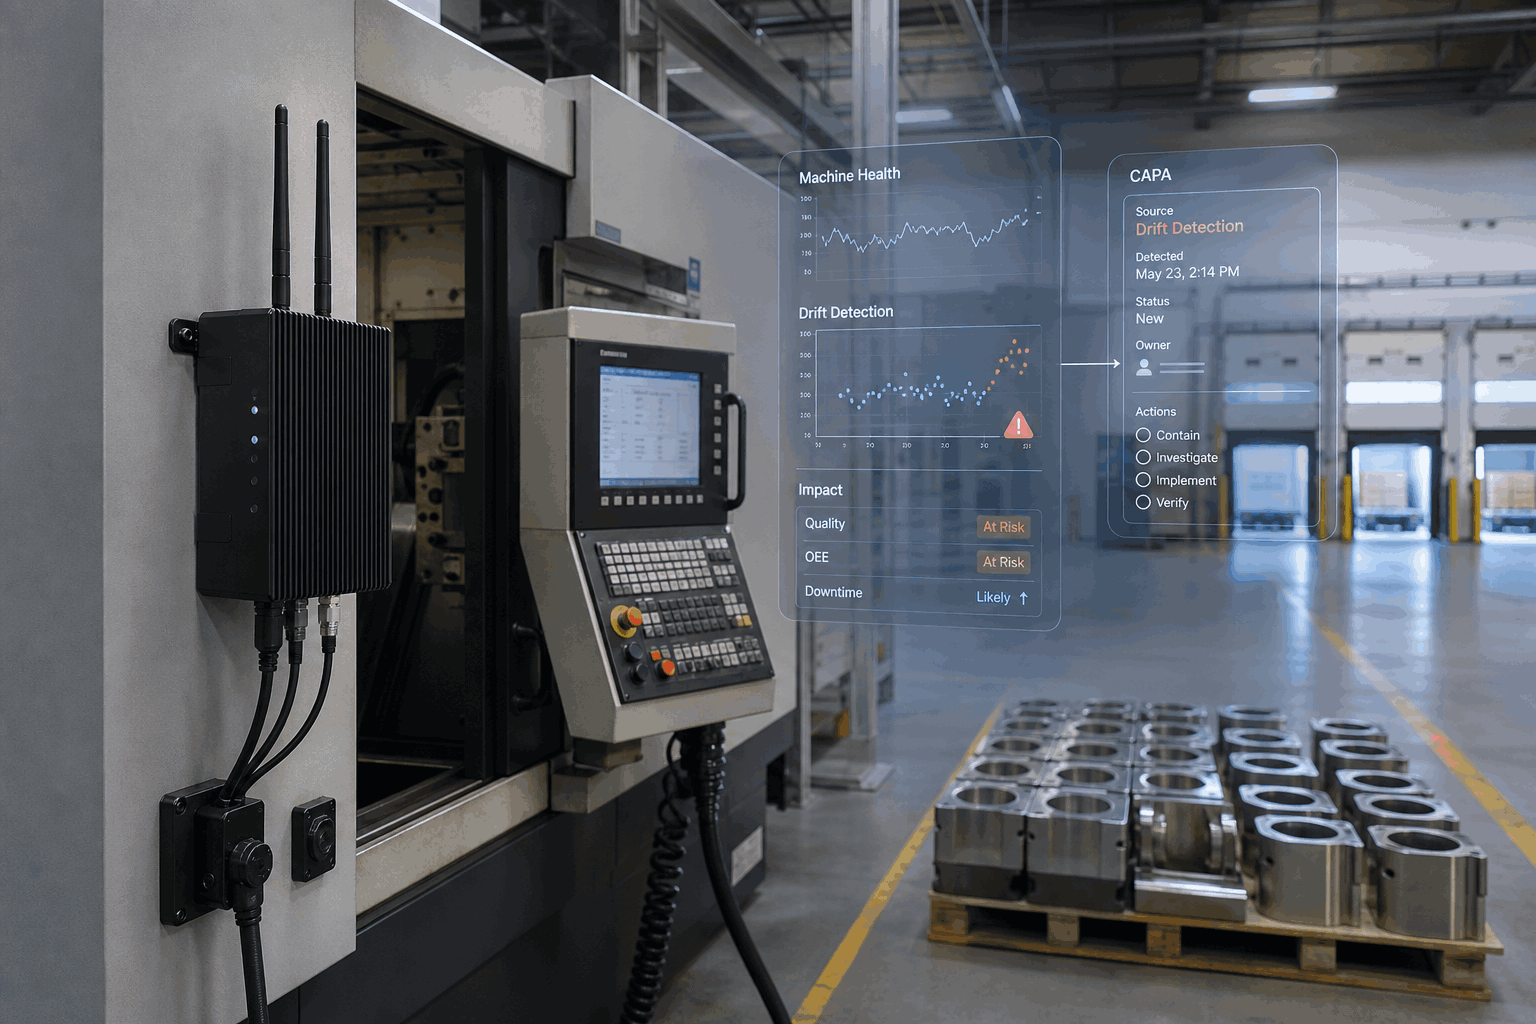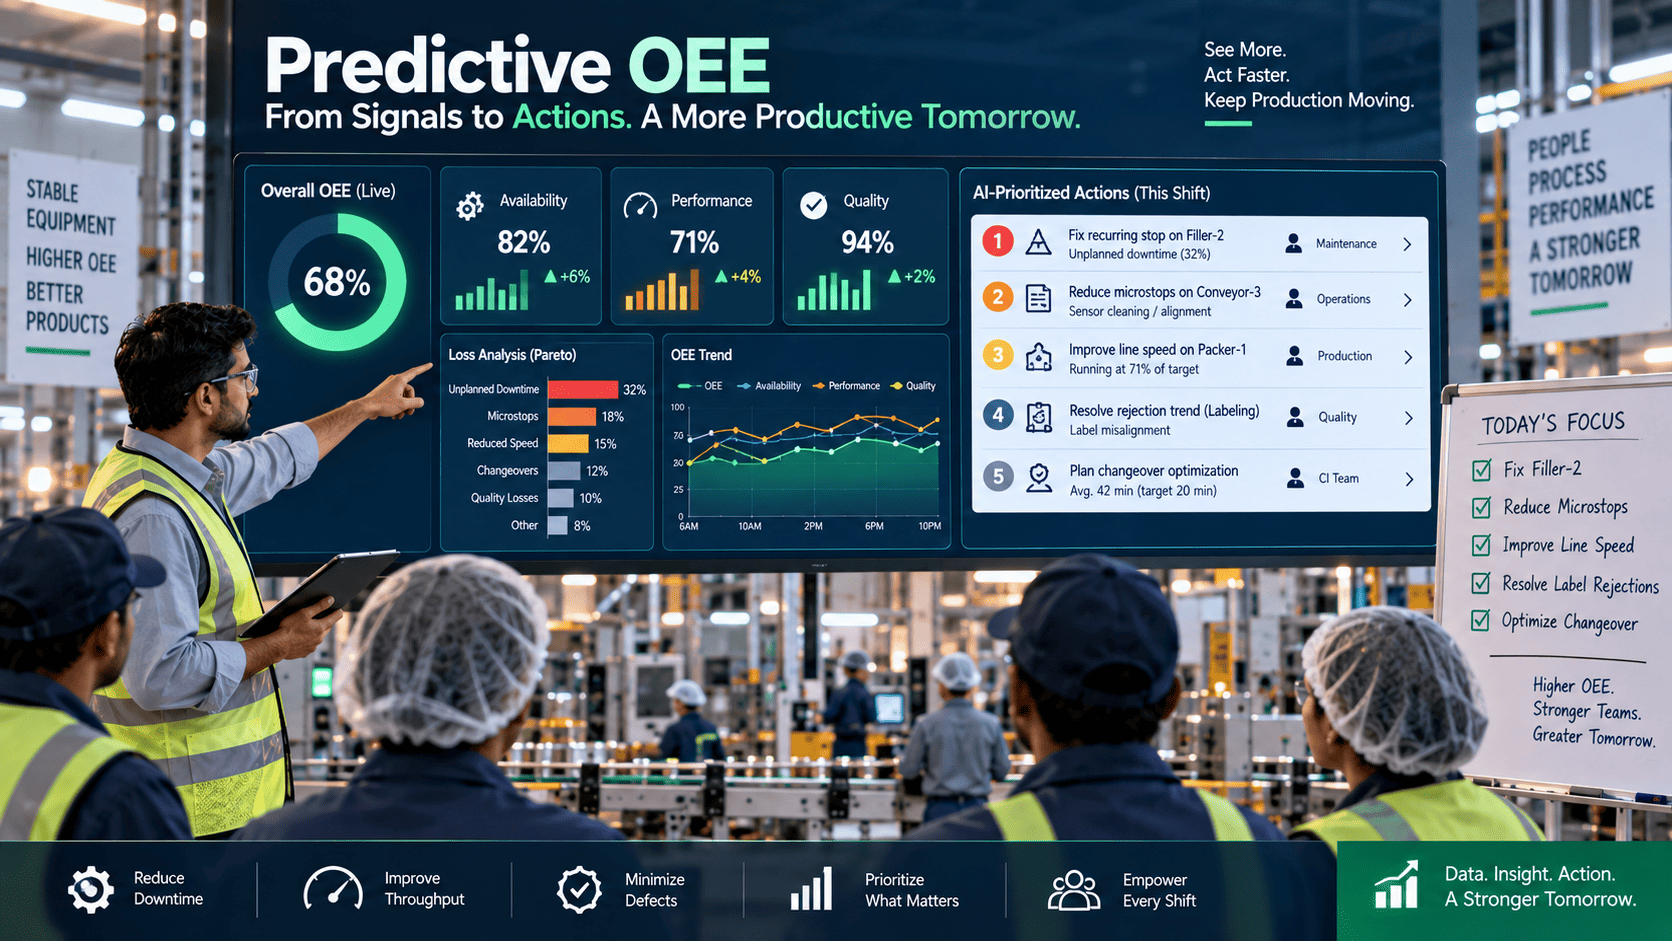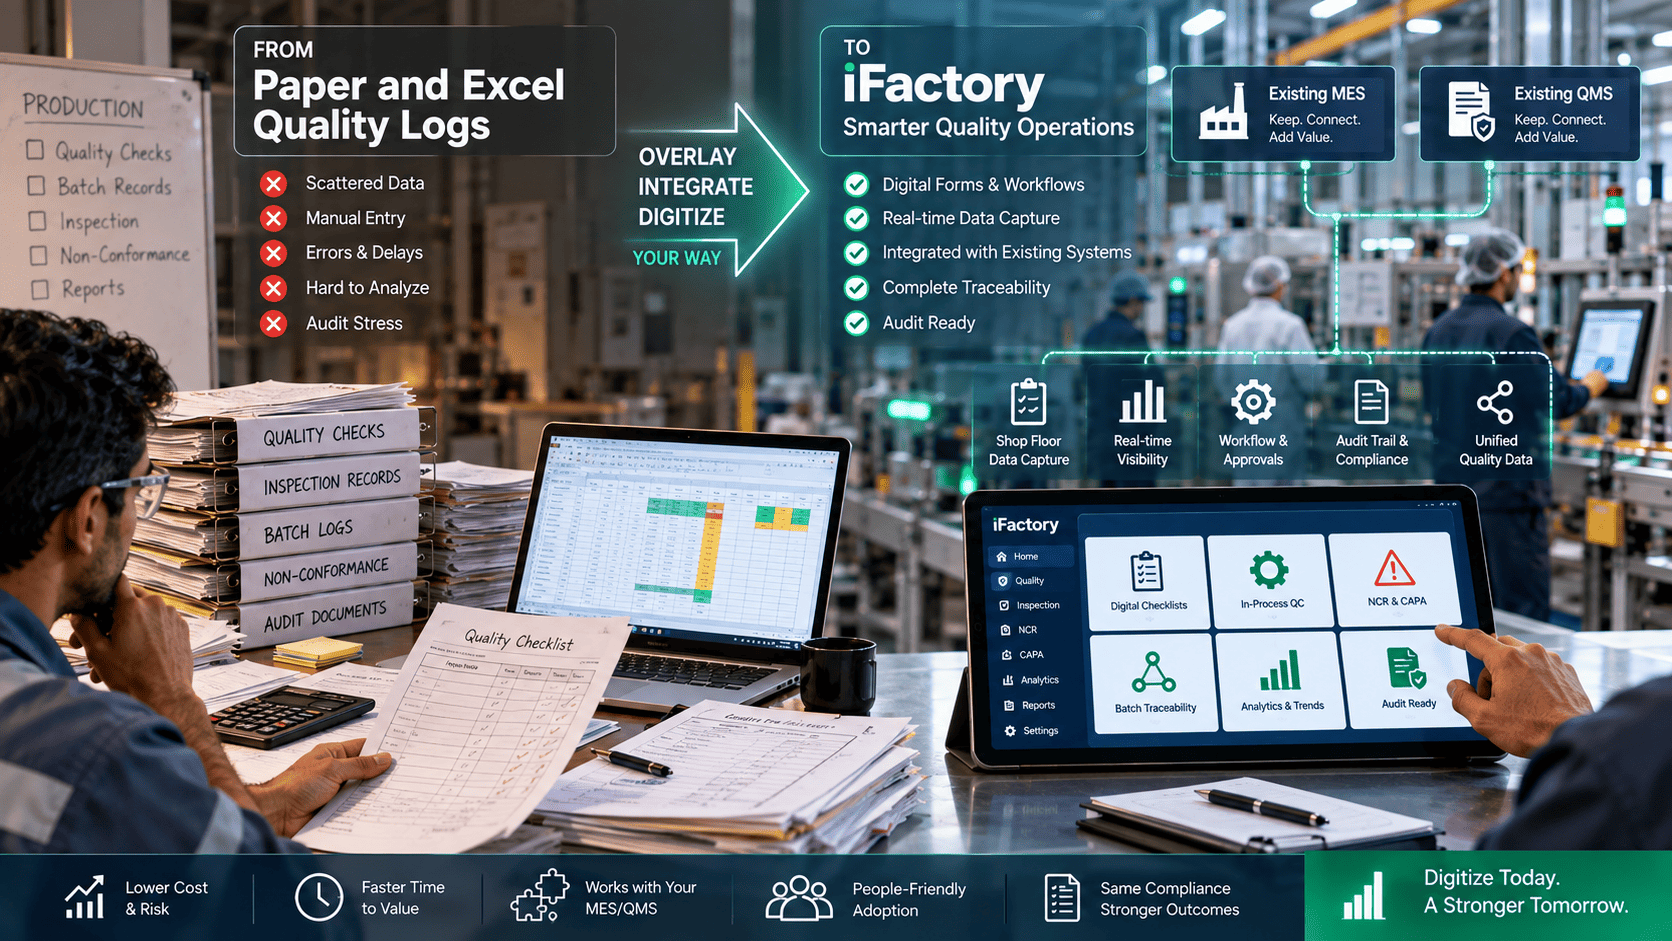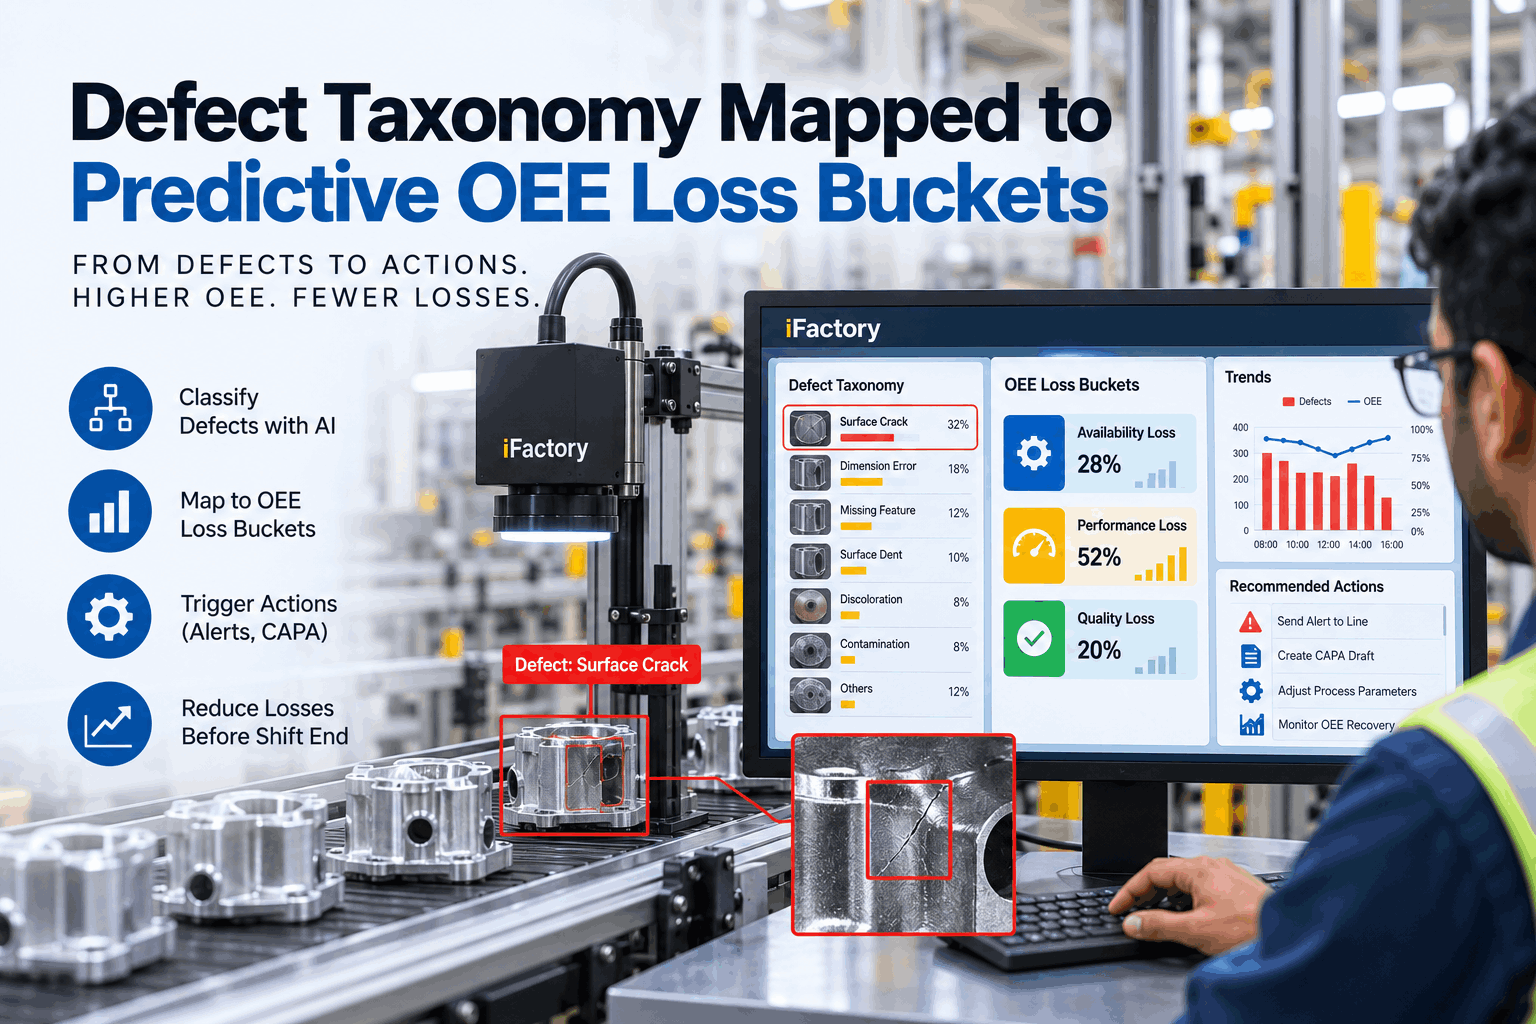
A false-reject storm can look like a quality nuisance until it starts starving the line, triggering quarantine lag, and quietly dragging OEE down across all three buckets. The real problem is not the defect count — it is that the team never mapped those defect classes to the right operational loss mode. Defect taxonomy tied to predictive OEE loss buckets is how quality and operations turn vision and SPC signals into schedulable action before a small defect pattern becomes scrap, rework, downtime, or a full containment event. iFactory AI overlays the classification, hold, CAPA, and genealogy workflow beside your existing MES and QMS so the same defect label carries the correct operational meaning. See how classes map to loss buckets in a 30-minute session.
Turn defect classes into schedulable action across availability, performance, and quality — before the shift ends.
At a Glance
Why Defect Taxonomy Has to Map to OEE Buckets
A defect label by itself is not operationally useful. Scratch, misalignment, seal anomaly, or out-of-spec dimension only becomes actionable when the team knows what it does to the line. A useful taxonomy should tell you more than what failed — it should tell you where the defect appeared, how severe it is, whether it is repeating, whether it is isolated or spreading through genealogy, and whether it threatens quality, performance, or availability.
In practice, the same defect can move across buckets over time. A dimensional drift may start as a quality issue. If it forces extra checks, manual rework, or repeated parameter tweaks, it becomes a performance loss. If containment rules or stop-the-line policies kick in, it becomes an availability loss. That is why predictive OEE is not just about counting defects — it is about classifying the likely loss path early enough to act on it.
Availability, Performance, Quality — Where Defects Actually Land
One of the most common mistakes is treating every defect as a pure quality loss. That framing is too narrow. A modern defect taxonomy should classify each family by likely loss path so the response can be scheduled accurately.
- Scrap and yield loss
- Rework material
- False rejects
- Out-of-spec output
- Customer-facing risk
- Slower cycle rate
- More inspection time
- Recheck loops
- Minor stops and micro-stops
- Manual sorting, repeated adjustments
- Quarantine holds
- Line stops for containment
- Extended changeover
- Downstream blocking
- Reinspection queues
A cosmetic defect is often first seen as quality loss. A defect cluster that forces extra verification can reduce throughput without becoming scrap. And when defect patterns cross a threshold, the issue becomes a stop event that hits availability directly.
How Vision and SPC Defects Become Predictive OEE Actions
Most plants already have the raw ingredients — AI vision results, SPC charts, operator notes, inspection records, downtime logs, and genealogy data. The issue is that these signals often live in separate workflows. A predictive OEE system needs to translate those signals into a decision path where each severity level triggers a proportional response.
A single anomaly triggers monitoring, not immediate action. The team is aware, but the process continues while evidence accumulates.
Multiple signals in the same defect family move the station or SKU onto an active watchlist with heightened inspection cadence.
The defect pattern is now stable enough to warrant scoped containment. Genealogy defines what is affected, not a plant-wide freeze.
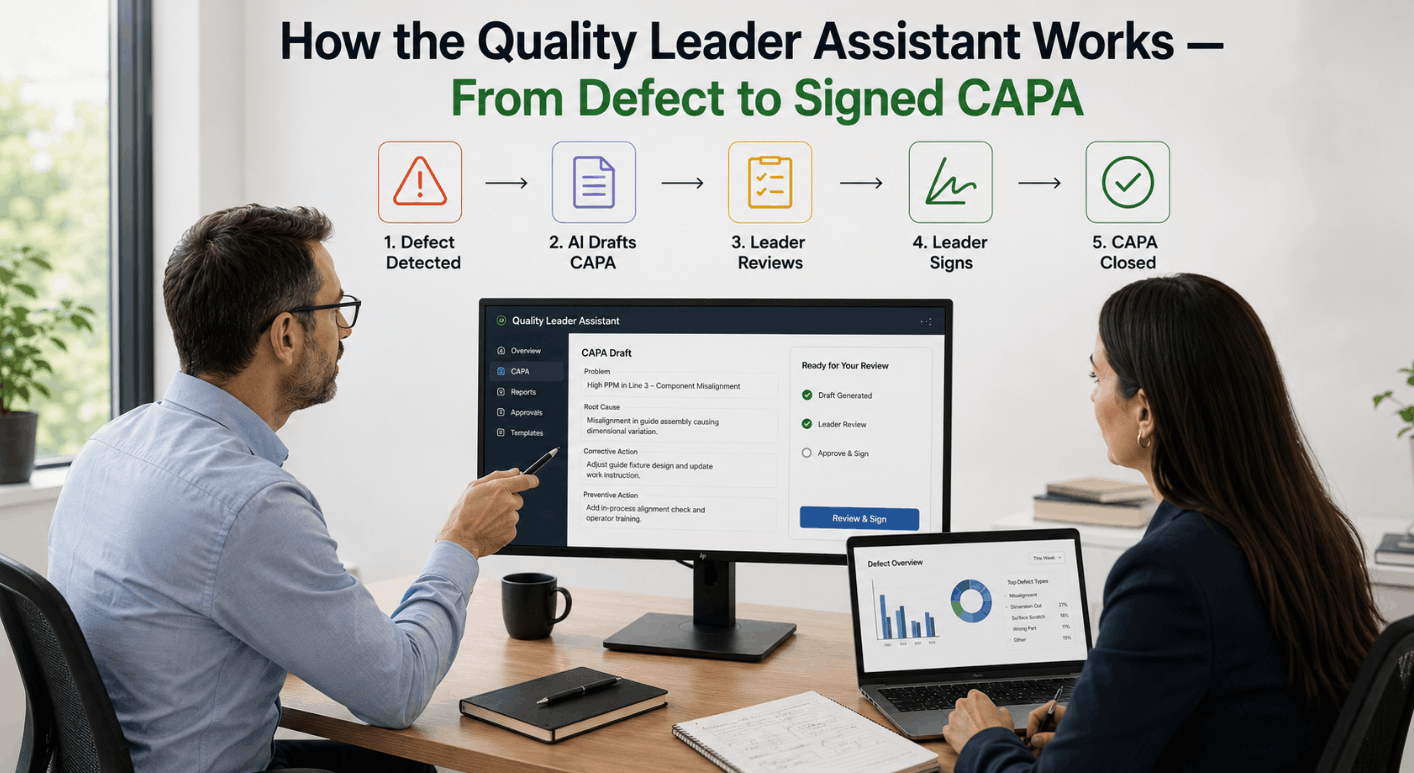
Affected units and lots move to hold. Downstream use is blocked. Human approval is required for any release decision.
Evidence, defect codes, genealogy links, and prior similar events pre-populate the record so quality is not writing from memory.
Recurrence checks confirm the action worked. Genealogy shows whether the issue was isolated or systemic before release.
Walk through how iFactory AI maps your defect taxonomy into predictive OEE actions — with hold, CAPA, and genealogy in one governed loop.
SPC Matters, But Only If It Drives Action
SPC charts are valuable because they show instability before the defect becomes obvious on the floor. X-bar and R charts reveal process drift in variable data. Attribute charts (p, np, c, u) help spot defect counts and rates. Western Electric or Nelson-style rule violations warn that the process is no longer behaving normally. But charts alone do not recover OEE.
- Should the lot be quarantined?
- Should the machine be held?
- Should a supervisor approve release?
- Should maintenance inspect the tool?
- Should quality draft CAPA evidence now?
If the answer stays inside a dashboard, the signal is late. If it reaches hold logic and genealogy, it becomes predictive. That is the difference between reporting and control.
How iFactory AI Fits Beside Your MES and QMS
iFactory AI is not designed to replace MES, QMS, historian, or SPC systems. It overlays them with the classification and action layer quality teams need to move from label to loss bucket to controlled response.
Normalize defect labels across shifts, sites, and stations so the same class always maps to the same loss path.
Send each severity level to the correct response — warning, watchlist, containment, hold — instead of one blanket rule.
Scope holds by genealogy so quarantine matches the actual affected inventory, not the whole plant.
Confirm recovery across quality, performance, and availability — not just defect count.
Frequently Asked Questions
A defect taxonomy is a consistent set of labels and severity levels applied to inspection results, tied to the operational loss path each class is most likely to create.
Yes. A dimensional drift may begin as quality loss, become performance loss when extra checks slow the line, and turn into availability loss if containment rules pause the process.
Vision detects the visible defect. SPC shows whether the process was drifting before the defect appeared. Together they turn one alarm into a defensible pattern.
No. iFactory AI overlays the existing MES and QMS. The systems of record stay in place while the classification and response layer becomes faster and more consistent.
Release always requires human approval. The overlay records who approved, why, and what evidence supported the decision.
A modern taxonomy turns each defect class into a schedulable action across availability, performance, and quality — not just another row in the scrap report.