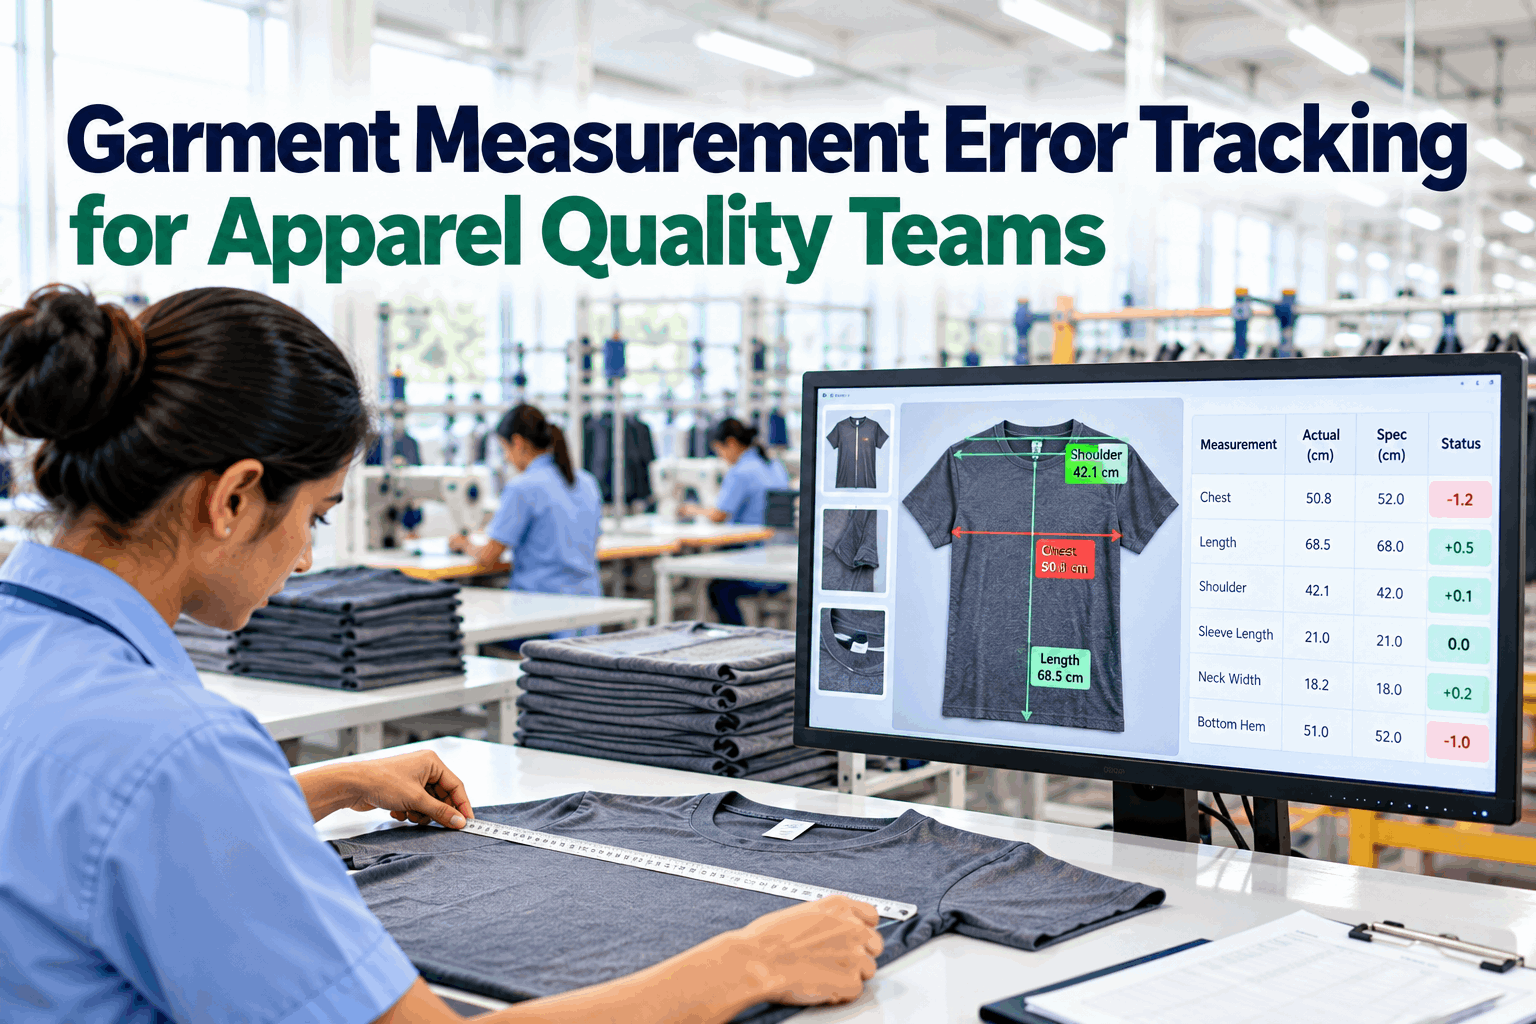
Fit is the first thing a customer notices and the most common reason fashion comes back. Behind every fit complaint is a measurement that drifted: a chest width cut a little generous, a body length that shrank in washing, a sleeve that grew as a knit seam stretched. Most factories measure garments against the spec, but they record results on paper, check a small sample and look at each measurement once. The drift that builds across bundles goes unseen until a lot fails. This article explains how tolerances work, where measurement errors come from and how tracking every point of measure over time catches problems before they reach the customer. For a look at live measurement tracking, book a short walkthrough.
Garment Measurement Error Tracking: Catch Fit Drift Before a Lot Fails
Every point of measure recorded, compared with spec and trended by style, size and line, so fit problems are fixed while the order is still running.
How Small Measurement Errors Become Fit Returns
A garment spec sheet lists points of measure, or POMs, such as chest width, body length and sleeve length, each with a target value per size and a tolerance. A garment passes if every POM is inside tolerance. On paper this is clear. In the factory, two things undermine it.
First, sampling. Measurement is slow, so only a few garments per size are measured, often at the start of an order and at final audit. A drift that starts halfway through the order can pass through between checks. Second, isolation. Each measurement sheet is looked at once and filed. Nobody plots chest width across the last ten bundles to see it creeping toward the upper limit. By the time a garment falls outside tolerance, many others sit just inside it, and the whole lot fits slightly large.
Customers notice. A 2025 survey of UK shoppers reported by Just Style found that around 30% of fashion bought online is returned, and poor fit was named as the main reason. Not every fit return is a factory measurement error, but consistent measurements are the part the factory controls.
Tracking every POM over time turns measurement from a pass-fail check into an early warning. We can look at your current spec sheets together on a call.
How Measurement Tolerances Work
Tolerances are not arbitrary. A good tolerance reflects how much a measurement can vary without changing fit, and it must stay small enough that neighbouring sizes never overlap.
Illustrative values. A wider tolerance would let a large at its lower limit measure the same as a medium at its upper limit.
Tolerances set this way can be checked automatically for every size in a spec. Our specialists review tolerance sets as part of style set-up.
Where Measurement Errors Come From
When a POM drifts, the cause is usually one of a few sources. Knowing them helps decide who should act.
Worn blades, loose lays or marker errors produce panels that are slightly too big or small.
Seams sewn wider or narrower than spec change every measurement that crosses them.
Fabric that shrinks in washing or stretches in sewing shifts lengths and widths.
Garment washes, tumble drying and pressing can all change final measurements.
Different people measuring the same garment differently, or garments measured while stretched.
A grading mistake shows up as one size consistently out while others are fine.
The pattern of the drift points to the source. If one POM drifts on all sizes, look at cutting or sewing. If one size is out on several POMs, look at grading. If lengths shrink after washing, look at fabric and wash recipes.
Washed styles need special care. A garment wash can move lengths and widths by more than the whole tolerance, so measurements before and after washing should be recorded separately. Comparing the two shows how much each POM moves in the wash, and that figure can be fed back to the pattern room as a wash allowance for the next order. Without it, the factory keeps correcting the same shrinkage by hand, order after order.
Seeing those patterns needs measurements recorded by style, size, POM, line and stage. That structure is what a tracking system adds to a tape measure.
Tape Measures Versus Digital Measurement
The tape measure is not going away, but how measurements are captured and used changes a great deal when they go digital.
- A few garments per size measured
- Values written on a sheet
- Different checkers, different technique
- Each sheet reviewed once
- Drift seen only when a POM fails
- Hard to link to line or bundle
- More garments measured, faster
- Values captured straight into the system
- Guided method with photos of each POM
- Every value trended by style and size
- Drift flagged before a POM fails
- Every value tied to line, bundle and stage
Digital capture can start with connected tape measures or tablets that guide the checker through each POM. Camera-based measurement adds speed on flat-laid garments, measuring many POMs from one image. Both feed the same tracking, and many factories use both: vision for high-volume checks and a guided manual check for fit-critical points.
Whichever method is used, every value is stored with who measured it and how, so differences between checkers become visible and can be coached.
Accuracy of camera measurement depends on how garments are laid and lit, which is tested on your styles before rollout. Ask our engineers about the set-up.
What Measurement Tracking Looks Like
The value of tracking is in the trend. A single measurement tells you whether one garment passes; a trend tells you where the order is heading.
| POM, size M | Spec | Tolerance | Mean, last 3 bundles | Status |
|---|---|---|---|---|
| Body length | 28 in | ±½ in | 28.1 in | Stable |
| Chest width | 20 in | ±½ in | 20.4 in | Drifting up, check cutting |
| Sleeve length | 25 in | ±½ in | 24.9 in | Stable |
| Shoulder width | 18 in | ±¼ in | 18.1 in | Stable |
| Hem sweep | 40 in | ±½ in | 39.7 in | Watch after washing |
In this illustrative example every POM still passes, yet chest width is using most of its tolerance and trending upward. Acting now, by checking cut panels and seam allowance, costs a few minutes. Waiting until garments fail costs rework or a failed audit.
Good tracking also shows the spread, not just the average. A POM whose average is on target but whose values scatter widely is a process that is out of control, and it will produce failures even though the mean looks fine.
Trends should also be compared across lines running the same style. If one line drifts while another stays on target with the same fabric and pattern, the cause is local to that line, which narrows the search to its cutting batch, guides or operators.
Alerts fire on trends and spread, not only on failures, so the team hears about drift early. See it on sample data in a demo.
A Measurement Routine That Holds Up
Tracking only works if the measurements are consistent. This checklist covers the routine that makes them so.
The routine is built into the guided capture on the floor, so checkers follow it without extra paperwork. A template comes with the rollout.
How iFactory Delivers Measurement Error Tracking
POMs, targets and tolerances for every style and size.
Tablet and connected-tape workflows with POM photos.
Camera measurement of flat-laid garments where it fits.
Drift and spread flagged before any POM fails.
Issues sent to cutting, sewing, finishing or pattern.
Measurement history ready for buyer questions.
It connects to your PLM spec sheets and production tracking rather than replacing them. See measurement tracking on styles like yours in a session.
Track Every Point of Measure on One Order
Pick one style on one line. We load the spec, set up guided capture and camera measurement where it fits, and show every POM trended by size and bundle.
Mean chest width is 0.4 in over spec and rising across the last three bundles. Tolerance is ±0.5 in.
Fit Drift Caught Mid-Order
This exchange shows how a quality manager might use iFactory during a knit top order.
iFactory ships as a pre-configured NVIDIA AI server, racked and ready with the garment measurement and fit analytics models loaded. Rack it, plug in power and Ethernet, and the AI is live on your network. Our scope covers cameras and lighting on measurement stations and inspection points, PLC/SCADA and ERP integration, cabling and network setup, operator and QC team training, and 24×7 remote monitoring.
Server installed, cameras and lighting mounted, historical inspection and defect records loaded.
Models trained on your own fabrics and styles, then piloted on one line with your QC team reviewing every call.
Rollout to the agreed lines, inspector and supervisor training, ERP hand-off and 24×7 remote monitoring in place.
Hardware, software and integration come as one package. For pricing on your lines, contact our sales team.
Frequently Asked Questions
It records every point of measure on inspected garments, compares each value with its spec and tolerance, and trends the results by style, size, line and stage, so drift is spotted before garments fall outside tolerance.
Most points of measure use tolerances between a quarter and a half inch. Large measurements such as a full skirt sweep can use up to one inch, and small details usually about a quarter inch.
Keep each tolerance at or below half the difference between neighbouring sizes, so a larger size at its lower limit can never measure smaller than the size below it.
Common causes are cutting accuracy, seam allowance in sewing, fabric shrinkage or stretch, washing and pressing, measuring method and grading errors.
Yes, on flat-laid garments cameras can measure many points of measure from one image. Accuracy depends on how garments are laid and lit, and fit-critical points are often still checked with a guided manual measurement.
A typical rollout takes 6–12 weeks, from spec loading and capture set-up through a pilot on one line to go-live and training. Plan it with our team.
Fix Fit Drift While the Order Is Still Running
iFactory tracks every point of measure by style, size and line, and flags drift early enough to fix it before a lot fails or a customer returns it.
Each point of measure is tracked separately, so drift shows before a lot fails.