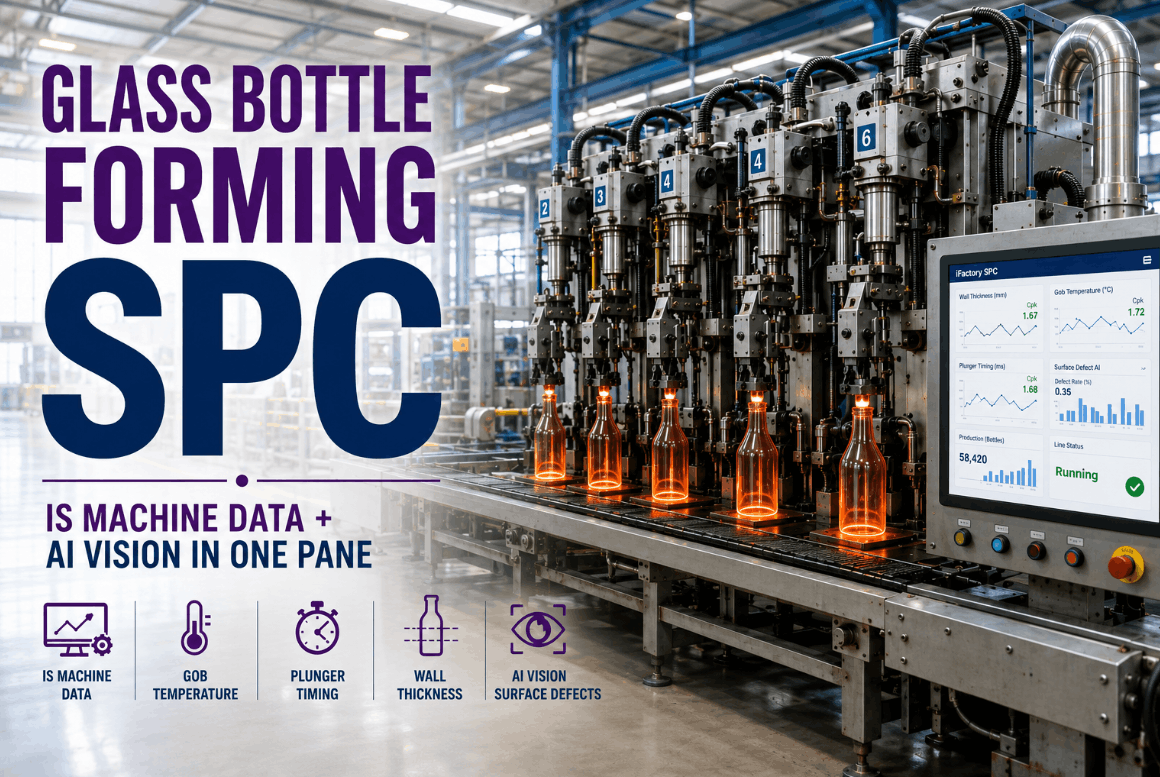
Glass Bottle Forming SPC — IS Machine Data + AI Vision in One Pane

By Henry Green on June 9, 2026

glass-bottle-forming-spc-—-is-machine-data---ai-vision-in-one-pane

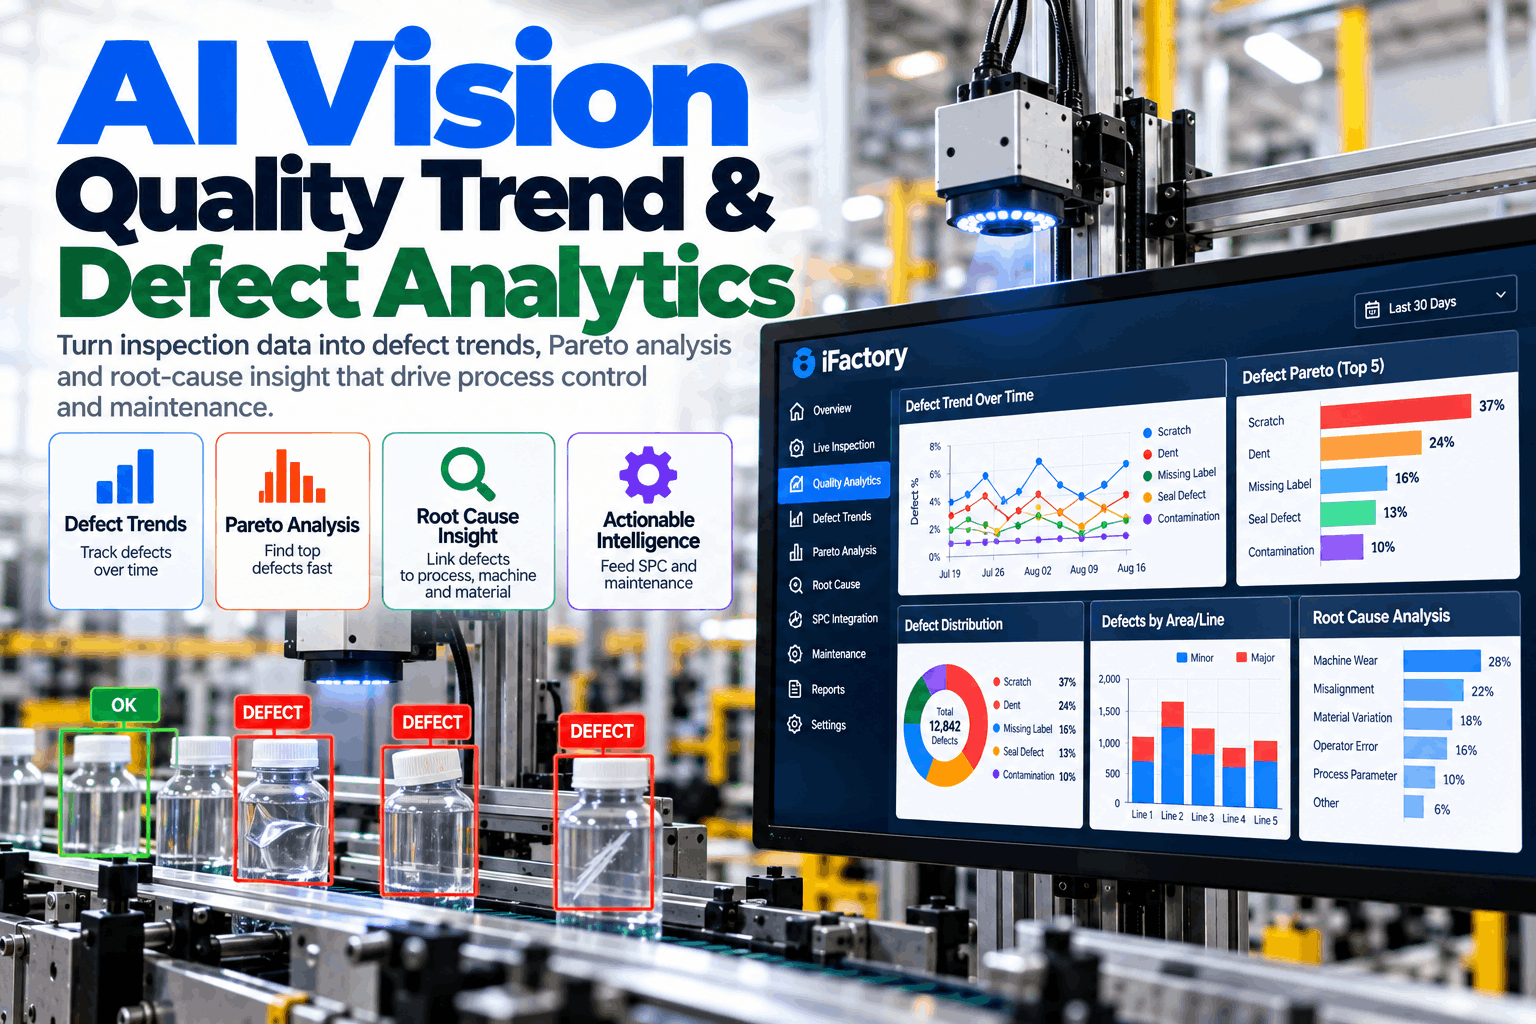
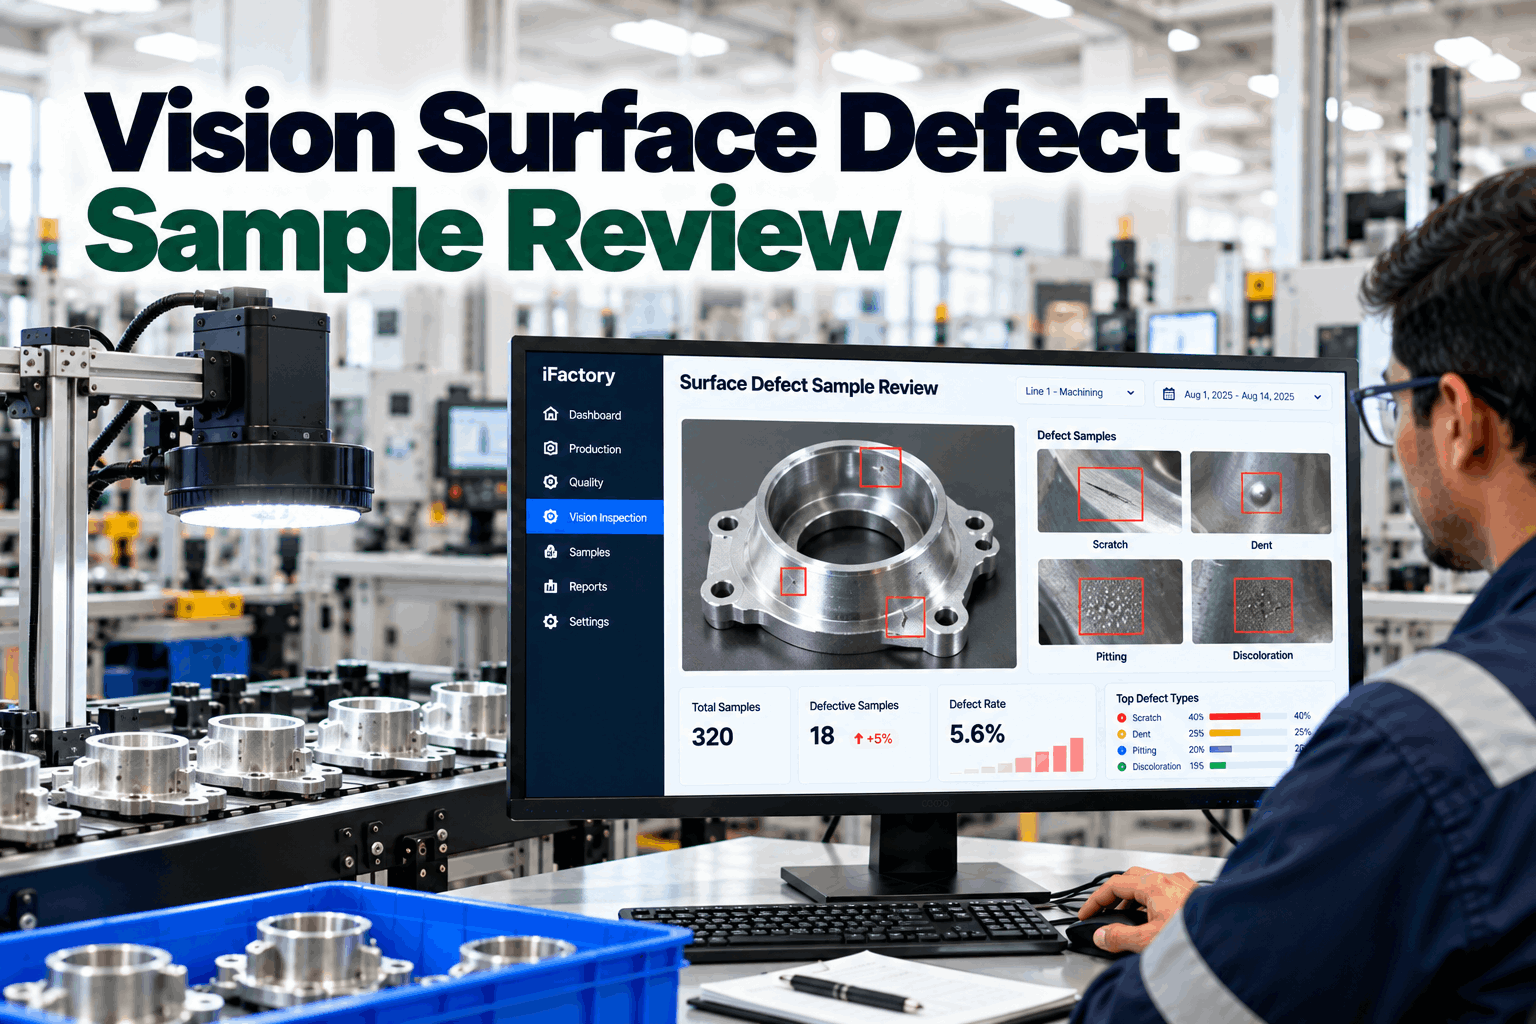
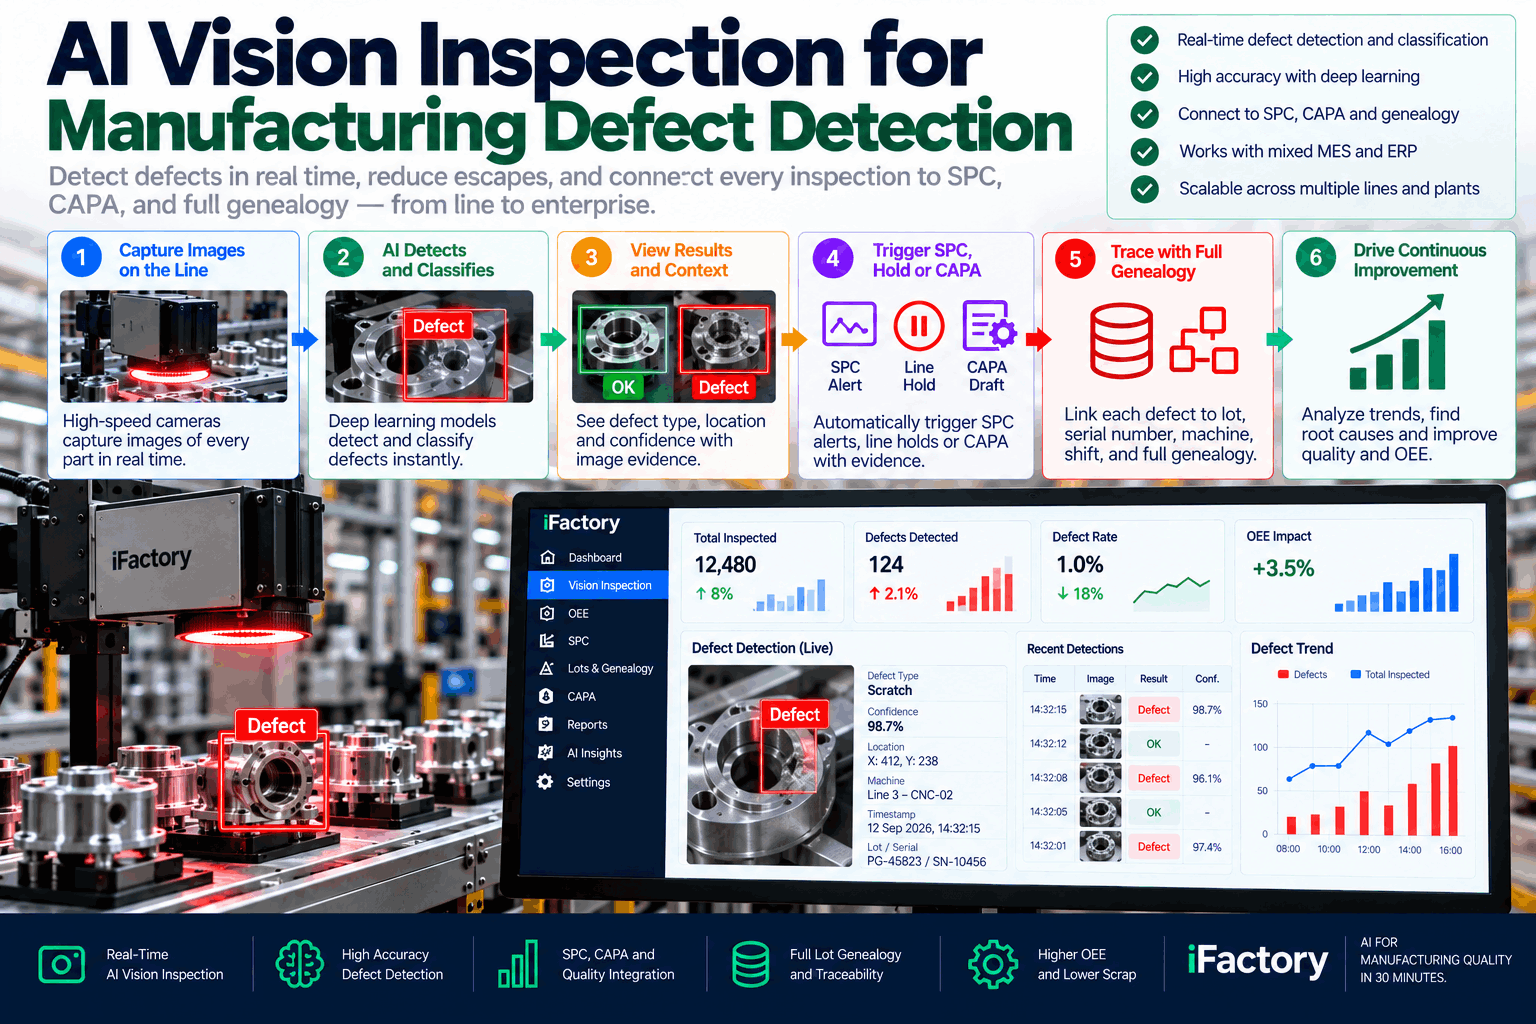
Every shift at a glass container plant generates thousands of IS machine timing events, gob temperature readings, plunger stroke profiles, and wall-thickness measurements — yet most quality teams still chase defects by toggling between five different screens, downloading CSV exports from historian databases, and running manual Cpk calculations that are already obsolete by the time the spreadsheet is saved. The result is predictable: thin-wall rejects discovered at the cold-end inspector, surface defects that slipped past threshold-based cameras, and forming process drifts that went unnoticed for hours — costing glass plants tens of thousands of dollars in cullet, rework, and lost production time per incident. iFactory changes this entirely by pulling IS machine tags, gob temperature trends, plunger timing data, wall-thickness measurements, and AI vision surface defect detections into a single SPC pane — training ML models on your plant's historical forming data to predict quality deviations before they produce a single reject.

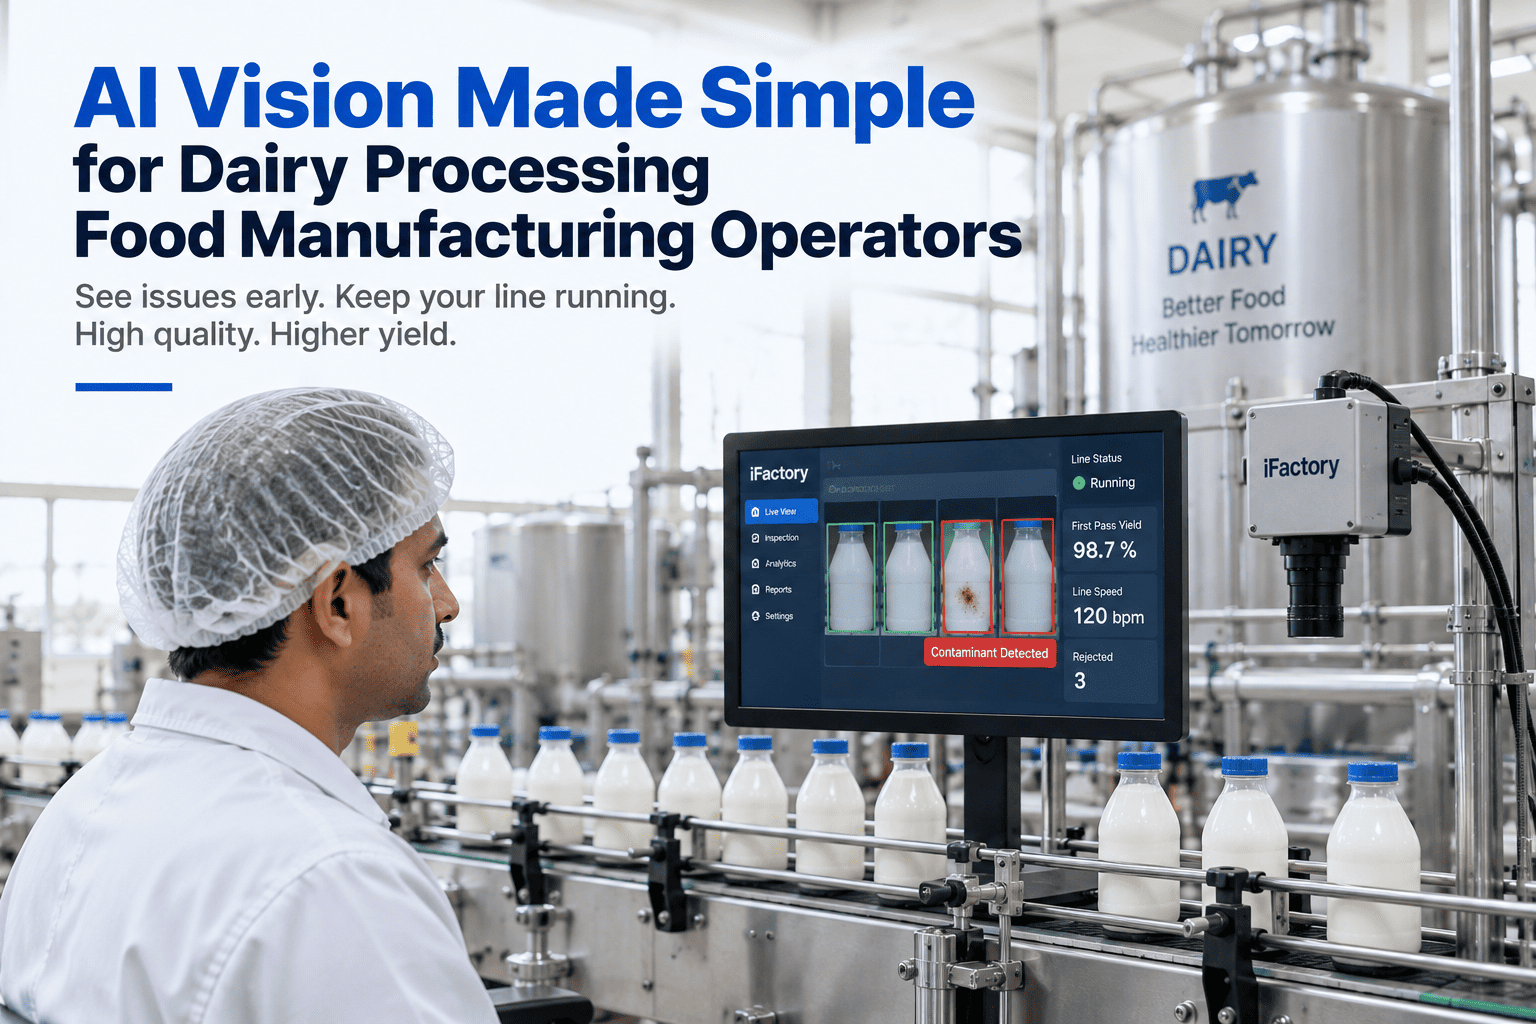
See how glass plants use iFactory to unify IS machine SPC data and AI vision defect detection in one real-time dashboard — with ML models trained on your forming line's historical quality data.

The Real Cost of Uncontrolled Glass Forming Variability

Glass bottle forming is a process of milliseconds and microns. Gob temperature variance of just 5–8 degrees Celsius, plunger timing drift of 10 milliseconds, or a 0.2 mm wall-thickness deviation at the parison stage can cascade into hundreds of thousands of rejected bottles before the cold-end inspection line catches the pattern. In conventional glass plants, these variables are monitored in isolation — IS machine PLCs log timing and stroke data, infrared pyrometers track gob temperature on a separate historian channel, wall-thickness gauges sample at sparse intervals, and AI vision cameras at the hot-end or cold-end inspect for surface defects with no feedback loop to forming parameters. The data exists. What is missing is the correlation layer that fuses these signals into a single, actionable quality picture.

Silod IS Machine and Sensor Data Streams
Plunger timing, blank cooling, baffle dwell, and gob loading parameters live in IS machine controllers. Wall-thickness scans, gob temperature logs, and vision inspection results sit in separate databases. Without a unified SPC platform that correlates these signals simultaneously, quality teams spend 60% of their shift exporting and aligning data instead of preventing defects.
Reactive Defect Detection at Cold End
AI vision systems at the cold-end inspector catch surface defects — but by the time a check, birdswing, or stone is flagged, the forming conditions that caused it have already changed. Without real-time feedback from inspection results to IS machine parameters, the same defect pattern repeats across multiple sections before the root cause is identified.
Threshold-Based SPC Without Predictive Context
Static Cpk targets and gob temperature limits generate alerts only after a parameter has already drifted outside specification. Without ML models trained on your plant's specific correlation between gob temperature trends + plunger timing shifts and resulting defect types, quality leads are always reacting to yesterday's problems on today's shift.
No Closed-Loop Learning From Reject Events
Every reject — every thin-wall bottle, every check crack, every birdswing — contains precursor data in the IS machine timing logs and sensor trends from 10–30 minutes before the defect occurred. Without a platform that learns from these historical reject events and feeds predictions back to forming parameter recommendations, each new defect investigation starts from zero.
$45K–$180K
Cost per quality incident from forming drift at a mid-size glass container plant
60%
Of quality team time spent on manual data collection and reconciliation instead of analysis
4–6 hrs
Average delay between forming parameter drift and cold-end defect detection

How iFactory Unifies IS Machine SPC Data and AI Vision on One Screen

iFactory connects directly to your IS machine controllers, gob temperature sensors, wall-thickness gauges, and AI vision inspection systems — ingesting every forming parameter and quality signal into a single pane with no data loss, no manual CSV transfers, and no custom integration engineering. The platform trains ML models on your plant's specific correlation patterns between forming parameters and defect outcomes, producing real-time SPC dashboards that surface quality deviations 1–4 hours before the cold-end inspector would register a reject.

01
Unified Data Ingestion From IS Machines and Sensors
iFactory ingests plunger timing, baffle dwell, blank cooling, and gob loading tags from IS machine PLCs via OPC-UA. Gob temperature profiles from infrared pyrometers, wall-thickness distribution scans, and AI vision defect classifications (check, birdswing, stone, blister) are fused into a single time-series data model — aligned by section, cavity, and timestamp with no manual alignment required.
02
Multi-Parameter SPC With ML-Based Baseline Models
Instead of static Cpk thresholds, iFactory trains baseline ML models on your plant's historical IS machine timing data, gob temperature trends, and wall-thickness measurements — establishing normal operating envelopes per mold, per section, per cavity. Real-time deviations from the baseline trigger SPC alerts calibrated to your specific forming line behaviour, reducing false positives and catching quality drift earlier than fixed-limit charts.
03
AI Vision Surface Defect Correlation to Forming Parameters
AI vision inspection results at the hot-end, cold-end, or both are automatically cross-referenced with IS machine timing data and gob temperature trends from the preceding window. The platform learns which parameter combinations produce specific defect types — for example, a 10 ms plunger timing shift combined with a 6-degree gob temperature drop increases birdswing probability by 3.8x on a specific section — enabling predictive interventions.
04
Real-Time Quality Dashboard With Predictive Alerts
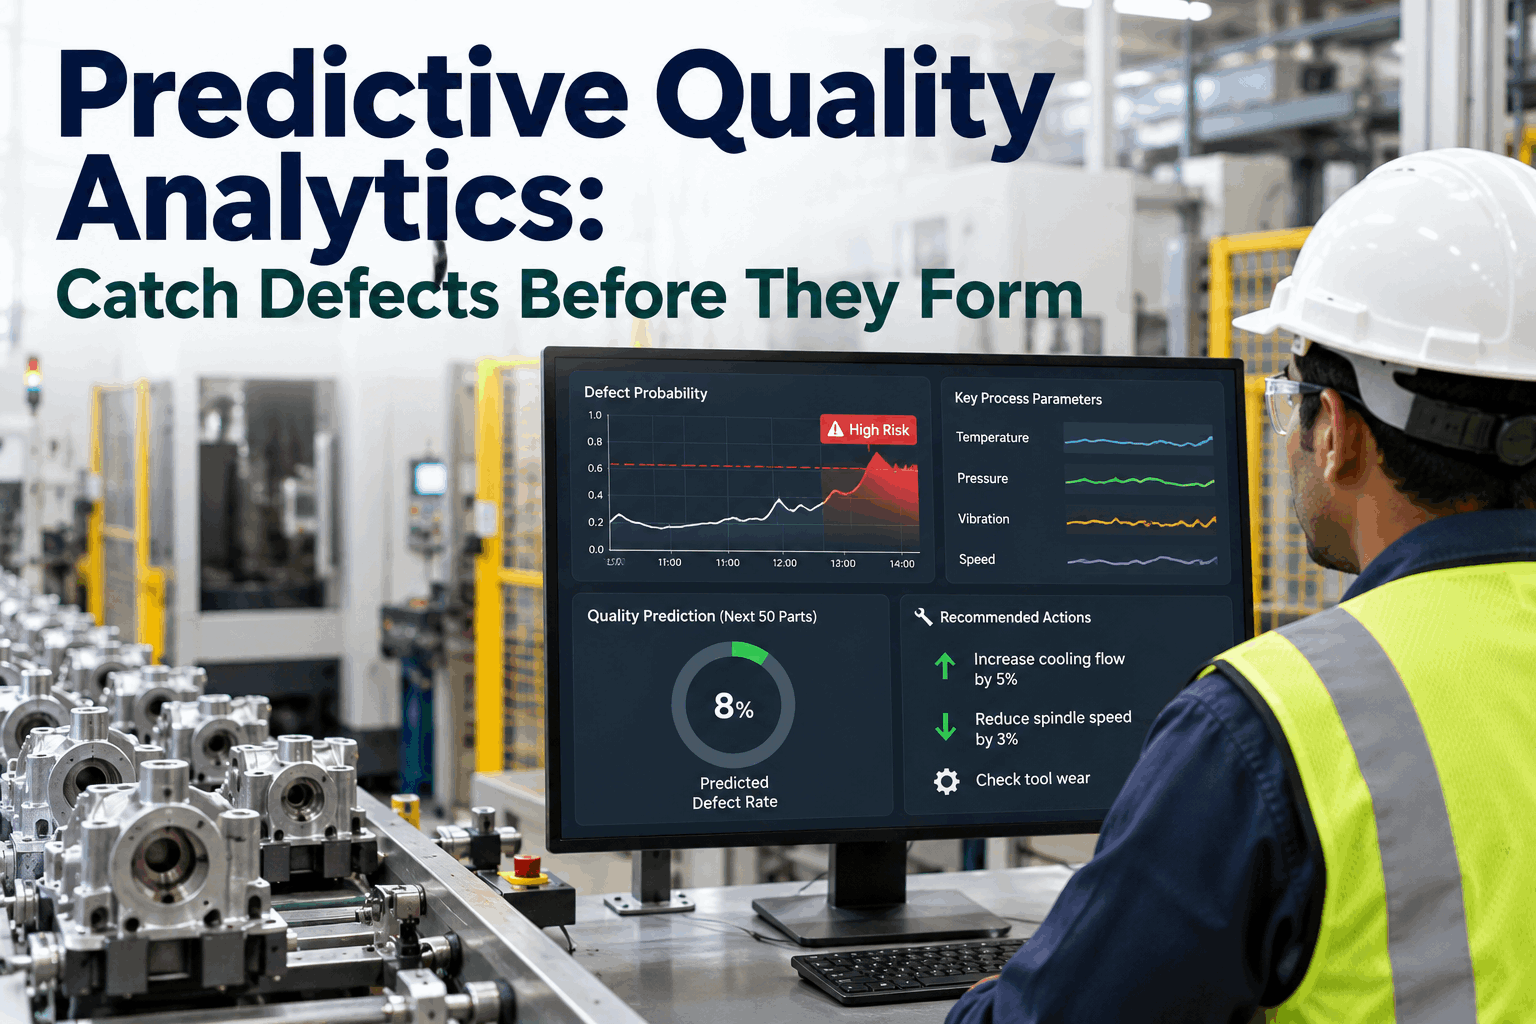
iFactory presents per-section, per-cavity Cpk trends, wall-thickness variation maps, gob temperature drift trajectories, and defect probability forecasts on a single screen. Predictive alerts rank forming parameter adjustments by expected quality impact — intervene on plunger timing, adjust blank cooling, or schedule mold maintenance — with lead times of 1–4 hours before defect thresholds are breached.
05
Continuous Model Retraining on Reject Outcomes
Every confirmed defect — from cold-end inspection rejects to customer return claims — feeds back into the ML training pipeline. The platform learns from each event, refining the correlation models between forming parameters and defect types. Prediction accuracy for birdswing, checks, and thin-wall defects improves by an average of 14% per 6-month retraining cycle as models accumulate more plant-specific failure data.

Key Glass Forming Defects That Demand Real-Time SPC and AI Detection

Glass container defects fall into categories that originate at distinct stages of the forming process — and each category requires a specific combination of IS machine parameter monitoring, sensor trend analysis, and AI vision detection to predict and prevent. The following table maps the most common defect types to their forming-stage root causes and the iFactory detection approach that addresses each one.

Defect Type Root Cause in Forming Process iFactory Detection and Prediction Method
Birdswing / Crizzle Gob temperature too low or inconsistent; plunger stroke mis-timing creates surface folds at the parison stage ML model correlating gob temperature trends + plunger timing drift from IS machine tags. Predictive alert fires 15–30 minutes before defect appears at cold end.
Check Cracks (Neck / Shoulder / Bottom) Thermal shock from uneven blank cooling; excessive baffle dwell; misaligned neck ring timing Multi-parameter anomaly detection fusing blank cooling air timing, baffle dwell duration, and thermal camera data. Real-time Cpk tracking per section.
Thin Wall / Uneven Distribution Plunger stroke depth variation; gob weight inconsistency; blank temperature gradient across mould sides Wall-thickness gauge data fused with plunger timing tags per section. ML predicts thickness deviation trend before it exceeds specification limits.
Stones and Inclusions Refractory wear debris carried in gob; batch contamination surviving melting process AI vision classification at hot end identifies inclusion events. Platform cross-references with gob loading timing and feeder data to isolate contributing section.
Blister / Seed Entrained gas in molten glass; temperature spike in gob causing volatile release during forming Gob temperature drift detection combined with IS machine section-specific timing analysis. Predictive model flags blister probability based on temperature + timing signatures.
Stuck Glass / Mold Marks Mold release degradation; excessive blank cooling; plunger lubrication inconsistency Surface defect AI vision classification with trend analysis across mold cycles. Predictive maintenance trigger when defect frequency per mold section exceeds ML-derived baseline.

iFactory's AI vision integration does not replace your existing inspection cameras — it augments their output by correlating every defect classification with the IS machine and sensor data that preceded it. This is the difference between knowing you have a quality problem and knowing exactly what forming parameter caused it, which section produced it, and how to adjust the process to prevent the next one. Book a Demo to see how iFactory correlates IS machine SPC data with AI vision defect detection in a single pane.

From Data Silos to Closed-Loop Quality Control: How Glass Plants Make the Transition

Closing the loop between forming parameters and quality outcomes has historically required custom data engineering projects that take 6–12 months and never quite reach full production integration. iFactory delivers a structured migration path that moves glass plants from disconnected data silos to unified, ML-driven quality control in 5 weeks — with measurable Cpk improvements and defect reduction beginning in week 3.

Weeks 1–2
Data Audit and Unified Model Architecture
Quality assessment of IS machine tag maps, gob temperature sensor logs, wall-thickness gauge data, and AI vision inspection outputs — identifying missing data streams and alignment gaps
Unified time-series data model design that fuses forming parameters, sensor readings, and defect classifications by section, cavity, and timestamp
OPC-UA and REST API integration planning with IS machine PLCs, vision system databases, and plant historian connections
Weeks 3–4
ML Model Pilot and Quality Dashboard Activation
Deploy trained ML models to highest-impact defect categories — birdswing prediction, check crack forecasting, and thin-wall drift detection
Real-time SPC dashboard delivered to quality lead workstation with per-section Cpk trends, gob temperature trajectories, and AI defect correlation views
First predictive quality interventions executed — forming parameter adjustments triggered by ML alerts before defects reach cold-end inspection
Week 5
Full Line Rollout and Quality Metrics Baseline
Expand quality prediction models to all forming sections, all cavity positions, and all defect categories tracked by AI vision
Automated quality reporting and corrective action tracking integrated with plant CMMS for mold maintenance scheduling
Baseline report delivered — Cpk improvement, defect rate reduction, and quality team time savings measured from week 3 pilot data
QUALITY ROI IN 3 WEEKS: MEASURABLE RESULTS FROM WEEK 3
Glass plants completing the 5-week program report an average of 37% reduction in cold-end defect rates and 52% reduction in time-to-root-cause for quality incidents within the first 3 weeks of full production rollout — with Cpk improvements of 0.3–0.6 points validated across monitored defect categories by week 3 pilot testing.
37%
Defect rate reduction in first 3 weeks
52%
Faster root cause identification
0.3–0.6
Cpk improvement by week 3 pilot

What Glass Plant Quality Leads Say About iFactory's Unified SPC and AI Vision Platform

The following testimonial is from a quality lead manager at a glass container facility currently running iFactory's unified IS machine SPC and AI vision platform in the United States.

Before iFactory, our quality team was spending entire shifts pulling IS machine timing logs from the PLC, gob temperature CSV exports from the pyrometer system, wall-thickness readings from the lab gauge, and vision defect reports from the cold-end inspector — then trying to align them all manually in spreadsheets to find correlations. By the time we had a theory about what caused a defect spike, the forming conditions had changed and we were chasing yesterday's problem again. iFactory ingested all of those data streams into one pane and trained ML models that now predict birdswing events 45 minutes before they reach the cold end, check crack probability trends in real time, and wall-thickness drift patterns 2 hours before they produce thin-wall rejects. In our first 12 weeks live, the system identified 11 forming parameter drift patterns that would have caused quality incidents — we adjusted on all 11 without a single defect spike. Our Cpk improved by 0.5 points, our cold-end reject rate dropped 31%, and our quality team now spends their shifts on root cause analysis instead of data entry.
Quality Lead Manager
Glass Container Manufacturing Plant, Midwest USA

Conclusion: Stop Chasing Defects Your Data Already Predicted

Glass container plants generate immense volumes of forming process data with every cycle — IS machine timing events, gob temperature trends, wall-thickness distribution scans, and AI vision defect classifications — yet most quality teams still operate with a reactive, siloed approach that treats each data source as a separate system. The gap between world-class glass forming quality and the industry average is not a sensor availability gap or a technology gap. It is a correlation gap — the missing layer that connects what the forming machine is doing to what the inspection cameras are finding.

iFactory closes that correlation gap in five weeks. Unified data ingestion from IS machine controllers and AI vision systems, ML models trained on your plant's specific correlation between forming parameters and defect outcomes, real-time SPC dashboards with predictive alerts, and continuous model improvement from every confirmed reject event — deployed without disrupting production or requiring custom data engineering. Book a Demo to see how iFactory unifies IS machine SPC data and AI vision defect detection for glass container plants.
Unify IS Machine SPC and AI Vision on One Screen. Deploy in 5 Weeks. Results in Week 3.
iFactory gives glass plant quality leads ML models trained on their own forming data, real-time SPC dashboards with per-section Cpk tracking, AI vision defect correlation to forming parameters, and predictive quality alerts — fully deployed in 5 weeks, with measurable defect reduction starting in week 3.
IS Machine Tag Ingestion
AI Vision Defect Correlation
Real-Time SPC Dashboard
ML-Based Predictive Alerts
37% Avg. Defect Reduction

Frequently Asked Questions

iFactory integrates natively with IS machine PLCs via OPC-UA, Modbus TCP, and direct tag mapping, plus AI vision inspection systems from Emhart, MSC, and Tiama via REST API and database connectors — all aligned in a unified time-series data model.
iFactory begins producing meaningful quality predictions with 6–12 months of IS machine tag history, gob temperature logs, and vision defect records, with accuracy improving significantly beyond 18 months of aggregated forming data.
Yes — iFactory's ML architecture includes job-class and mould-set classifiers that segment training data by job ID, glass colour, and mould configuration, allowing SPC baselines to adjust automatically for each production run.
No — iFactory augments your existing inspection infrastructure by correlating every defect classification from vision systems with the IS machine and sensor data that preceded it, adding predictive context without replacing any installed equipment.
Role-based training modules are delivered during weeks 3–4 of deployment; quality leads and forming technicians achieve platform proficiency in under 90 minutes, with ongoing technical support included in the deployment package.

Share This Story, Choose Your Platform!