Walk into a pharma operations meeting and you will hear availability, utilization, and OEE used as if they were three names for the same thing. They are not. Each measures a different slice of time and answers a different question, and confusing them is how a team ends up fixing the wrong problem — chasing reliability when the real issue is an empty schedule, or buying capacity when the equipment they have runs badly whenever it runs. The stakes are not academic: the metric you look at decides the lever you pull. This guide sorts out what each number actually means in a GMP plant, where they overlap, and which one should drive which decision. Measured on one agreed time model, they finally stop contradicting each other.
Operations Metrics for Pharma Managers
OEE vs Availability vs Utilization: A Pharma Manager's Guide
Three metrics, three different questions. See what availability, utilization, and OEE really mean in a GMP plant, why they can point in opposite directions, and which one should drive each decision you make.
Availability
run vs planned
Utilization
planned vs total
Three Numbers, Three Different Questions
The confusion is understandable, because all three are about time and equipment and all three are quoted as percentages. But they sit on different denominators, and the denominator is the whole point. One asks whether you ran when you meant to, one asks how much of your asset you bothered to use, and one asks how effectively you ran when you did. Answer the wrong question and even a correct number sends you the wrong way.
What Each One Actually Means
Start with clean definitions. The formula matters less than the question each one is really asking.
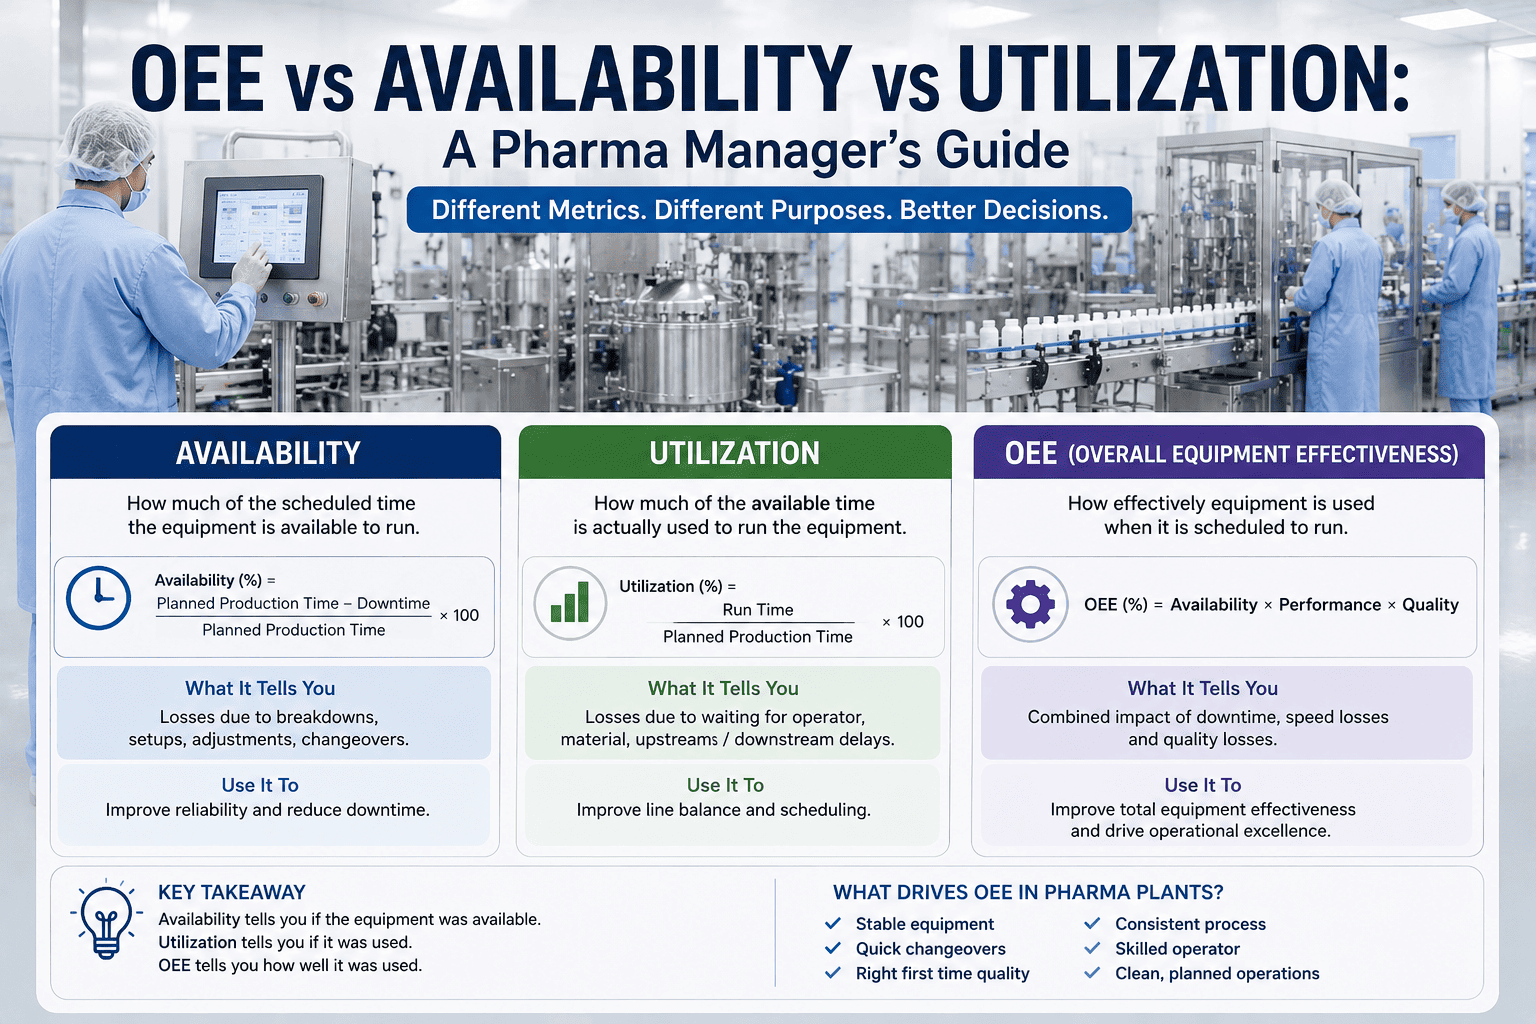
Availability
Run time ÷ Planned production time
"When we planned to run, were we actually running?"
Lost to breakdowns and changeovers inside the planned window. It is also one of the three factors inside OEE.
Utilization
Planned production time ÷ Total available time
"How much of the asset we own are we using?"
Lost to time never scheduled — no demand, no shift booked. A planning and commercial signal, not an equipment one.
OEE
Availability × Performance × Quality
"When we planned to run, how effectively did we run?"
Effectiveness during planned production time — good product, at speed, without stops. It says nothing about how often you chose to run.
Where Each Metric Lives in the Day
The clearest way to see the difference is to lay the whole clock out and watch time peel away in layers. Each metric measures a different span of this ladder — and once you see that, they stop competing.
From all the hours in the calendar to good product
Planned production time
− not scheduled / no demand
Run time
− breakdown, changeover
Good product time
− rejects, rework
UtilizationPlanned ÷ Total — how much of the calendar you scheduled
OEEGood ÷ Planned, as A × P × Q — effectiveness of the time you scheduled
TEEPGood ÷ Total — utilization and OEE combined, the fullest measure
The Pharma Wrinkle: GMP Owns a Lot of the Clock
In a GMP plant, the ladder above is complicated by all the time that compliance legitimately consumes. Cleaning, changeover, requalification, QC release holds, preventive maintenance, media fills — none of it makes product, and where you place it changes everything. Count cleaning as planned downtime and it leaves OEE untouched; count it inside planned production time and it sinks your availability. Neither is wrong, but a team that has not agreed which convention it uses will argue past each other forever.
Time a GMP plant spends not making product — and must classify consistently
Cleaning / CIPChangeoverRequalificationQC release holdPreventive maintenanceMedia fills
The single most useful thing a pharma operations team can do with these metrics is agree, once, where each of these buckets sits. Utilization will look low because so much of the clock is compliance — and that is often correct, not a failure.
High or Low Tells You Nothing on Its Own
Because OEE and utilization measure different things, a number is only meaningful next to the other. The same 60% OEE means opposite things at high versus low utilization — and each combination points to a completely different action.
OEE highOEE low
High OEE · Low utilization
Runs beautifully, but rarely runs. This is a demand or scheduling problem — do not send it to maintenance.
High OEE · High utilization
Firing on all cylinders. Protect it, and look here before adding capacity.
Low OEE · Low utilization
Idle and ineffective. Question whether the asset earns its place at all.
Low OEE · High utilization
Always running, running badly. An operations, reliability, or quality problem — not a capacity one.
Utilization lowUtilization high
Do you know which quadrant your critical lines are actually in? Book a 30-minute demo and we'll map your metrics onto one time model.
Which Number Drives Which Decision
Once the definitions are clear, the metrics divide the work cleanly. Each one belongs to a different owner and drives a different kind of decision.
OEE
Operations
Drives reliability, changeover reduction, line speed, and reject elimination — the effectiveness of the time you run.
Utilization
Planning and commercial
Drives schedule fill, product mix, make-versus-buy, and capacity and capital decisions — whether you are using what you own.
Availability
Maintenance
Drives breakdown reduction and PM strategy — keeping the equipment ready when it is scheduled to run.
What Getting the Definitions Right Delivers
Clarity on three numbers sounds small, but it is the difference between a team that acts and a team that argues.
Right
Problem named
demand versus reliability, told apart
Right
Lever pulled
the fix matches the metric
Aligned
Teams
one time model, no talking past each other
Better
Capital calls
capacity added only when utilization says so
Frequently Asked Questions
Can OEE be high while utilization is low?
Absolutely, and it is common in pharma. A line can run near-perfectly during the shifts it is scheduled — high OEE — while being scheduled for only a fraction of the calendar because of low demand or campaign patterns, giving low utilization. The two are independent by design: OEE measures effectiveness within planned time, utilization measures how much time was planned at all. Reading them together is what prevents you from sending a demand problem to the maintenance team.
Where should cleaning and qualification time go?
There is no single right answer, which is exactly why it must be decided deliberately. If you treat cleaning, changeover, and qualification as planned downtime, they fall outside the OEE base and OEE reflects only how you performed while actually producing. If you fold them into planned production time, they show up as availability losses. Both conventions are defensible; the discipline is choosing one, documenting it, and applying it consistently so the numbers are comparable over time and across lines.
What is TEEP and do we need it?
TEEP, total effective equipment performance, is utilization multiplied by OEE — good product time as a fraction of all calendar time. Where OEE asks how well you used your planned time, TEEP asks how well you used every hour that exists. It is valuable when the question is about true spare capacity, such as before a capital investment, because it captures both the effectiveness and the scheduling gaps in a single number. For day-to-day operational improvement, OEE and utilization side by side are usually enough.
Which metric should we put on the daily board?
For the operations team, OEE with its availability, performance, and quality breakdown, because those are the levers they control shift to shift. Utilization belongs on the planning and leadership view, where scheduling and demand decisions are made. Putting utilization on the operators' board tends to frustrate them, since much of it is outside their control, while putting only OEE in front of leadership hides a capacity story they need to see.
How do we get all three on one consistent basis?
By defining the time model once and measuring everything from the same clock, rather than letting each report compute its own denominator. The best next step is a demo where we take one of your lines, agree how each GMP time bucket is classified, and show availability, utilization, OEE, and TEEP derived from a single, consistent picture of the day, so the numbers finally reconcile.
Stop Fixing the Wrong Problem.
See Your Metrics on One Time Model
Bring one line and the arguments you keep having about its numbers. We'll agree how each GMP time bucket is classified and show availability, utilization, OEE, and TEEP from a single consistent clock — so every number points to the right decision.