Most power plants have had energy audits. Many of those reports sit in a cupboard or a shared drive, full of observations and recommendations that were never costed, owned or tracked. The audit met its obligation but changed little. A good detailed energy audit ends differently: with a ranked action plan, owners, costs, expected savings and a recovery roadmap that the plant actually follows. This guide sets out a methodology that gets there, covering scope and standards, preparation, measurement, heat rate gap analysis, auxiliary power analysis, ranking of measures and the action plan that turns findings into recovered heat rate. To see audit findings turned into a live recovery roadmap, book a short walkthrough.
Power Plant Detailed Energy Audit Methodology: From Findings to a Recovery Roadmap
A structured audit that measures where heat rate and auxiliary power are lost, puts a value on each loss and ends with an owned, tracked action plan instead of a report.
Why Most Energy Audits End Up in a Drawer
Energy audits often fail after the fieldwork, not during it. The report lists dozens of observations of uneven quality, without clear values, costs or owners. Some recommendations are obvious, some are impractical and some conflict. With no ranking and no tracking, the plant does a few easy items and the rest wait for the next audit, which finds the same issues again.
The opportunity is real. An EIA analysis of heat rate improvement potential cites a 2010 NETL assessment that found gaps of 1.8% to 4.2% between average fleet efficiency and the 90th percentile across coal unit groups, and EPRI studies documenting 3–5% improvements through various means. In India, designated consumers under the Energy Conservation Act must carry out audits, and the PAT scheme ties targets to net heat rate.
The methodology below is designed so the final output is a plan people can act on. We can review your last audit report on a call.
Scope and Standards for a Detailed Audit
A detailed energy audit should be clear about what it covers and which methods it follows.
Agreeing scope and outputs at the start, including the action plan, is the first step to an audit that changes something. Our auditors set this out in the audit plan.
The Audit Methodology Step by Step
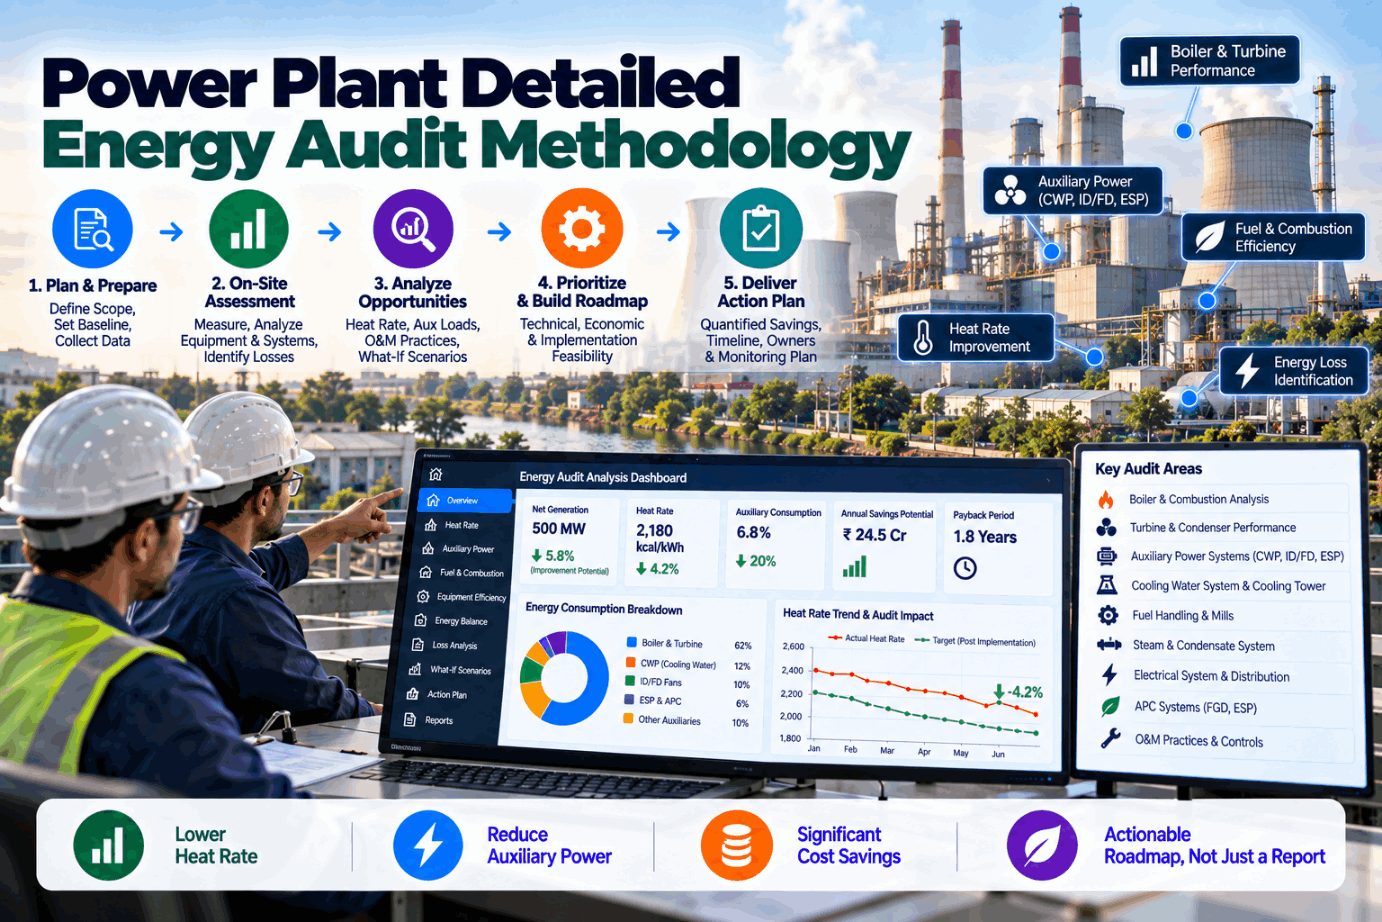
The methodology follows six stages, each with a clear output that feeds the next.
Data request, design references, audit plan and team roles.
Historian, DCS and log analysis to find patterns and suspect areas.
Tests and instrument checks on boilers, turbines and auxiliaries.
Actual versus design heat rate split into individual losses.
Improvement options identified, costed and ranked.
Owners, dates, savings and verification method agreed.
Test conditions deserve planning. Load should be held steady during key tests, coal should be sampled for the test period, and sootblowing and other disturbances should be scheduled around measurements. A test run during a load swing or with unknown coal quality produces numbers nobody can defend later.
Data review before fieldwork is the step most audits skimp on. Months of historian data show where performance drifts, which loads are worst and which instruments look suspect. That focuses field measurement where it will find the most.
A good audit also checks key instruments. Decisions based on a drifting flow meter or a faulty oxygen probe can point the whole plan the wrong way. We include instrument checks in every audit plan.
What to Measure and Why
Measurement effort should follow the value of the information. This plan covers the core systems.
| System | Key measurements | What it reveals |
|---|---|---|
| Boiler | Flue gas O2, CO and temperature, unburnt carbon, coal analysis | Boiler efficiency and loss breakdown |
| Air heater | O2 and temperature before and after | Leakage and heat recovery |
| Turbine | Pressures and temperatures across sections | Section efficiencies and valve losses |
| Feedwater heaters | Terminal and drain cooler temperature differences | Heater performance and bypassing |
| Condenser | Backpressure, cooling water temperatures and flow | Vacuum deviation and cleanliness |
| Fans and pumps | Flow, pressure and power | Equipment efficiency and throttling losses |
| Mills | Power, throughput, fineness | Specific power and grinding performance |
Where permanent instruments are reliable, historian data can replace some field tests. Where they are not, temporary instruments are worth their cost. Our engineers make that call per system during preparation.
Heat Rate Gap Analysis: Where the Loss Actually Is
The heart of the audit is splitting the difference between actual and design heat rate into individual, valued losses.
Illustrative figures. Each loss is calculated from measured deviations and the unit’s correction curves.
Each loss should be reported at more than one load, because the pattern often changes between full and part load. A condenser that is fine at part load may cost heavily at full load on a hot day, and excess air losses are often worst at low load.
The unexplained remainder matters too. It may be turbine internal losses that need a dedicated test, measurement uncertainty, or non-controllable factors such as coal quality or ambient conditions. Stating it honestly is better than forcing it into a category.
Once each loss has a value, ranking measures becomes straightforward. The gap analysis becomes the baseline for tracking recovery in the roadmap.
Ranking Measures by Value, Cost and Timing
Not every finding deserves the same attention. Measures should be ranked on value, cost, risk and when they can be done.
Illustrative figures. The first three measures deliver most of the recoverable gap, and two of them need no outage.
Interactions should be checked too: fixing air heater leakage also lowers fan power, while cleaning the condenser can change how many cooling water pumps are needed.
Timing is part of the ranking. Some measures, such as excess air tuning and sootblowing, can be done immediately in operation. Others, such as air heater seals and heater repairs, need an outage. The roadmap should put the no-outage measures first and book the outage measures into the maintenance plan.
Costing each measure, even roughly, turns the list into an investment case. We help build that case with your finance team.
From Findings to a Recovery Roadmap
The action plan is the real output of the audit. It should be specific enough to manage.
Each measure named with one accountable owner.
Expected heat rate or auxiliary power saving, and estimated cost.
Immediate, next short outage or next major outage.
How the saving will be measured and against which baseline.
Progress reviewed weekly or monthly, with savings recorded as achieved.
Next audit focuses on what changed and what remains.
Verification closes the loop. Without it, measures are marked done without proof that heat rate improved, and the next audit finds the same losses. With it, the plant builds a record of recovered heat rate that supports PAT reporting and investment decisions.
Tracking is where most audits stop. Keeping the gap analysis live, with daily data, makes the roadmap self-checking. See it in a demo.
Detailed Energy Audit Checklist
Use this checklist to plan and judge an audit.
The last group is where most value is won or lost. Ask our team how tracking is set up after an audit.
How iFactory Supports Detailed Energy Audits
Months of data reviewed to focus fieldwork.
Suspect sensors flagged before they skew results.
Heat rate gap split into controllable losses.
Savings, costs and timing compared.
Actions, owners and verified savings tracked.
Audit and PAT reporting from the same data.
It works alongside accredited auditors and your performance team. Share your last audit and we will show it as a live roadmap in a session.
Turn Your Next Energy Audit Into a Roadmap
We analyse your historian data before fieldwork, build the heat rate gap with your auditors and deliver a ranked, owned action plan that stays live after the audit ends.
Net heat rate is 142 kcal/kWh above design. Controllable losses identified for 96 kcal/kWh, led by condenser, air heater leakage and excess air.
An Audit Finding Tracked to Recovery
This exchange shows how a performance manager might track audit actions with iFactory.
iFactory ships as a pre-configured NVIDIA AI server, racked and ready with the energy audit analytics and tracking models loaded. Rack it, plug in power and Ethernet, and the AI is live on your network. Our scope covers sensors and data connections across boilers, turbines and auxiliary systems, DCS, PLC/SCADA, historian and ERP integration, cabling and network setup, operator and quality team training, and 24×7 remote monitoring.
Server installed, DCS and historian links live, historical operating, performance and maintenance data loaded.
Models calibrated on your own unit data, then run in advisory mode on one unit with your operations and performance engineers reviewing every output.
Rollout to the agreed units under your change management, operator and engineer training, and 24×7 remote monitoring in place.
Software, server and integration come as one package. For pricing on your station, contact our sales team.
Frequently Asked Questions
A structured assessment of where heat rate and auxiliary power are lost, based on data review and field measurement, ending with valued, ranked measures and an action plan.
ISO 50002 sets general requirements for energy audits. In India, designated consumers are audited under the Energy Conservation Act, 2001 by accredited energy auditors, with PAT measurement and verification where applicable.
It splits the difference between actual and design heat rate into individual losses, such as condenser vacuum, excess air, air heater leakage and heater performance, each with a value.
By value, cost, risk and timing. Measures that need no outage and deliver large savings usually come first; outage measures are booked into the maintenance plan.
Because recommendations lack values, costs, owners and verification. A good audit ends with an action plan that is tracked against the gap baseline.
Fieldwork usually takes days to weeks, with data review before and analysis after. Tracking continues afterward. Plan it with our engineers.
Make Your Next Audit the One That Recovers Heat Rate
iFactory focuses the audit with data, values every loss, ranks every measure and keeps the roadmap live, so findings turn into verified savings rather than another report.
Illustrative. Each measure has an owner, cost and date in the action plan.