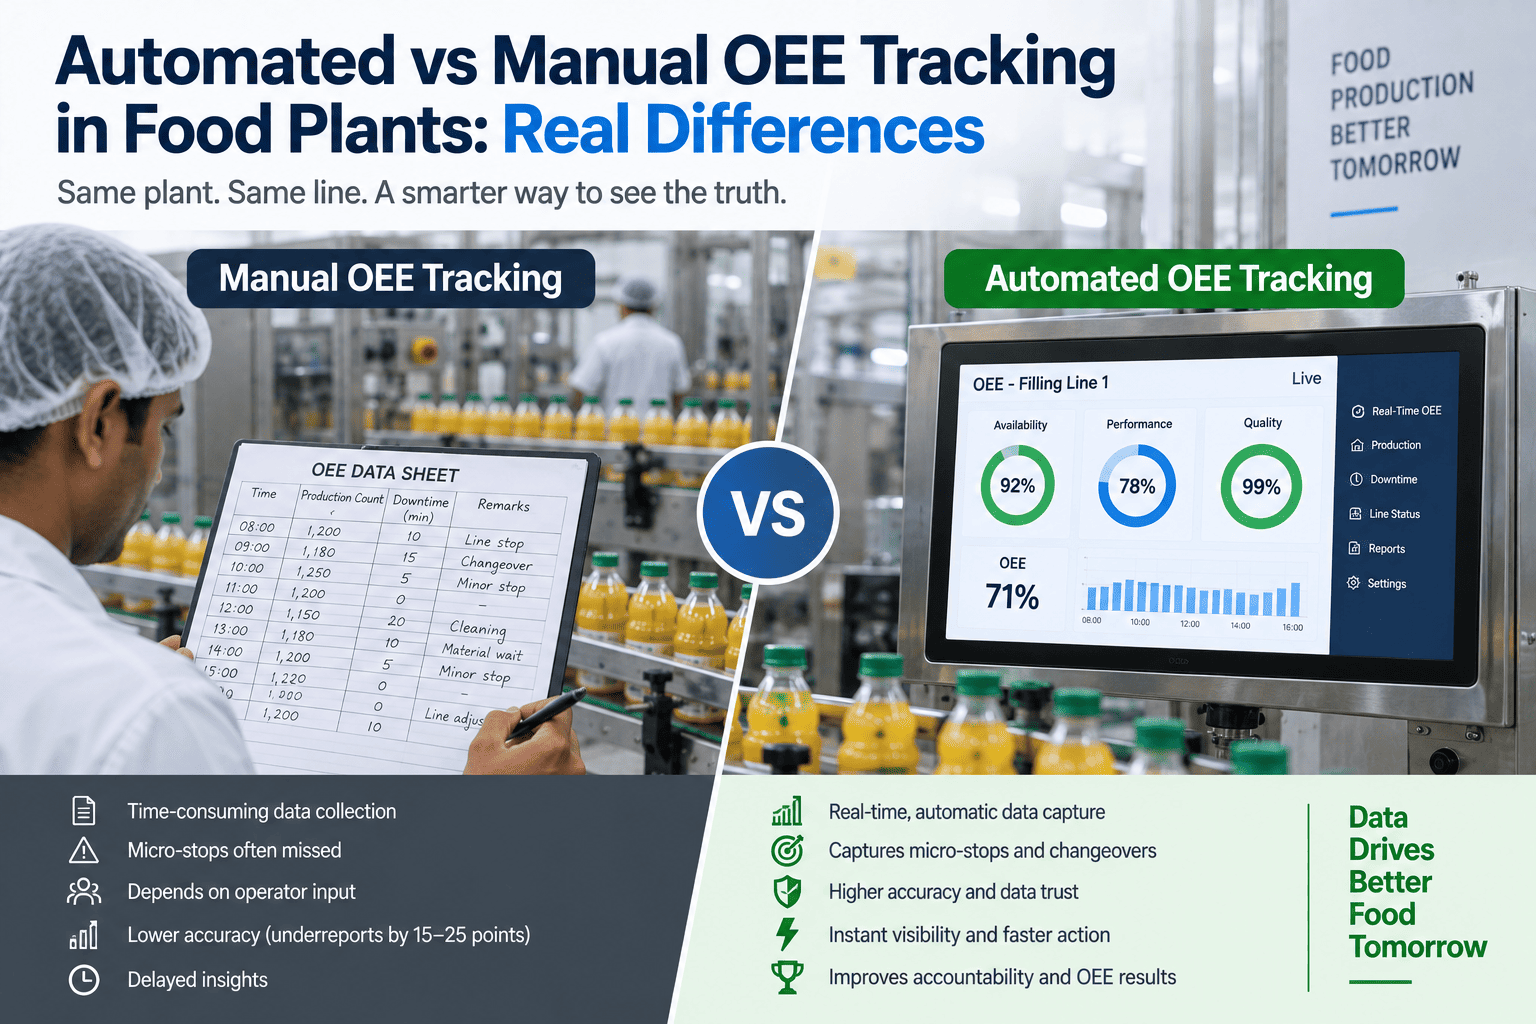
Most food plants trust their OEE number, and most of those numbers flatter the plant. Nobody cheated. A changeover was left out of planned time because it was "planned". Full speed was set at the budget rate, not the machine's rated speed. Short stops were never written down. Reworked product was counted as good. Each choice sounded reasonable, and together they can lift a line from 61% to 82% on paper. This checklist gives you six checks, each taking about thirty minutes, that show whether your OEE is honest. It also shows how iFactory measures the same line automatically, so the checks pass by design. To run them with us on one line, book an audit session.
OEE Measurement Audit Checklist for Food Plants 2026
Six checks that show whether your OEE can be trusted, or whether it is sitting many points too high and hiding the losses you most need to see.
- Each check has one question, one test and clear red flags
- A worked example: 82% reported, 61% real
- What to do after the number falls
Work this out for one shift from raw counts and compare it with the OEE in your report. If the two differ by more than a point or two, one of the six checks will tell you why.
Why Food Plant OEE Reads High
Nobody sets out to inflate OEE. Every exclusion sounded sensible on the day it was made.
OEE is three ratios multiplied together, and each one has a soft spot. What counts as planned time? What counts as full speed? What counts as good? Shift any of them a little in the plant's favour and the result climbs. Here is one shift on one line, worked both ways from the same raw facts. Our support team can do the same for a shift of yours.
Illustrative. The line made exactly the same biscuits in both columns. Only the definitions changed, and the answer moved by 21.7 points.
Why food plants are especially prone
- Many changeovers. Short runs, allergen cleans and label changes, all easy to call "planned".
- Many products. Each runs at its own speed, but one standard rate is used for all.
- Many short stops. Jams, film breaks and misfeeds that last seconds.
- Rework and holds. Product that is fixed or released later still gets counted as good.
- Paper at shift end. Figures written from memory, in round numbers.
Why it matters
A line that believes it is at 82% looks for small gains. A line that knows it is at 61% knows it has a third more output to find without buying anything.
An optimistic OEE does more than mislead. It removes the reason to act.
Checks 1 and 2: The Clock and the Speed
The two largest sources of optimism are what you leave out of the day, and what you call full speed.
Start here, because these two checks need no data collection at all. You only need last week's schedule, the standard rates in your OEE sheet and the machine nameplates. If either check fails, the OEE figure is wrong before a single stop has been counted. To go through both on your own line, book a working session.
The clock
Often 4–8 pointsAsk. What has been taken out of the day before OEE is worked out?
Test. Take one week's schedule. List every block of time removed from planned production time, and the reason given.
- Changeovers removed as "planned"
- Cleaning and start-up removed
- Waiting for materials or people removed
- A different rule on each line
Rule of thumb: only remove time when the line was never meant to run. Everything else is a loss worth seeing.
The speed
Often 3–7 pointsAsk. What does 100% speed mean on this line, for this product?
Test. For your five biggest products, compare the standard rate in the OEE sheet with the rated speed and with the best hour ever run.
- Performance above 100% on any shift
- One rate used for every product
- The standard is a budget or an average
- Nobody knows who set it, or when
A speed standard that the line beats on a normal day is not a standard. It is a comfort.
Changeovers count as a loss in standard OEE. Cleaning is where plants differ: some count it, some remove it as required by food safety. Either choice can be defended. What cannot is leaving it unstated. If you remove cleaning, say so on the report, apply it the same way on every line, and keep a second figure with cleaning included so the time stays visible.
Checks 3 and 4: The Stops and the Count
Now test the data itself: the stops nobody wrote down, and the product that was not really good.
These two need one shift of real numbers and half an hour on the floor. They are where manual recording fails most often, through no fault of the operators. Nobody running a line can also log a stop of forty seconds, twenty times an hour. Ask our line specialists how to run the tally.
The stops
Often 2–5 pointsAsk. Do the stops in the log add up to the time the line really lost?
Test. Stand at the line for thirty minutes with a tally sheet and a watch. Count every stop. Compare with what the log shows for the same half hour.
- No stop under five minutes is ever logged
- Stop times are round: 10, 15, 30 minutes
- The log is filled in at the end of the shift
- Output is low but logged downtime is small
Desk version: packs made, divided by logged run time. If that speed is well below what you see on the line, stops are missing.
The count
Often 1–3 pointsAsk. Where is good product counted, and what is allowed to count as good?
Test. For one shift, put three numbers side by side: the count at the filler, the count accepted at the checkweigher, and the count received by the warehouse.
- Counted at the filler, not the end of the line
- Reworked product counted as good
- Product on hold counted as good
- Start-up waste left out of the count
Good means right first time. Product that had to be fixed, re-packed or released later was a quality loss, even if it was sold.
One Shift, Two Answers
The same shift as the worked example, with each check that failed and what it changed. Put your own numbers through the same four lines.
Checks 5 and 6: The Sums and the Record
Right inputs can still give a wrong answer if the arithmetic is loose or the record can be changed.
The last two checks look at what happens after the data is collected. How are lines and shifts combined into a plant figure? And who controls the numbers? These are the checks that keep the first four honest once you have fixed them. To review your own reports with us, book a report review.
The sums
VariesAsk. Does the reported OEE match the one-line test from raw counts?
Test. Recalculate one shift, one week and the whole plant from good units, ideal times and planned minutes. Compare each with the report.
- Plant OEE is a plain average of line OEEs
- Line OEE is an average of its machines
- Weekly OEE is an average of daily percentages
- The three factors do not multiply to the total
A line is only as fast as its slowest machine. Measure line OEE there, and weight every average by planned time.
The record
Guards the restAsk. Who enters each number, when, and can it be changed afterwards?
Test. Pick one shift. Trace every figure in its OEE back to where it came from: a sensor, a counter, or a person with a pen.
- Figures entered by the people judged on them
- No log of what was changed, or by whom
- Definitions differ between lines or sites
- A bonus depends on a self-reported number
This check has no point value. It decides whether the other five stay fixed.
A simple way to read your result. The bands are a guide, not a standard.
After the Audit: Reset Without Blame
The number will fall. Production has not got worse. Measurement has got better.
How the first honest figure is received decides whether people keep reporting honestly. Treat the fall as a discovery of capacity, not as a failure, and protect the people who found it. Then make the six checks pass automatically, so nobody has to choose between a true number and a good one. Our integration team can confirm what your lines already provide.
Write the rules on one page
Planned time, full speed for each product, what counts as a stop, what counts as good.
Run old and new side by side
For a month, show both figures, so everyone sees why they differ.
Reset the targets
Measure improvement from the new baseline, not against the old number.
Take people out of the counting
Counts and stops from sensors; people add the reason, not the number.
How iFactory passes the six checks
- Clock. Every scheduled minute is kept, with each exclusion shown and named.
- Speed. A standard for each product, checked against the best hours actually run.
- Stops. Taken from line signals, down to a few seconds.
- Count. Good product counted at the end of the line, with rework and holds apart.
- Sums. Worked from raw counts, weighted by planned time.
- Record. Every figure traced to its source, with changes logged.
Turnkey AI: Delivered, Connected and Live in 6–12 Weeks
You do not build this. It arrives ready.
iFactory ships as a pre-configured NVIDIA AI server, racked and ready, with the software pre-loaded. Rack it, plug in power and Ethernet, and the AI is live on your network.
Our team handles cabling, network setup, PLC and SCADA integration, operator training and 24×7 remote monitoring. The server sits inside your own network, so production data stays on site. For a scope matched to your lines, request a turnkey quote.
Ship, network and data
Server installed. Counters, line states and schedules connected for one line. The one-page OEE rules agreed with your team.
Model training and pilot
Automatic OEE run beside the existing report. Each difference traced to one of the six checks and explained.
Go-live and training
The measured figure becomes the reported one. Operators and managers trained, shift by shift. 24×7 remote monitoring begins.
Frequently Asked Questions
What is an OEE measurement audit?
A check of how the OEE figure is produced, not of how the line performs. It looks at what is counted as planned time, what is used as full speed, whether stops and good product are captured properly, how the sums are done, and who controls the record. It takes a few hours for one line.
How far out can OEE really be?
Published accounts put the gap between reported and measured OEE at roughly 10 to 25 points. Those figures come from vendors and practitioners, not from independent studies, so treat them as a range of experience. The only gap that matters is your own, and the six checks will show it.
Should cleaning and changeovers count against OEE?
Changeovers do, in the standard definition. Cleaning is a policy choice, and food plants differ. The honest approach is to state the choice on the report, apply it the same way everywhere, and keep the time visible in a second figure. Hidden time cannot be improved.
Why is performance over 100% a warning sign?
Because nothing can run faster than its true top speed. If a line beats 100%, the speed standard is too low, usually a budget rate or an old average. Every shift measured against that standard looks better than it was, including the bad ones.
What is wrong with averaging OEE?
A plain average treats a small line and a large one as equal, and a short shift like a long one. Weight each figure by its planned time. For a single line, do not average its machines at all: measure OEE at the slowest one, since that is what sets the line's output.
Will our OEE fall after the audit?
Usually, yes, and that is the point. Plants that move to automatic capture commonly see the displayed figure fall within the first week or two. Nothing got worse on the floor. Explain that clearly, reset the targets from the new baseline, and judge progress from there.
How long does it take to go live?
Six to twelve weeks from delivery for a first line. We need a place for the server with power and Ethernet, read access to counters and line signals, and your current OEE rules and reports. To check your set-up first, contact our team.
Bring One Line and Last Week's OEE Report
In thirty minutes we run the one-line test and the first two checks on your own figures. You will know whether your OEE is close, or whether it needs a proper look. You keep the working either way.
- 1Last week's OEE report for one line
- 2The schedule for that week, with planned stops
- 3Standard speeds for your main products
- 4The downtime log for one shift
- 5Filler, checkweigher and warehouse counts