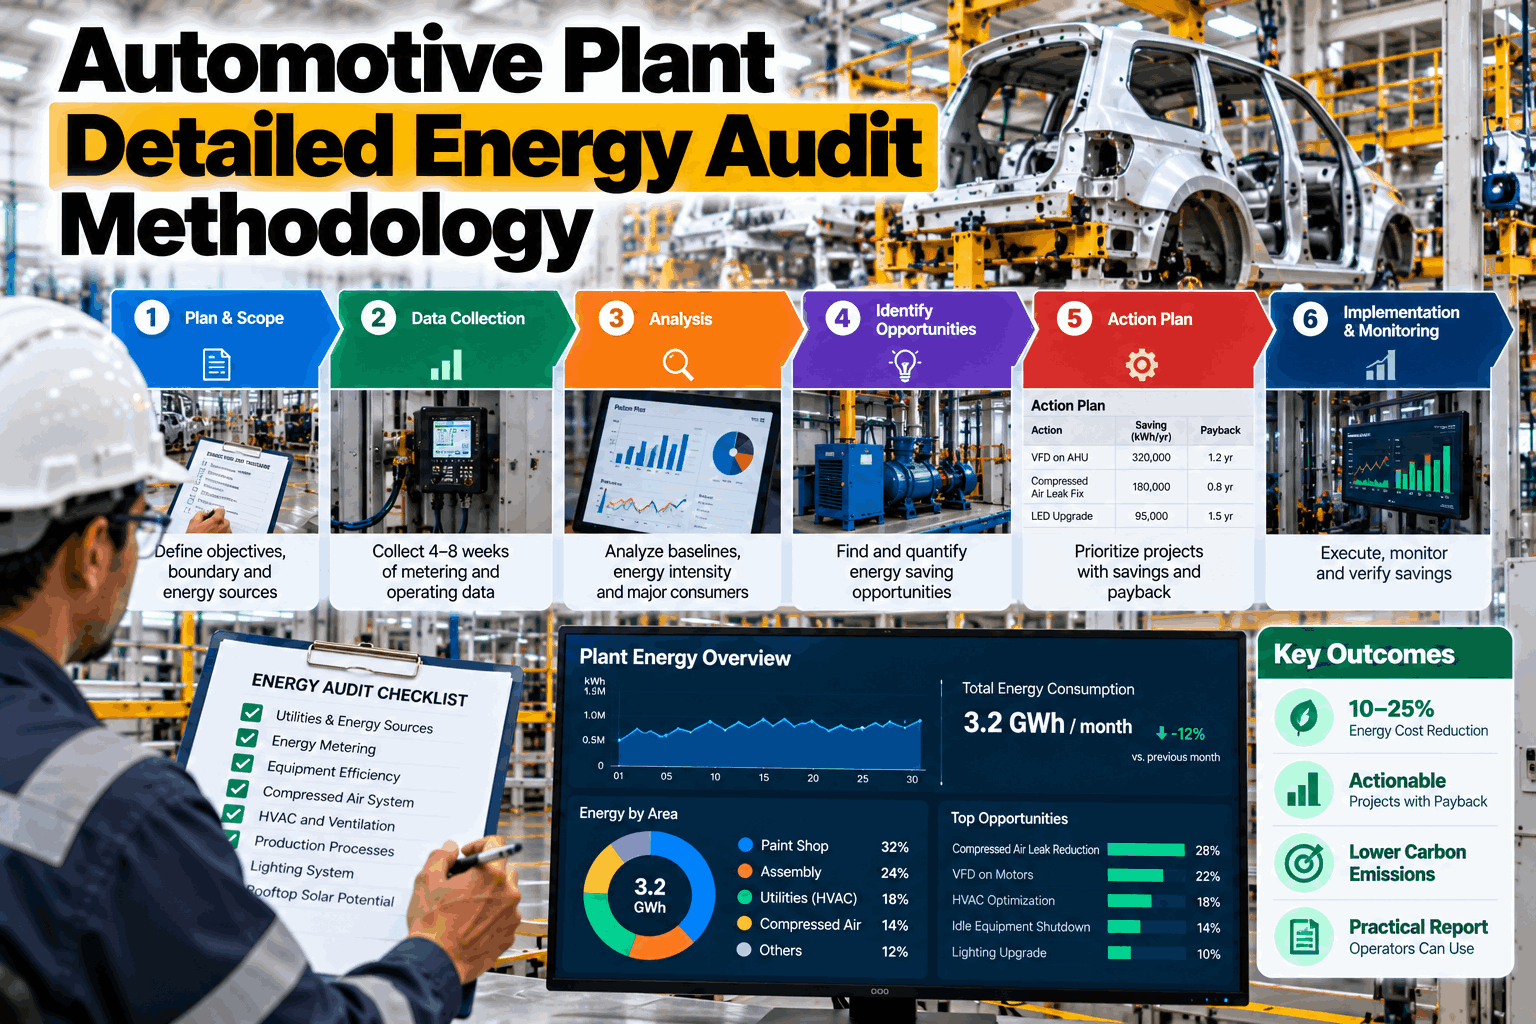
Most automotive plants have an energy audit report somewhere. Far fewer have a saving that came out of it. The report arrives as a few hundred pages of findings, the consultant leaves, and the people who run the paint shop, the compressors and the chillers never see which three changes matter. A detailed energy audit only earns its fee when it ends in an action plan that operators can run. This guide sets out a detailed energy audit methodology for automotive plants: how to scope it, build a baseline, measure loads, reconcile them to the meter, test changes with what-if models and hand over a ranked action register with owners and dates. To see how it looks on your own meter data, book an energy audit walkthrough.
Automotive Plant Detailed Energy Audit Methodology
A practical methodology for operations and energy teams: how to run a detailed energy audit across paint, press, body, utilities and compressed air, and how to turn the findings into an action plan that does not end up in a drawer.
- The audit steps from scope and baseline to action register
- Where automotive plants use energy and how to measure each area
- How to rank findings, test them and verify the savings
Four findings hold more than four fifths of the saving, and the dashed line marks where the cumulative share passes 80%. Idle shutdown means switching off or turning down booth air, compressors and HVAC when no vehicles are being built, and standby loads are weld and press equipment left energized between shifts. A good audit report points at findings like these, not just at a long list.
What a Detailed Energy Audit Really Is
A detailed audit measures where energy goes, then ranks what to do about it.
A walk-through audit spots obvious waste. A detailed energy audit goes further: it builds a baseline from meter and bill data, inventories the loads, measures them over representative periods, reconciles the result to the metered total and costs each opportunity with a saving and a payback. ISO 50002 sets out requirements for energy audits, and ASHRAE describes audit levels from walk-through to investment grade. Where your plant is a designated consumer under India's Energy Conservation Act, BEE rules on audits by accredited energy auditors also apply, so confirm the current requirements for your site. Our energy analytics team can show how this fits with your own audit plan.
Draw the boundary
Which plants, systems, energy carriers and production period are in.
Baseline and loads
Meter data, short-term measurement and a load inventory by system.
Balance and rank
Measured loads reconciled to the meter, with each loss costed.
Register and verify
Owners, dates and a check of every saving against the baseline.
Each finding needs an owner, a cost, a saving, a payback, a date and a way to verify it. A report that explains the physics but names no owner will be read once and filed.
The Audit Methodology Step by Step
Seven steps take you from scope to a register operators can run.
The order matters. Measure before you recommend, reconcile before you rank and assign owners before you hand over. Each step produces something the next one needs, so skipping one leaves a gap in the final plan. To see how this applies to your plant, book an audit planning session.
Measured loads should add up to the metered total within a margin you state up front. An unexplained remainder is not a failure of the audit. It is a finding, and often points to a load nobody knew was running.
Where Automotive Plants Use Energy
Each area uses energy in its own way, so each is measured in its own way.
An automotive plant combines heavy process loads with large shared utilities. The audit has to cover both and show how they interact, because a change in the paint shop moves load onto the chillers and the boilers behind it.
Booth air, compressors and building HVAC often run through weekends and planned shutdowns at close to production load. Measure the base load while the line is off, because it is usually the cheapest saving to capture.
Set the Baseline Before You Hunt for Savings
A saving is only real if it is measured against an agreed baseline.
Two audits of the same plant can report different savings because they normalise differently. Agree the measures once, write them down and use them for every finding, so the numbers still hold when someone checks them a year later.
Energy per vehicle rises when volume falls because base load is spread over fewer cars. Compare like with like, using volume, mix and weather, or every slow month will look like an efficiency problem.
What the Audit Is Worth When It Reaches the Floor
An audit that ends in a drawer saves nothing. The same findings, turned into an action register with owners and dates, start paying back as soon as the first change is made and verified.
From Audit Finding to Operator Action
A finding only matters once it has an owner and a way to be checked.
The audit tells you what to change. The action register tells people who changes it, by when and how the saving will be proved. The test of a good audit is how many findings are still moving a year later.
Measure
Baseline and load data by area.
Rank
Findings by saving and payback.
Test
What-if on setpoints and schedules.
Approve
Owners, budget and dates agreed.
Implement
Changes made on the plant.
Verify
Savings checked against the baseline.
Common Energy Audit Mistakes
Most audits fail after the site visit, not during it.
The engineering is usually sound. What goes wrong is the handover, the baseline and the risk to production quality. A few simple rules keep the audit useful.
Good practice
- Reconcile measured loads to the meter total
- Rank findings by saving and payback
- Give every finding an owner and a date
Common mistakes
- Delivering a report with no owners
- Counting savings with no agreed baseline
- Recommending changes that put paint quality at risk
Put the action register in front of the people who run the plant, with a review meeting on the calendar. A finding nobody is asked about next month will not be done.
How iFactory Energy Analytics Supports the Audit
Continuous data in, a living action register out.
iFactory collects data from your energy meters, submeters, PLC, SCADA and building systems, and builds the baseline and energy per vehicle by area, shift and model. It gives auditors continuous load data instead of short snapshots, runs what-if tests on setpoints and schedules within your quality limits, and tracks each saving against the baseline after the audit ends. It runs on an on-prem server inside your network, with one view across all plants. It does not replace an accredited energy auditor where one is required. Questions on fit go to our support desk.
All energy signals
Meters, submeters, PLC, SCADA and building system data.
Energy per vehicle
Normalised for volume, mix and weather, by area and shift.
Test before changing
Setpoint and schedule changes checked against your process limits.
Savings and actions
Each finding tracked against the baseline, with owners and dates.
Savings depend on your plant, your tariffs and how quickly findings are acted on. We measure the baseline and the effect of each change on your own data during the pilot, rather than promising a general figure.
Turnkey AI: Delivered, Connected and Live in 6–12 Weeks
You do not build this. It arrives ready.
iFactory ships as a pre-configured NVIDIA AI server with the software pre-loaded. Rack it, plug in power and Ethernet, and the AI is live on your network. Our team handles cabling, network setup, PLC and SCADA integration, team training and 24×7 remote monitoring. Data stays on your own network. For a scope matched to your plant, request a turnkey quote.
Ship, network and meter data
Server installed. Meter, submeter and utility data connected for the pilot area.
Baselines and energy balance
Baselines agreed. Energy balance checked and what-if models validated with your teams.
Go-live and action register
Dashboards and the action register live. Teams trained. 24×7 remote monitoring begins.
Frequently Asked Questions
What is a detailed energy audit?
It is an audit that measures energy use by system, reconciles it to the metered total and costs each saving opportunity with a payback. It goes well beyond a walk-through, which spots obvious waste without measuring it.
Which standards and rules apply?
ISO 50002 sets requirements for energy audits, and ASHRAE describes audit levels. In India, BEE rules apply to designated consumers and call for audits by accredited energy auditors. Rules change, so confirm the current requirements for your site.
How long does a detailed audit take?
It depends on plant size and scope. Plan for several weeks of data collection and measurement before analysis starts, and longer for a multi-plant scope. Continuous metering shortens the measurement step.
How do we stop the report ending in a drawer?
Make the action register the main deliverable. Give each finding an owner, a cost, a saving, a date and a verification method, and schedule a regular review with the people who run the plant.
Can we cut paint shop energy without hurting quality?
Often there is room, but it must stay inside the limits in your paint process specification. Test each change with a what-if model, get approval from paint process engineering and verify the effect on quality as well as on energy.
How do we start?
With one area that uses a lot of energy, usually the paint shop or compressed air. A 6-week pilot connects the meter data, builds the baseline and shows the first ranked findings. To plan it, contact our team.
Turn Your Next Energy Audit Into an Action Plan
In thirty minutes we look at your meter data, your utility layout and how audit findings are followed up today. You keep the notes whether or not you go further with iFactory.
- 1Twelve months of utility bills and meter data
- 2Single-line and utility layout diagrams
- 3Production volumes by month and model
- 4A list of the major loads and their hours
- 5Any previous audit report and its actions