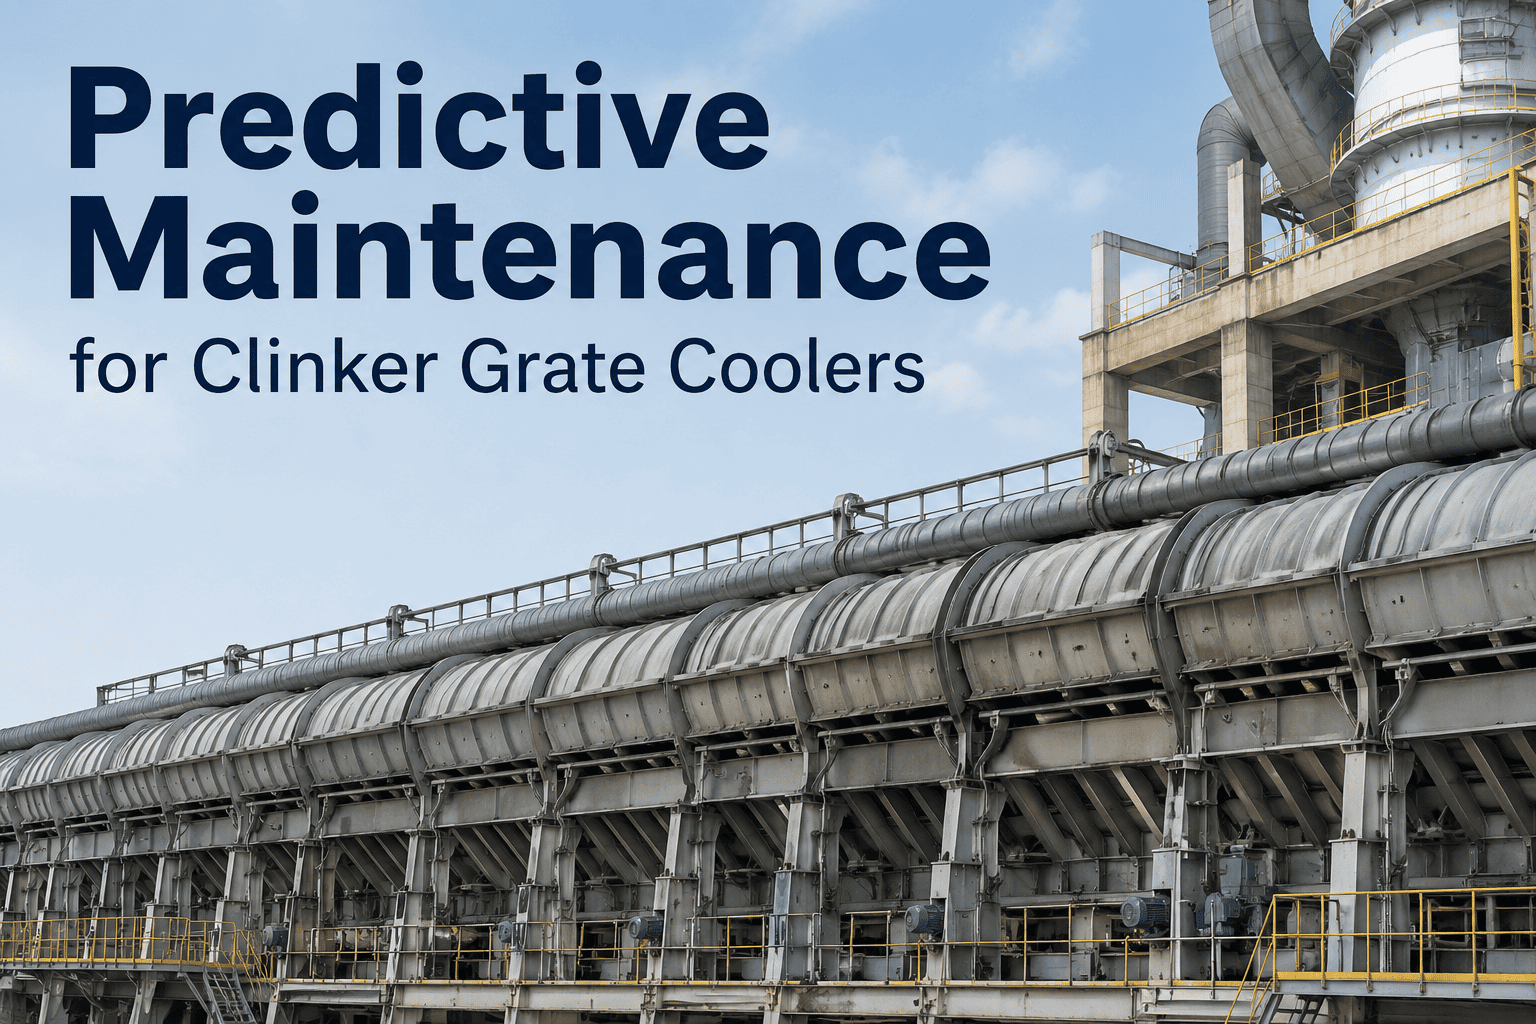
The grate cooler is the only asset in a cement plant that is simultaneously a conveyor, a heat exchanger, a quench vessel, and a quality control device — and it is judged almost entirely on whether clinker comes out cold enough. That framing is exactly why cooler problems get discovered late. A plate can wear from full thickness down to breakthrough while the discharge temperature stays acceptable, because adjacent plates quietly absorb the extra duty until they cannot. The signals that lead the failure sit in undergrate pressure, drive current, and secondary air trend, and you can book a demo to see them tracked against your own cooler.
One Cooler, Three Completely Different Wear Environments
Clinker arrives from the kiln at roughly 1,200 to 1,400 degrees Celsius and must leave the cooler cool enough to handle, while the air that passes through it becomes the secondary and tertiary air feeding the kiln and calciner at somewhere between 800 and 1,100 degrees. Around 35 to 40 percent of pyroprocessing heat passes through this vessel, and up to 30 percent of the kiln's thermal energy is returned through those recovered air streams. That dual duty is why the cooler is never just a maintenance asset — every mechanical decision made here shows up on the fuel bill and in the clinker chemistry.
The critical operational point is that wear is not distributed evenly. The inlet zone sees temperatures above 1,000 degrees and the most abrasive contact with freshly discharged clinker, and it wears roughly three to four times faster than the cold end. A maintenance programme that applies one inspection interval across the whole grate simultaneously over-maintains the discharge zone and under-maintains the recuperation zone — which is precisely the zone whose failure costs the most, because it is the zone that produces secondary air.
There is a quality dimension that maintenance teams sometimes discover second-hand, through a complaint from the grinding department. Rapid quenching in the recuperation zone is what freezes the alite crystal structure in place. When cooling slows because air distribution has degraded, the transformation toward belite and free lime becomes possible, early strength development suffers, and grinding energy rises. Grate plate wear is therefore not only a reliability problem and a fuel problem — it is a product quality problem that surfaces downstream of the department that owns the asset.
Cooler Failures Almost Never Stay Isolated
What makes the cooler dangerous as a reliability asset is that its failure modes compound. A single air distribution upset can trigger a feed rate cut, which changes kiln thermal conditions, which alters the clinker entering the cooler, which affects air distribution again. Manual recovery from that loop takes time, and the conservative settings operators adopt during recovery often persist for hours or shifts beyond the original upset. The chain below is the sequence most plants recognise immediately, and the important observation is that intervention gets harder and more expensive at every step to the right.
The most instructive detail in documented cases is where the failure was actually missed. In one widely reported incident at a US plant, post-event analysis found that worn plates had been completely obscured by clinker buildup during manual inspections — the wear was there to be seen, and the inspection method physically could not see it. That is not an inspection discipline failure. It is a limitation of visual inspection as a method, and it is the strongest single argument for trend-based detection running alongside the walkdown rather than instead of it.
Snowman formation adds a second entry point into the same cascade. A build-up at the cooler inlet restricts clinker flow and creates uneven bed depth directly, without any plate wear involved at all, and from there the sequence proceeds identically through channeling to red river conditions. Coating fragments breaking away from the kiln outlet can surge into the cooler and overload the bed in the same way. A monitoring approach built only around plate wear will miss both, which is why bed depth and inlet condition belong in the same model as mechanical wear.
Four Signals and How Much Lead Time Each One Buys
Predictive value in a cooler is measured in whether the warning arrives before the next planned stop, not in whether the model is clever. Kiln shutdowns typically fall every four to eight weeks depending on the line, so a signal that gives three weeks of notice is genuinely actionable while one that gives three days is not. The chart below places each monitored signal on a shared timeline, showing the window within which developing failure is normally detectable ahead of the event itself.
The signal that deserves the most attention is undergrate pressure, because it is the earliest indicator of plate condition and the one most plants already measure without fully using. A chamber whose pressure deviates more than 15 percent from its own baseline within a single shift is telling you something specific about airflow resistance in that chamber, and the interpretation is unambiguous when read against the drive current and the bed thermal profile at the same moment. Read in isolation on a trend screen, the same deviation looks like ordinary process noise, which is exactly how it gets dismissed.
Fan monitoring carries the second-largest share of value, and for a blunt reason: fan failure accounts for the largest share of cooler-related kiln interruptions. Undergrate fans operate in a high-temperature, dusty environment where bearing mean time between failures typically averages fourteen to twenty-two months under unmonitored conditions, and a single fan trip can force a cooler throughput reduction of 15 to 30 percent, which drops kiln feed rate and cascades into downstream quality deviation. Vibration and current monitoring reliably catches bearing and impeller issues weeks ahead of that outcome.
Condition-Based Intervals Instead of One Calendar for the Whole Grate
Once wear rate is understood as zone-dependent, the maintenance programme has to become zone-dependent too. The table below sets out the working structure most plants converge on: continuous monitoring of the signals that lead the failure, shift and weekly checks tied to observation, and thickness measurement at every kiln stop against explicit replacement thresholds. The thresholds matter as much as the intervals — a plate below 6 mm working-face thickness or with slot widening beyond 2 mm from OEM specification should not be left in service to the next campaign. Book a demo to see this structured against your cooler layout.
| Activity | Frequency | Criticality | What It Prevents |
|---|---|---|---|
| Chamber pressure differential trending | Continuous | Critical | Blocked aeration slots cutting cooling efficiency by 5 to 15 percent |
| Bed depth and red river observation | Every shift | Critical | Channeling establishing itself before the next trend review |
| Chamber-by-chamber wear mapping | Weekly | High | Degradation trends staying invisible between shutdowns |
| Cooling fan vibration and bearing temperature | Weekly to monthly | High | Unbalanced impeller driving bearing failure and fan trip |
| Hydraulic drive pressure and flow check | Monthly | High | Drive failure halting clinker transport and stopping the kiln |
| Ultrasonic plate thickness survey | Every shutdown | Critical | Plates below 6 mm or with slots widened past 2 mm staying in service |
| Sidewall castable and bullnose refractory check | Every shutdown | High | Refractory failure exposing steel casing to clinker temperature |
| Thermocouple calibration across all zones | Semi-annual | Medium | Drifted readings driving incorrect fan control and poor heat recovery |
The last row is quietly one of the most important and the most neglected. Every automated fan control decision and every heat recovery calculation depends on thermocouples that live in an environment actively hostile to measurement accuracy. A drifted thermocouple does not announce itself — it simply causes the control system to make confidently wrong decisions, and it corrupts the very baseline that a wear model learns from. Calibration discipline is a precondition for predictive monitoring, not a competing priority.
What Every Degree of Lost Secondary Air Temperature Costs
The financial case for cooler condition monitoring is unusually clean because the physics converts directly into fuel. Industry benchmarks put the relationship at roughly 0.07 to 0.10 percent of kiln fuel cost per degree Celsius of secondary air temperature lost, which is commonly rounded to about 0.8 percent for every 10 degrees of recovery given up. That figure is why a cooler in slow decline is expensive long before it is broken — the loss accrues every operating hour and appears in the fuel account rather than the maintenance account, which is exactly where nobody is looking for it.
Set against this, grate plate failure raises specific heat consumption by an estimated 5 to 15 percent, and blocked aeration slots alone can cut cooling efficiency by a similar margin. Meanwhile leading producers are achieving recuperation efficiencies above 75 percent, and global average thermal energy intensity for clinker production sits around 3.6 gigajoules per tonne. The distance between an average cooler and a well-run one is not exotic technology — it is whether the condition of the grate and the balance of the fan array are known continuously or discovered at the next stop.
Every Fan Judged Against Its Own Design Curve, Not the Array Average
Cooler fans degrade for four distinct reasons — blade wear, damper mechanism deterioration, belt slippage, and motor bearing degradation — and each produces a different signature in motor power, airflow, and differential pressure. Tracking real-time efficiency against the design curve, and against the historical performance of identical fans in the array, surfaces deviations as small as 2 to 3 percent. That resolution matters because the operational response differs completely: a damper drift is corrected in an afternoon, while a developing bearing needs a scheduled outage and a spare.
There is a direct energy return alongside the reliability benefit. Optimising damper positioning to balance airflow across the grate while minimising total fan electrical power typically produces a 10 to 18 percent reduction in cooler fan power consumption, which is meaningful given that the cooler fan array is one of the larger electrical loads in the pyroprocessing line. The same monitoring that prevents an unplanned trip therefore pays a continuous dividend in electrical cost even when nothing is failing.
Balance discipline is worth one specific note. Dynamic balancing to ISO 1940 grade G2.5 is the standard reference, and the sensitivity is higher than most teams assume — an imbalance of around 10 grams at 1,500 rpm has been estimated to shorten bearing life by roughly 35 percent while pushing vibration toward alarm territory. That relationship means quarterly impeller inspection with balancing is not a routine formality; it is one of the highest-leverage interventions available on the entire fan array.