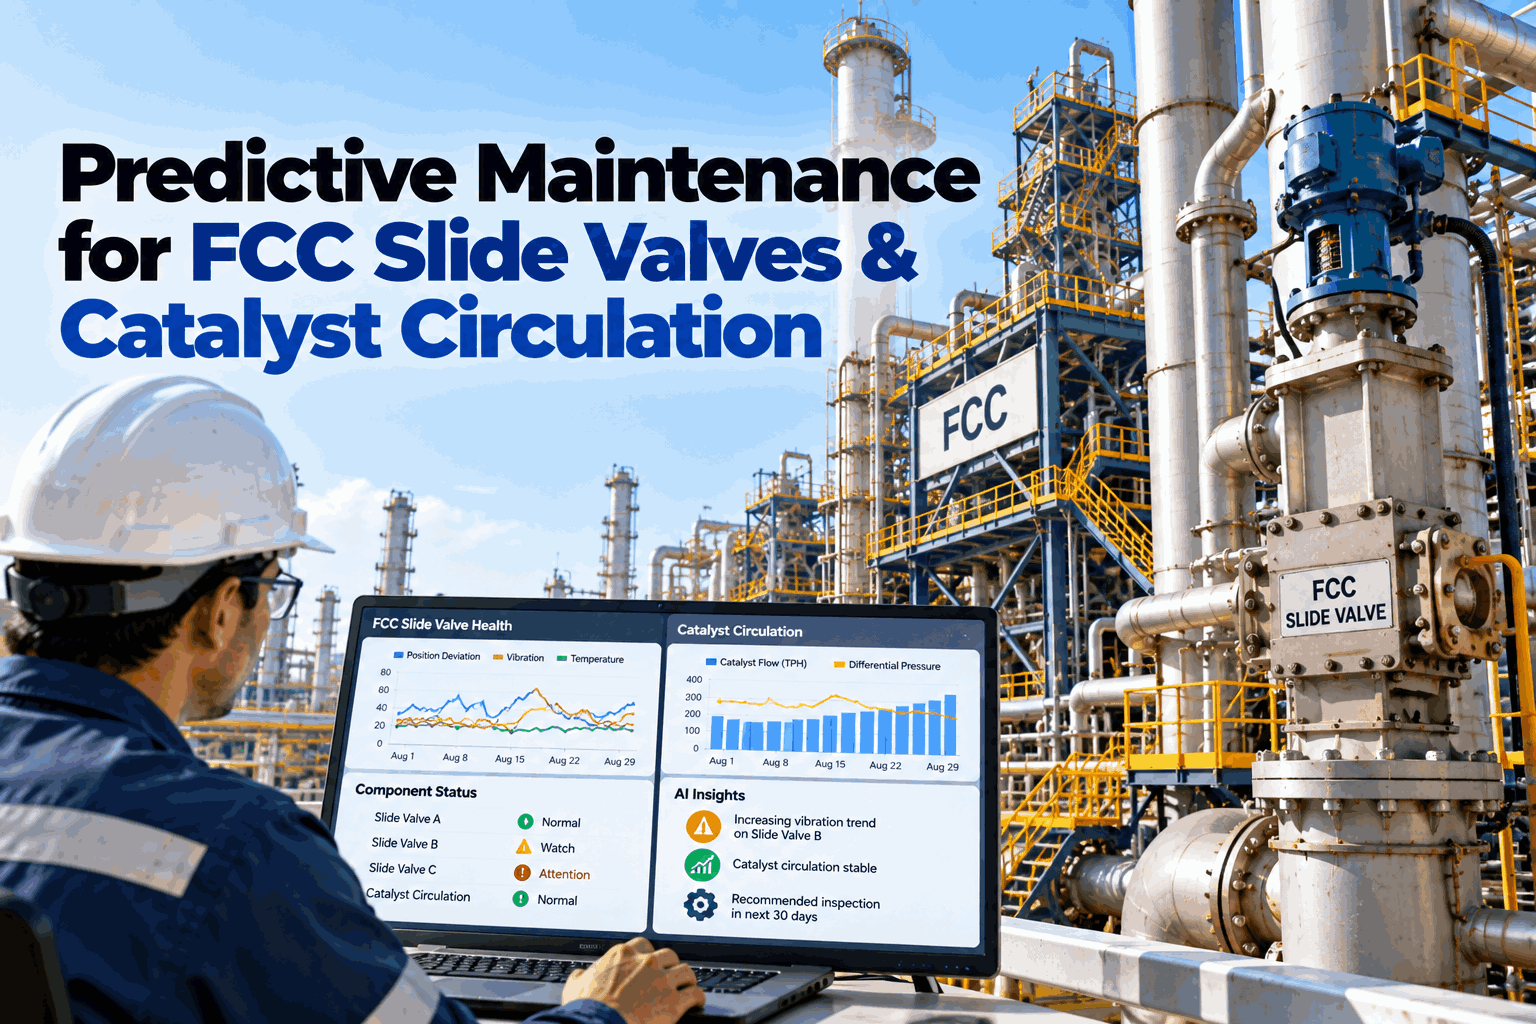
The FCC is the highest-margin conversion unit in most refineries, and it's also one of the least forgiving to run blind: an unplanned shutdown can cost as much as $1 million a day including restart, and a severe cyclone or circulation failure that forces a multi-week outage has run $25-30 million at a medium-sized unit. The equipment at the center of that risk — the regenerated and spent catalyst slide valves — are designed to hold a 5-6 psi differential and are considered to be running with no margin left once that falls to around 3 psi. A 2018 U.S. Chemical Safety Board investigation into a refinery explosion found that a worn spent-catalyst slide valve may have allowed catalyst and hydrocarbons to migrate where they shouldn't have, and that the unit's instrumentation wasn't configured to catch the negative differential pressure condition that preceded it. iFactory's Predictive Maintenance + Process AI is built to catch exactly that kind of drift — slide-valve wear, standpipe circulation instability, and cyclone erosion — months before it becomes an emergency.
iFactory Predictive Maintenance + Process AI
Catch Slide-Valve Wear and Catalyst Circulation Instability Before the FCC Unit Does
Live slide-valve differential pressure, standpipe density, and circulation-rate monitoring to protect the highest-margin unit in the refinery.
$1M/day
worst-case unplanned FCC shutdown cost
5-6 psi
design slide-valve differential pressure
100+ t/min
catalyst circulation, larger units
$25-30M
cost of a circulation-driven outage*
The FCC Reliability Cockpit — What Every Component Should Say
Live reliability visibility means every slide valve, standpipe, and cyclone reporting its own health margin, not just a unit-wide alarm summary. This is what that view looks like on an FCC right now.
Regenerated Catalyst SV
Reactor temperature control
On target
Differential pressure5.4 psiwithin 5-6 psi design
Wear trendStableno drift
Purge flowNormalon target
Reactor temp controlStableon setpoint
Spent Catalyst SV
Reactor/regenerator seal
Wear trend
Differential pressure3.2 psiapproaching 3 psi minimum
Wear trend-0.4 psi/modeclining
Purge flowLowflagged
Seal integrityMonitornext window
Standpipe Circulation
Regenerated catalyst
Stable
Density profileNormalwell-aerated
Circulation rate98 t/minon target
Aeration point ΔPNormalno bridging risk
Stick-slip riskLowmonitored live
Regenerator Cyclones
Catalyst separation
Erosion flagged
Catalyst losses+18%vs baseline
Dipleg pressure dropElevatedflagged
Est. remaining life<6 momodeled
Outage risk if unaddressed$25-30Mrange
Slide-Valve Differential Pressure — Where the Margin for Error Actually Is
A new or well-maintained slide valve runs at the design 5-6 psi differential. As it wears, that differential erodes — slowly at first, then in a way that leaves no room for a bad day.
Design differential
5-6 psi
Full margin
Good operating margin
4-5 psi
Healthy
Reduced margin
3-4 psi
Watch closely
Minimum safe level
~3 psi
No margin left
Below minimum
<3 psi
Intervention required
*Illustrative: a slide valve declining at a fraction of a psi per month can take months to cross from "healthy" to "minimum safe level" — which is exactly the kind of slow drift that a periodic check misses and continuous trending catches early.
Where FCC Reliability Risk Actually Concentrates
The same handful of mechanisms account for nearly every unplanned FCC event — each with its own early signature, well before it becomes a trip or a turnaround surprise.
Slide valve erosion
Highest consequence
Catalyst is abrasive; valve wear is gradual until it isn't, and it's the primary reactor/regenerator barrier.
Standpipe defluidization
Circulation risk
Stick-slip flow from poor aeration can damage the standpipe or force a shutdown.
Cyclone erosion
Longest outage risk
Severe erosion has led to multi-week shutdowns in the $25-30M range at medium-sized units.
Catalyst attrition
Gradual margin loss
Fines carryover and rising catalyst makeup costs, often invisible until the budget review.
Instrumentation drift
Root cause of delay
A transmitter not configured for the right failure mode is how early warnings get missed.
Want to see where your own FCC's margin is actually sitting? Book a demo — bring 90 days of DCS data for the slide valves and standpipe.
Reactive Troubleshooting vs Predictive Monitoring — Same FCC Unit, Two Outcomes
Both approaches are trying to answer the same question: is the unit's catalyst circulation barrier still intact? One answers it during the next planned check. The other answers it continuously.
Reactive Troubleshooting
"Did we catch the slide valve wearing before it leaked?"
Differential pressure checked periodically, not trended continuously
Wear discovered during the next planned turnaround, or after an upset
Standpipe circulation issues show up as a process trip, not a trend
Root cause investigation starts after the shutdown, not before
Predictive Monitoring
"Did we catch the slide valve wearing before it leaked?"
Differential pressure and purge flow trended continuously against design and minimum-safe limits
Wear flagged months before it reaches minimum safe differential
Standpipe density and circulation rate monitored for early stick-slip signals
Root cause flagged while the fix is still a planned action, not an emergency
How Predictive Maintenance for the FCC Gets Built
The goal is turning a slow mechanical drift into a scheduled work order, long before it turns into an unplanned event.
01
Ingest Live Process & Mechanical Data
Slide-valve ΔP, purge flow, standpipe density, and cyclone performance pulled live from the DCS.
02
Compute Health Margin
Continuous comparison against design differential, minimum-safe limits, and the unit's own historical baseline.
03
Detect Early Drift Signatures
Catalyst attrition, cyclone erosion, and circulation instability flagged from their earliest process signatures.
04
Rank by Consequence
Findings ranked by safety consequence and dollar impact — slide-valve integrity first, margin optimization second.
05
Route to the Turnaround Plan
Flagged issues routed into the next planned maintenance window before they become an emergency one.
What Predictive FCC Monitoring Delivers
These are the outcomes refineries typically see after moving from periodic checks to continuous slide-valve and circulation monitoring.
Months
Earlier warning
on slide-valve wear trend
$1M/day
Unplanned-outage risk
protected against
Live
ΔP & circulation
tracked against design limits
Ranked
By consequence
safety first, then dollar impact
Curious how much margin is left on your own slide valves? Talk to our team — we'll benchmark your unit's ΔP trend against design.
Frequently Asked Questions
How is this different from iFactory's FCC yield/margin optimization product?
iFactory's FCC process-optimization analytics focuses on yield — conversion, severity, and product slate, the $0.10-0.50/bbl margin-improvement side of the unit. This product focuses on mechanical integrity and reliability — slide valves, standpipe circulation, and cyclones, the side of the unit that determines whether you keep running at all. Many refineries run both: optimization protects the margin on good days, this protects the unit from the bad one.
What data do you need from our DCS to monitor slide valves and standpipes?
Slide-valve differential pressure and position, purge flow rates, standpipe density or level instrumentation, and regenerator cyclone differential pressure, typically at the same scan rate your DCS already historizes them. Ninety days of history is enough for a first-pass baseline; longer history improves confidence in the wear-rate trend.
Does this replace our existing safety instrumented system?
No. Your SIS and process safety systems stay exactly as configured — this platform is a predictive layer on top, built to flag slow mechanical and process drift long before it reaches the thresholds a safety system is designed to act on. The goal is to act earlier than a safety trip, not to replace what the trip protects against.
How early can slide-valve wear actually be detected?
Differential pressure typically declines gradually over months as a valve wears, rather than failing suddenly — which is exactly the window continuous trending is built to catch. A valve trending from design differential toward the minimum-safe level can usually be flagged with enough lead time to schedule the repair into a planned maintenance window rather than an emergency shutdown.
How long does it take to get live FCC reliability monitoring running?
Typically 6-10 weeks from kickoff to a live cockpit covering the main slide valves, standpipe, and cyclones, depending on historian access and how much of the required instrumentation is already in place. Bring 90 days of DCS data and we'll show you where your unit's current margin sits before you commit to anything.
Protect the highest-margin unit in the refinery.
Get Predictive Visibility Into Your FCC's Slide Valves and Catalyst Circulation
Bring 90 days of DCS data for slide-valve differential pressure, purge flow, and standpipe density. We'll show where your unit's current margin sits and what an early warning would be worth against a $1M/day shutdown risk.