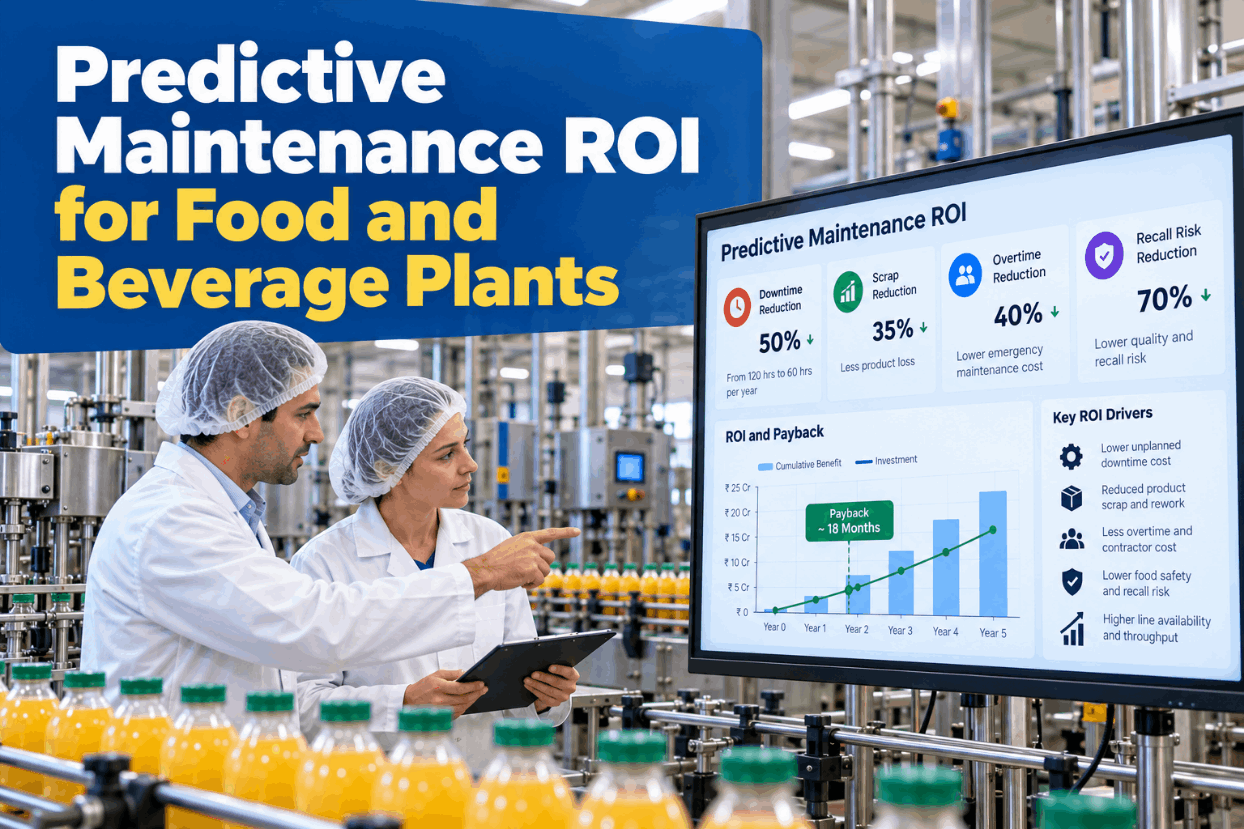
Predictive Maintenance ROI for Food and Beverage Plants

By Josh Brook on October 28, 2026

predictive-maintenance-roi-food-beverage-plants

Most predictive maintenance proposals in food plants stall on one question from finance: what is an hour of this line actually worth? Industry averages can't answer that for your filler or your oven, and finance knows it. Build the number from your own line instead: lost margin, idle crew, repair overtime and the product thrown away when a line stops mid-run. This guide works through that method line by line, with every input assumed, and you can test it on your own figures in a payback walkthrough.

ROI MODEL · TURNKEY QUOTE

Predictive Maintenance Payback, Priced One Food Line at a Time

iFactory's ROI Model takes your line downtime cost, failure history and product loss and returns payback for a turnkey AI server deployment with 12-week delivery. Each assumption sits in its own box, ready to be challenged.

Payback calculator · Line 3Illustration
Downtime cost per hour$4,800assumed
Unplanned hours per year120 hassumed
Share avoidable35%assumed
Annual cost, year 1$160,000assumed
Payback9.5months
Year-1 cost $160,000Year-1 benefit $201,600
$4,800 × 120 h × 35% = $201,600 a year
DOWNTIME COST PER HOUR

Four Costs Inside One Lost Hour

A food line's hourly downtime cost is not its revenue per hour. Use contribution margin for output you can't make up, and add the costs the stop itself causes. Siemens' 2024 True Cost of Downtime report put an hour of downtime in fast-moving consumer goods at about $36,000, but that is an average across large companies, not your line. Price your own hour with our support team.

01
Lost marginCases per hour × contribution margin per case, only for output you can't recover later
02
Idle crewOperators paid while the line waits, at the fully loaded hourly rate
03
Repair overtimeCall-outs and extra shifts. In the US, hours over 40 a week are paid at 1.5 times the regular rate under the FLSA
04
Product lossOpen product discarded or held per stop, divided by the average stop length
Lost margin or overtime, not both

If lost cases are made up on a weekend shift, the cost of that hour is the overtime to recover it, not the margin. If the line already runs flat out, the margin is gone. Pick one per line and write down why.

PRODUCT LOSS WHEN A LINE STOPS MID-RUN

The Longer the Stop, the More Product Goes on Hold

When a food line stops mid-run, product is caught in mixers, hoppers, fryers, proofers and filler bowls. Your food safety plan decides what happens to it. Under FDA's preventive controls rule, corrective actions include evaluating affected food for safety and keeping it out of commerce if safety can't be assured. For low-acid canned foods, 21 CFR 113.89 requires product from a process deviation to be reprocessed or set aside for a processing authority to evaluate. The bands below are illustrative. Map your own limits in a line review.

Short stop
Product waits in placeRestart within your plan's time and temperature limits. Loss is mostly start-up scrap.
Medium stop
Product placed on holdLimits approach or pass. QA evaluates the held product before release, rework or disposal.
Long stop
Open product discardedProduct in process is lost, and the line may need a full clean before restart.
PDM BUSINESS CASE FOOD

What Drives the Hourly Cost on Six Common Lines

Two lines with the same output can have very different downtime costs. What sits in the line when it stops, and what it takes to restart, often matters as much as lost cases. Use this overview to decide which line to price first, then check it with our support team.

Line type
Failures PdM can often see early
Cost beyond lost output
Product at risk mid-run
Aseptic or hot-fill beverage
Filler drives, capper heads, product pumps
Re-sterilisation or re-sanitation before restart
Surge tank and filler bowl
Dairy HTST pasteuriser
Timing pump, homogeniser, booster pump
Diverted flow and a possible re-CIP
Balance tank and holding tube
Fryer snack line
Fryer conveyor, oil pump, burner fans
Restart scrap while oil and product settle
Product in fryer and on belts
Bakery oven line
Oven conveyor drive, proofer fans
Dough upstream keeps proofing and can't wait
Dough in divider and proofer
Retort canning
Seamer, steam valves, vent valves
Deviation review by a processing authority
Filled cans waiting or mid-cycle
End-of-line packing
Case packer, palletiser, stretch wrapper
Often small if upstream can accumulate
Packed product only
Price the line, not the plant

A plant-wide cost per hour averages a bottleneck filler with a packing line that has buffers on both sides. The case then overstates one and understates the other. Give each line its own hourly figure, and start where stopping the line stops the whole plant.

Change One Input, See the New Payback at Once

The ROI Model reruns payback whenever an input moves, so plant and finance leaders can test the weak points of a case before it goes to sign-off, in plain words.

Line 3 case · Plant controller and iFactory
ControllerWhat if only 20% of those hours are avoidable?
iFactoryBenefit falls to $115,200 a year and payback moves from 9.5 to 16.7 months. All inputs are still assumed.
ControllerAnd if the hour is worth $3,000, not $4,800?
iFactoryAt 20%, that is $72,000 a year and 26.7 months. That corner is the one to test against your stop history first.
PREDICTIVE MAINTENANCE ROI FOOD BEVERAGE BEST PRACTICES

Count Some Benefits Now, Hold Others Back

A case that claims everything gets cut back to nothing. Put only the benefits you can trace to your own records into the payback, and list the rest as upside to be proven after go-live. Sort your benefit lines in a business case session.

IN THE BASE CASE
  • Line hours saved when a failure is caught and repaired in a planned window
  • Idle crew time on those hours
  • Emergency overtime and call-outs avoided
  • Product loss per stop avoided, from your hold and disposal records
UPSIDE, PROVE IT LATER
  • Lower parts and labour cost as reactive jobs become planned ones
  • Longer component life from repairs done before damage spreads
  • Fewer quality holds linked to equipment condition
  • Energy saved on failing motors, fans and pumps
RECALL RISK COST

Show Recall Exposure Without Guessing the Odds

Some equipment failures touch food safety: a seamer drifting out of spec, a sealing jaw losing temperature, a pasteuriser pump that can't hold flow. A recall is rare but expensive. An often-quoted joint study by the Food Marketing Institute and the Grocery Manufacturers Association put the average direct cost of a food recall at $10 million, before brand damage and lost sales. Your plant's own history can't give a reliable probability, so don't invent one. Discuss how to present it with our support team.

1
Keep it out of paybackThe base case should pay back on downtime alone
2
Name the failure modesList assets where a fault could reach a critical control point
3
Show the controlExplain how early warning supports your food safety plan, in words
PREDICTIVE MAINTENANCE ROI FOOD BEVERAGE EXAMPLES

One Line Worked Through, From Hourly Cost to Payback

This is an illustration, not a case study. Every figure is assumed, for a yoghurt cup filling line that runs near capacity, so lost cases are lost sales. Replace each line with your own data, and do it with us in a 30-minute session.

A · Cost of one lost hour
Lost margin: 1,500 cases × $2.60, assumed$3,900
Idle crew: 10 operators × $40 loaded rate, assumed$400
Repair overtime: 2 technicians × $50 × 1.5, assumed$150
Product loss: $700 per stop ÷ 2 h average stop, assumed$350
Downtime cost per hour$4,800
B · Hours and benefit
Unplanned stops: 60 a year × 2 h, assumed120 h
Share avoidable, net of planned repair time, assumed35% = 42 h
Annual benefit: 42 h × $4,800$201,600
C · Cost and payback
One-time turnkey cost, assumed$125,000
Running cost, year 1, assumed$35,000
Annual cost, year 1$160,000
Payback: $160,000 ÷ ($201,600 ÷ 12 = $16,800 a month)9.5 months

Year-1 net is $201,600 − $160,000 = $41,600. From year 2 only the running cost remains, so if the inputs hold, net benefit would be $201,600 − $35,000 = $166,600 a year.

PAYBACK PERIOD

Nine Paybacks From Two Uncertain Inputs

The two inputs most open to debate are the cost of an hour and the share of hours PdM can avoid. This grid keeps 120 hours and the $160,000 year-1 cost fixed and moves only those two. Each cell is $160,000 ÷ (monthly benefit). Build the same grid for your line with our support team.

Cost per hour ↓ · share avoidable →
20%
35%
50%
$3,000
26.7 months
15.2 months
10.7 months
$4,800
16.7 months
9.5 months · base
6.7 months
$6,500
12.3 months
7.0 months
4.9 months
Read the worst corner first

If the case still works at $3,000 an hour and 20% avoidable, it is robust. If it only works in the bottom-right corner, spend more time on stop history before asking for approval.

PREDICTIVE MAINTENANCE ROI FOOD BEVERAGE COST AND ROI

What Sits on the Cost Side of a Turnkey Deployment

Finance reviewers look for what was left out of the cost column before they read the benefits. Split one-time costs from running costs and include your own people's time. The prices come from a quote for your line, not from a list. Request yours in a scoping call.

One-timeAI server, racked and configured
One-timeSensors, gateways and washdown-rated mounts
One-timeInstallation and cabling
One-timePLC, MES and CMMS connections
One-timeModel setup, tuning and training
RunningSoftware, support and remote monitoring
RunningSensor upkeep and replacements
InternalEngineer hours for reviews and alert follow-up
PREDICTIVE MAINTENANCE ROI FOOD BEVERAGE IMPLEMENTATION GUIDE

Five Steps From Stop Log to Signed Case

A credible case takes a few weeks of data work, mostly in records you already have. Do it for one line first, then copy the method. Our support team can help pull the history together.

1Choose the lineStart where an hour costs the most, not where failures are most frequent
2Pull stop history12 to 24 months of stops from the CMMS and MES, with causes
3Tag what PdM can seeBearing, motor, pump and drive faults, not jams or material shortages
4Price the hourAgree margin, crew, overtime and product loss with finance
5Agree the checkDecide now how stops and hours will be counted after go-live
TURNKEY AI DEPLOYMENT

A Fixed Scope Behind the Cost Line

iFactory delivers predictive maintenance as a turnkey system, so the cost side of the case comes from a quote, not an estimate. A pre-configured NVIDIA AI server ships racked and ready with failure models pre-loaded. You rack it, plug in power and Ethernet, and the AI is live. Get the cost line for your case with a turnkey quote.

What's Included
  • Pre-configured NVIDIA AI server, racked and ready
  • Vibration, temperature and current sensors for chosen assets
  • Washdown-rated mounts and gateways
  • PLC, MES and CMMS connections
  • ROI Model with your downtime cost and stop history
  • Alerts that open planned work orders
  • 24×7 remote monitoring of models and hardware
Live in 6–12 weeks
Wk 1–4
Price and Install

Line cost per hour agreed, sensors and server installed, systems connected.

Wk 5–8
Learn and Baseline

Models learn normal behaviour by product and line state, stop counts baselined.

Wk 9–12
Alert and Measure

Alerts switched on, planned repairs logged, payback tracked against the case.

HOW iFACTORY FITS

Predictive Maintenance ROI Software Tied to a Real Quote

iFactory links the business case to the deployment, so the payback you approve is the payback you track. Our support team can set up the first line with you.

1
Prices the hour per line. Margin, crew, overtime and product loss, each one visible.
2
Reads your failure history. Stops from the CMMS and MES, tagged by what PdM can see.
3
Returns payback with a quote. Turnkey AI server cost and 12-week delivery behind it.
4
Tracks it after go-live. Avoided hours counted the way finance agreed.
1000+
Industrial clients running iFactory
99.9%
Platform uptime for round-the-clock lines
6-12 wks
From racked server to live failure alerts
FREQUENTLY ASKED QUESTIONS

What Plant and Finance Leaders Ask About PdM Payback

How do we work out downtime cost per hour for a food line?
Add lost contribution margin for output you can't recover, idle crew cost, repair overtime and product loss per stop spread over the average stop length. Use margin, not revenue. You can price your own line live when you book a 30-minute demo.
What share of unplanned hours can PdM avoid?
It depends on your stop causes. PdM sees wear in bearings, motors, pumps and drives. It does not prevent jams, material shortages or operator errors. Tag your own stop history by cause and use only the share that matches failures sensors can see.
Should recall risk be in the payback?
Keep it out. A single plant has too little history to give a probability. Show it as a separate exposure with the failure modes and controls listed, and let the base case pay back on downtime alone. We can show how that page reads if you see it on a live line.
Why use simple payback and not a full discounted model?
Payback in months is the figure most plant managers are asked for first, and it is easy to check by hand. If your finance team also wants discounted figures, the same inputs feed them. Our support team can add them to your case.
Does a caught failure still cost downtime?
Usually yes, but less of it. The repair moves into a planned window, ideally a sanitation stop, with parts and people ready. That is why the share avoidable is counted net of planned repair time.
How fast can we have a payback figure for our own line?
With stop history from your CMMS and MES and an agreed cost per hour, the ROI Model returns payback for a turnkey deployment in the first scoping meetings. Bring one line's data when you walk through it with our team.

Put a Price on Every Lost Hour Before You Buy

Your own downtime cost, your own stop history and a turnkey quote with 12-week delivery behind the cost line. Every input stays visible from first draft to sign-off.

Line 3 business case · all inputs assumed
Downtime cost per hour$4,800
Hours avoided per year42 of 120
Annual benefit$201,600
Payback9.5 months
Every figure traceable to a stop record

Share This Story, Choose Your Platform!