Getting approval for predictive maintenance is the easy part. The hard part comes a year later, when finance asks what the program actually saved. The reliability team says it caught twenty failures. Finance asks how anyone knows those machines would have failed, what each failure would have cost and why the maintenance budget did not fall. Without a baseline, catch log and agreed rules, the answer sounds like opinion. This guide shows how to prove predictive maintenance ROI in terms finance accepts, with conservative formulas and a full worked example. Start with a value review.
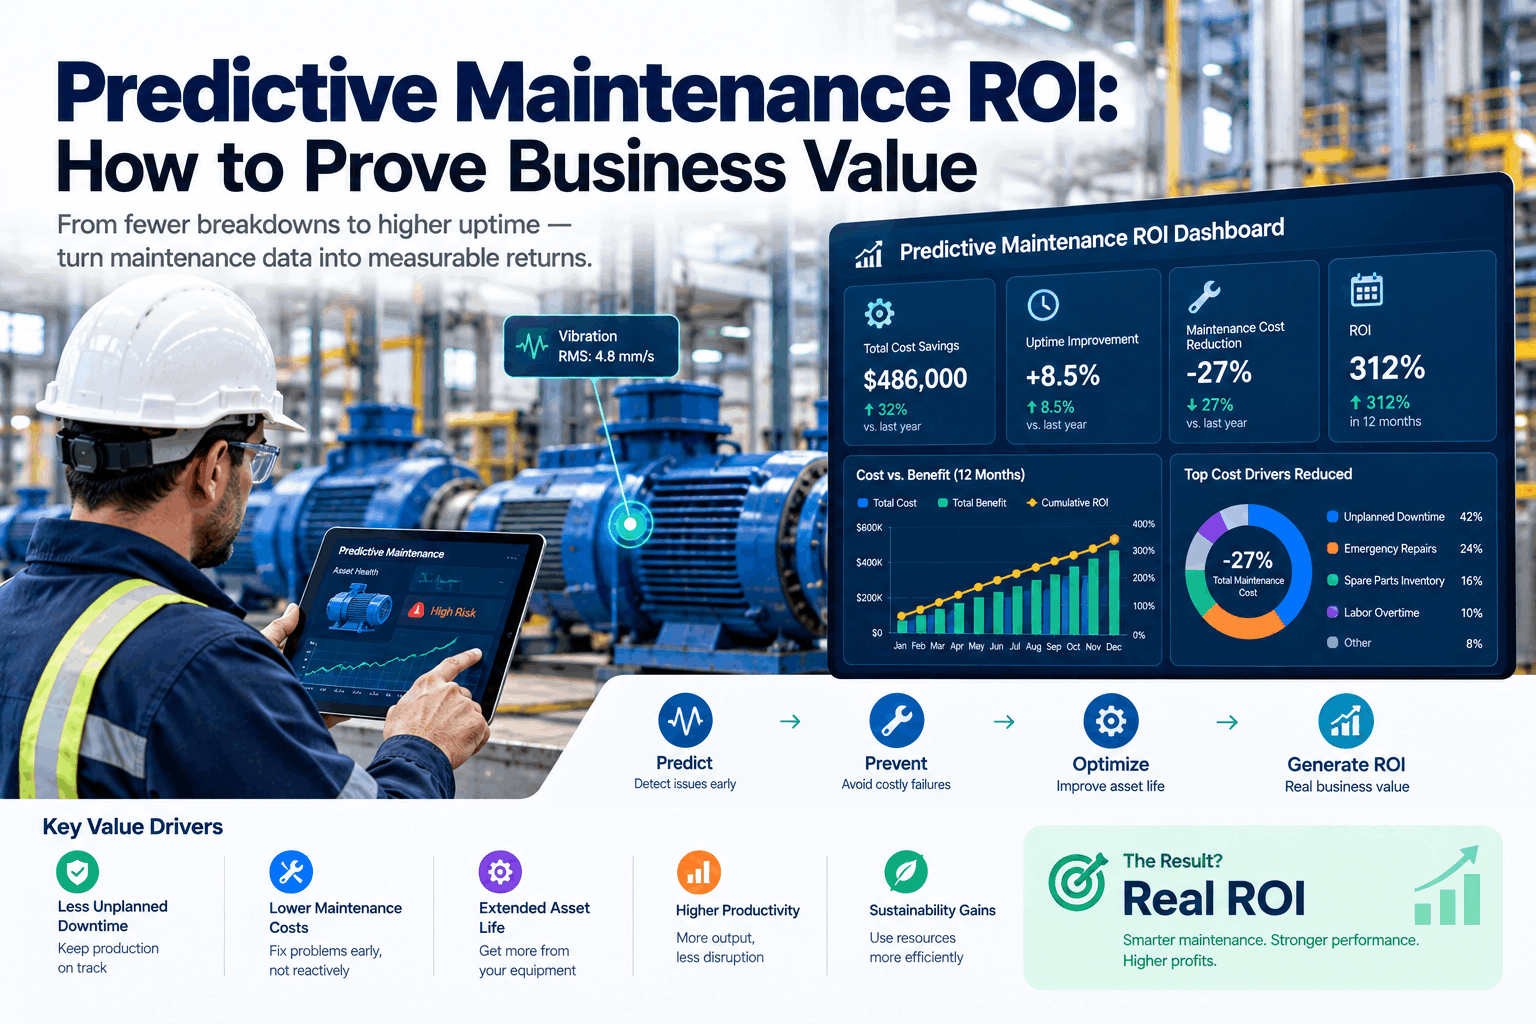
Predictive Maintenance ROI: How to Prove Business Value
Forecasting ROI wins the budget. Proving it keeps the program alive. Build a baseline, log every verified catch, value avoided failures conservatively and get finance to sign the ledger.
- The four value streams and which ones finance counts
- How to value an avoided failure without overclaiming
- A worked program ROI with costs and savings
Why Predictive Maintenance ROI Gets Challenged
Avoided failures never appear on an invoice.
Most of the value in predictive maintenance comes from things that did not happen. A bearing was changed in a planned stop instead of failing on a busy shift. That is real value, but it never shows up as a line in the accounts. Finance teams are right to be cautious, because the same logic can be used to claim almost any number. Published industry savings figures vary widely and rarely match a specific plant, so they do not survive a finance review either. The answer is a method that is conservative, consistent and checked by someone outside maintenance. Our reliability team can review how you report value today.
No baseline
Nobody recorded failure rates and costs before the program.
Worst-case claims
Every catch valued as if it would have caused the biggest failure.
Missing costs
Sensors, software and analyst time left out of the sum.
No sign-off
Value reported by maintenance, checked by nobody else.
The Four Value Streams
Some savings are cash. Some are cost avoidance. Label them honestly.
Predictive maintenance delivers value in four main ways. Finance will treat them differently, so report them separately. Hard savings reduce spending that already exists. Cost avoidance prevents spending that would probably have happened. Both are valid, but mixing them causes arguments. Agree the categories in a finance alignment call.
Hard savings such as fewer PM hours and lower overtime are the easiest for finance to accept, because they appear in existing records. Put them first in the report, then add avoided failures with their evidence. A program that shows some hard savings earns trust for the rest.
Build the Baseline Before Go-Live
You cannot prove improvement without a starting point.
Before sensors go live, pull at least twelve months of history for every asset in scope. This baseline is what every later claim is compared against. If the program has already started, rebuild the baseline from CMMS and production records as well as you can, and say clearly that it was rebuilt. Note anything else that changed in the same period, such as new equipment, a different product mix or a change in shift pattern, because finance will ask whether those explain part of the improvement. Plan your baseline with our analysts.
Breakdown history
Count, downtime and repair cost of unplanned failures per asset.
PM and labour
PM hours, overtime and contractor spend on the assets in scope.
Spares and rush orders
Parts used, emergency purchases and expediting costs.
Downtime cost
Lost output per hour of downtime, agreed with finance.
The Catch Log: Evidence for Every Avoided Failure
A catch only counts if it is verified.
Every time the system detects a developing fault and the team acts on it, record a catch. The catch log is the core evidence of predictive maintenance value. To keep it credible, each entry must meet clear rules, and someone outside the reliability team should be able to check it. Set up your catch rules in a verification workshop.
A catch counts when
- The alert came before any visible failure
- The component was inspected after removal
- Damage was found and photographed
- The repair was planned, not an emergency
A catch does not count when
- No damage was found on inspection
- The fault was already obvious to operators
- The part was due for replacement anyway
- There is no work order or photo
A photo of a spalled bearing race or a worn coupling ends most debates. Store it with the work order and the alert trend. Over a year, the catch log becomes a library of evidence that also helps train technicians and tune alerts.
How to Value an Avoided Failure Conservatively
Compare what would probably have happened with what did happen.
The value of a catch is the cost of the failure it prevented, minus the cost of the planned repair, weighted by how likely the failure really was. Use your own history for the failure cost, not the worst case you can imagine. Agree the likelihood factors with finance before the first catch, so they are not set to suit a result. Walk through the formula with our support team.
70%
Clear damage found, trend rising fast.
40%
Early damage found, trend rising slowly.
10%
Minor wear only, would have lasted to next PM.
Example likelihood bands. Agree your own with finance and keep them the same all year.
Report Value Finance Will Sign
Baseline, catch log and valuation rules built into the system, so every avoided failure is recorded with its evidence the day it happens.
A Worked Program ROI
Put every saving and every cost on the same page.
Here is a first-year example for a plant monitoring 80 critical assets. All figures are illustrative. The point is the structure: savings by type, every program cost included and a simple ROI anyone can recalculate. Build your own version in a working session.
Sensors and setup are mostly first-year costs, while catches continue. A simple two-year view usually shows a much stronger return than year one alone, and it gives finance a fairer picture of the program's life. Keep the same valuation rules in both years.
Use a Comparison Group Where You Can
The strongest proof is a fair comparison.
If you monitor some assets and not others of the same type, compare their failure rates over the same period. The gap is hard to argue with. Plants often start with a pilot area for exactly this reason. Pick assets of the same type, age and duty, run them over the same months and keep maintenance practice the same apart from monitoring. Even a small comparison of a dozen pumps can carry more weight with finance than a large catch log on its own. Ask our analysts how to pick a fair comparison.
Monitored assets
- Failures caught early and planned
- Unplanned breakdowns trend down
- PM hours fall as condition replaces calendar
- Repair costs shift to planned work
Similar unmonitored assets
- Failure rate stays near the baseline
- Breakdowns still arrive without warning
- PM hours unchanged
- Emergency repairs continue
Answering Finance's Questions
Every number should trace back to evidence.
The test of a value report is whether it holds up when someone asks follow-up questions. The exchange below shows the kind of check a finance lead might make. Questions about reporting go to our solutions team.
ROI Mistakes to Avoid
Overclaiming costs more credibility than it gains.
A program that reports huge savings and cannot back them up loses its budget faster than one that reports modest savings with evidence. These are the most common traps. A short report review can catch them.
What works
- Baseline from your own records
- Hard savings reported separately
- Likelihood bands agreed in advance
- Finance reviewing the catch log
What fails
- Using industry averages as your savings
- Valuing every catch as a worst case
- Leaving analyst time out of costs
- Counting catches with no inspection
How iFactory Proves Predictive Maintenance Value
Detection and value tracking in one system, on your own network.
iFactory runs predictive models on an on-prem AI server inside your plant. Alongside detection, it builds the baseline from your CMMS and production data, records each catch with its alert trend, work order and photos, applies your agreed valuation rules and produces a value ledger finance can review. Fit questions go to our solutions team.
Automatic baseline
Failure, labour and downtime history per asset.
Early detection
Developing faults flagged with trends.
Catch log
Alert, work order and photo in one record.
Valuation rules
Your formula and likelihood bands applied.
Finance review
Ledger shared for sign-off.
Comparison groups
Monitored and unmonitored assets side by side.
Results depend on your assets, failure history and how consistently catches are verified. We build the baseline and value ledger on your own data during the pilot, rather than promising a general figure.
Turnkey AI: Delivered, Connected and Live in 6–12 Weeks
You do not build this. It arrives ready.
iFactory ships as a pre-configured NVIDIA AI server with the software pre-loaded, racked and ready. Rack it, plug in power and Ethernet, and the AI is live on your network. Our team handles cabling, network setup, PLC, SCADA, DCS and CMMS integration, CMMS and sensor links, operator training and 24×7 remote monitoring. Data stays on your network. For a scope matched to your plant, request a turnkey quote.
Ship, network and data
Server installed. Sensors, CMMS history and production data connected. Baseline built.
Model training and pilot
Models tuned. Catch rules and valuation bands agreed with finance.
Go-live and training
PdM and value ledger live. Team trained on catch verification. 24×7 monitoring begins.
Frequently Asked Questions
How do you calculate predictive maintenance ROI?
Add hard savings and risk-weighted avoided failure value, subtract the full program cost, then divide the result by the program cost. Every input should trace back to records.
What is a catch log?
It is a record of every developing fault the system detected and the team acted on, with the alert trend, work order, inspection result and photo of the removed part.
How do we value a failure that never happened?
Use the typical cost of that failure from your own history, subtract the planned repair cost and multiply by an agreed likelihood that it would have failed before the next planned check.
Why not use published industry savings figures?
They vary widely by industry, asset mix and starting point, and finance cannot check them against your records. Use them for context, not for your own ROI.
What if we did not record a baseline?
Rebuild it from CMMS, purchasing and production records for the year before go-live, and state clearly that it was rebuilt.
Who should sign off the value report?
Someone outside maintenance, usually a plant controller or finance partner. They do not need to judge the engineering, only check that each claim follows the agreed rules and has evidence behind it.
What costs should be included?
Software, servers, sensors, installation, integration, training and the time your team spends reviewing alerts and verifying catches.
How long before ROI can be proven?
Hard savings can show within months. Avoided failure value builds as catches are verified, so most plants report a full first-year view.
How do we start?
Start with a pilot area of critical assets and a matching comparison group. A 6-week pilot connects your data, builds the baseline and sets up the catch log. To plan it, contact our team.
Prove the Value, Not Just the Promise
In thirty minutes we look at your failure history, maintenance costs and how value is reported today, and sketch a value ledger for one area. You keep the sketch either way.
- 1Twelve months of breakdown history
- 2PM hours on your critical assets
- 3Downtime cost per hour from finance
- 4Any catches you have already made
- 5The question finance keeps asking