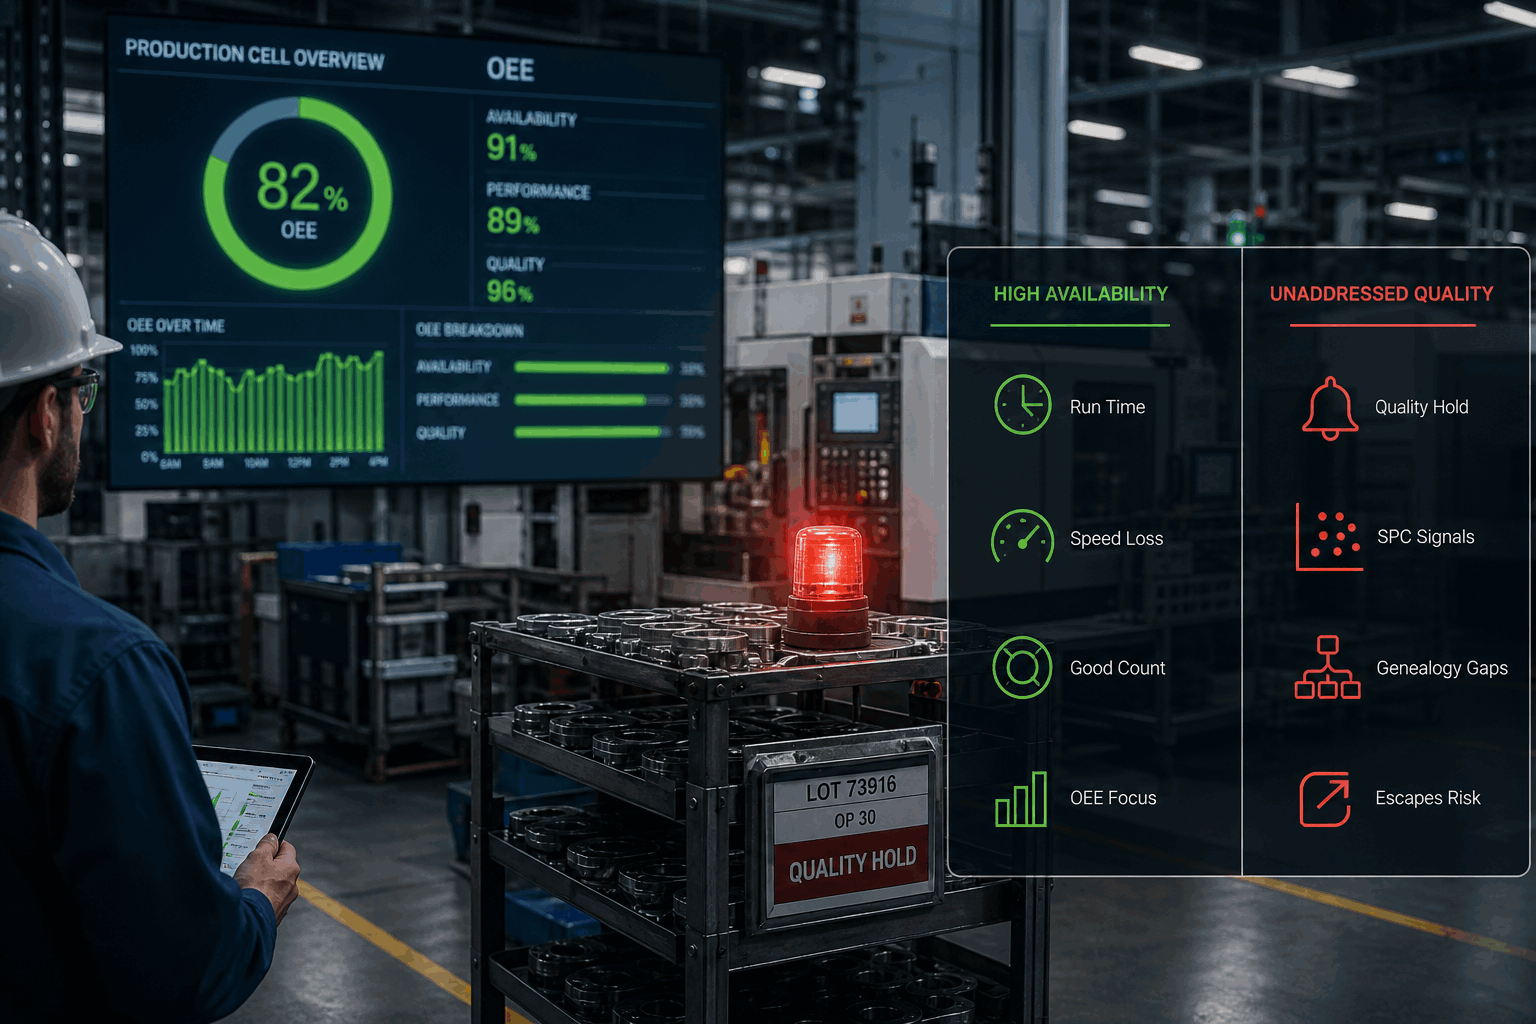
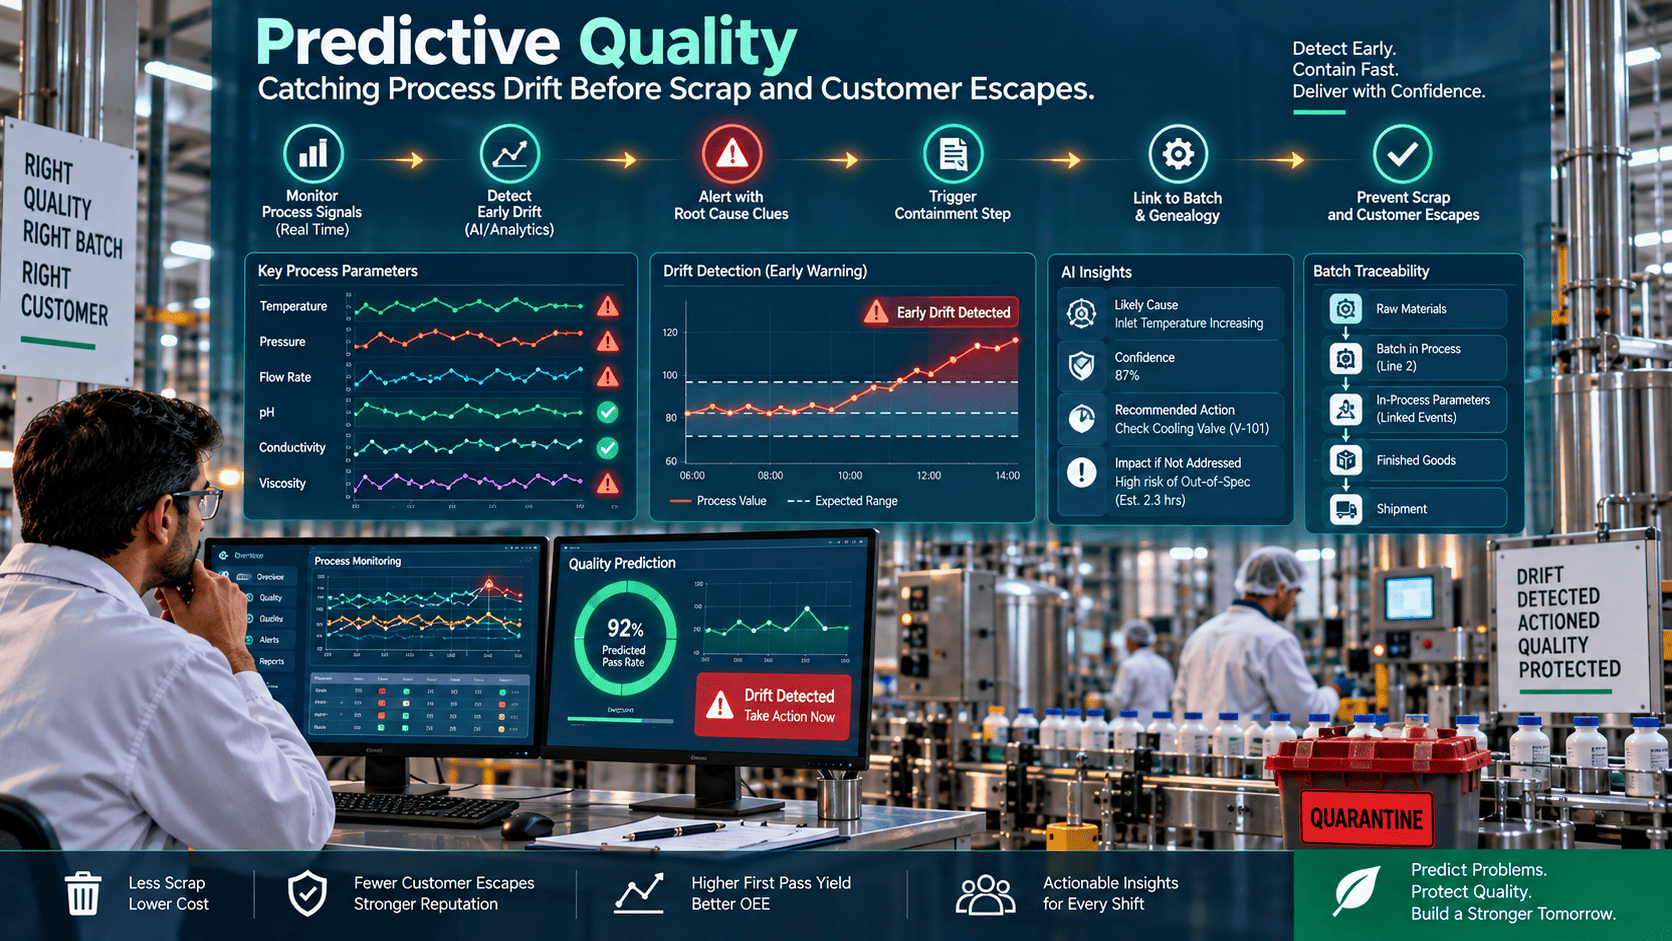
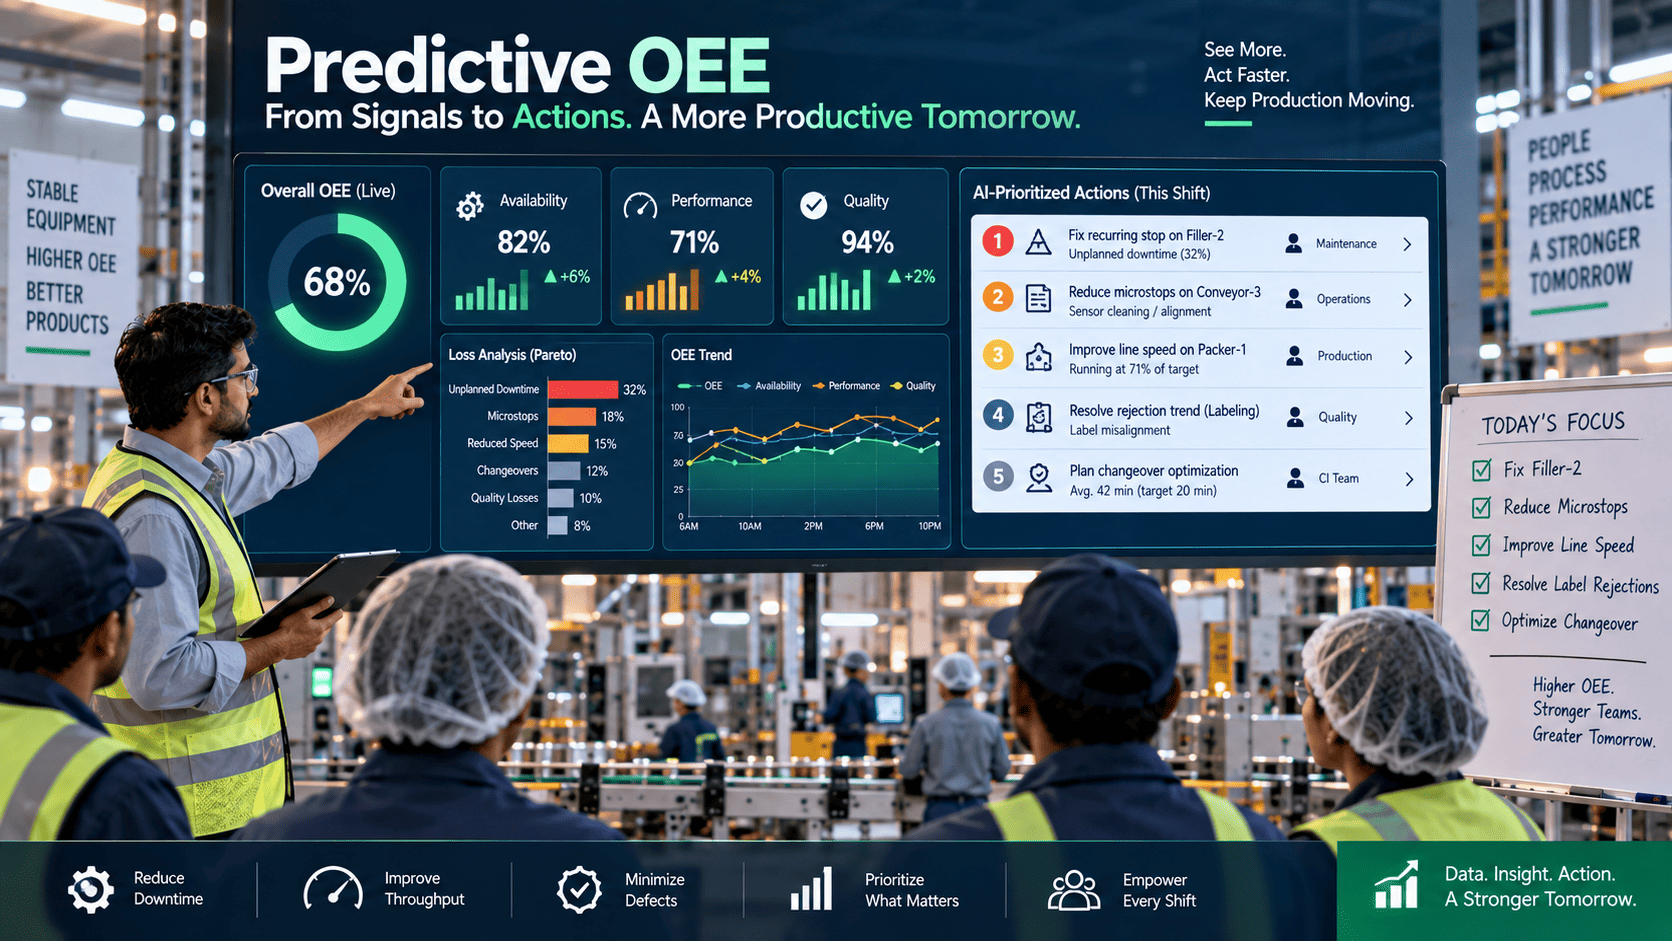
OEE at 92% looks like the plant is winning. What it doesn't show is that a Nelson rule fired at 06:14 on the same shift, three lots produced during the drift window are already in downstream inventory, and one shipment left the dock at 07:22 carrying suspect product. Availability, performance, and quality-yield calculate at end of shift on parts-produced-vs-planned math; they don't warn that a specific lot in transit needs to be recalled. Predictive OEE with lot genealogy connects the machine-level metric plant managers watch every hour to the lot-level containment that actually stops escapes — turning a comfortable dashboard into an early-warning system.
iFactory / Predictive OEE + genealogy
Stop Celebrating 92% Availability While Quality Lots Are Shipping
Predictive OEE that connects machine-level availability, performance, and yield to lot-level genealogy — surfacing quality escapes at the moment they happen, not after the customer calls. Hold decisions made against lots, not against parts-per-hour targets.
Dashboard shows
92%
Availability · green
Actually happening
Nelson rule 3 · 06:14 · unheld
Lot L-4471 · shipped 07:22
Cpk 1.18 · rolling · unflagged
Customer notice · 14:30
Predictive
not retrospective
Escape
prevented, not counted
The Problem in OEE Dashboard Reality
A typical OEE dashboard reports availability, performance, and quality-yield at end of shift on a parts-produced-vs-planned basis. What it misses is the lot-level view: a Nelson rule fired on a critical characteristic at 06:14, three lots produced during the drift window are already in downstream inventory, one shipment left the dock at 07:22 carrying suspect product. The dashboard shows 92% availability and looks like a good shift; QA reviews find the escape 8 hours later at the customer's incoming inspection. Availability improvements can mask process instability that OEE was never built to catch, and by the time the escape is visible, the loop has been open for a full shift.
Where OEE Reality and Dashboard Diverge
OEE dashboard blind spots are consistent across plants with mature OEE programs. Each is a specific gap between availability metrics and lot-level reality.
Silent OOC in green shift
Nelson pattern fires during a high-availability shift. Availability metric doesn't reflect the pattern. Shift closes with dashboard green; suspect lots already in inventory.
Quality-yield end of shift
Quality-yield percentage calculated on parts-good-vs-total for the shift. Individual lot escapes with defects below the sampling threshold don't move the yield needle enough to flag.
Downstream propagation blind
Machine keeps running at target rate; downstream lines consuming its output aren't notified of the drift window. Propagation continues until QA catches it days later.
Recall math forensic
When escape is caught, tracing affected lots takes hours or days walking through MES records. Recall scope broader than necessary because narrow scope isn't demonstrable.
What Good Looks Like in Predictive OEE
A working predictive OEE holds four disciplines together — machine plus lot dual-view, rule engine on both, automatic containment on lots, and drift-window genealogy.
Dual-View
Machine metrics (availability, performance) and lot metrics (drift-window, containment status) shown side-by-side. Plant manager sees both simultaneously; neither hides the other.
Both, not either
Rule Engine
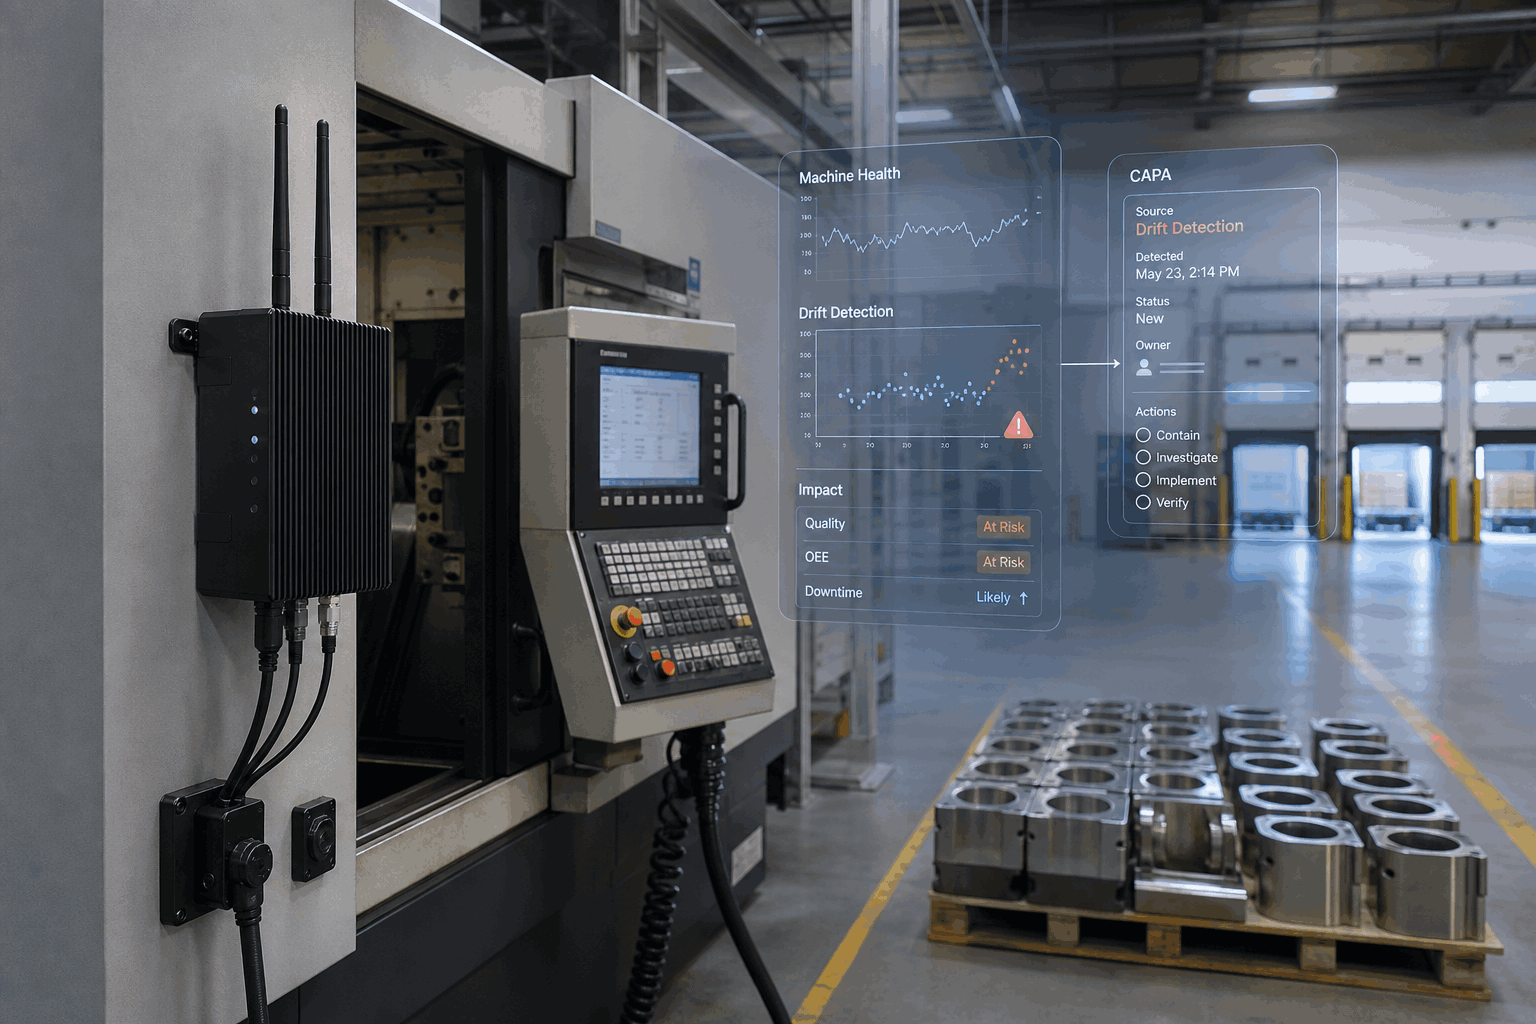
Nelson and Western Electric rules applied to critical characteristics live. Rule fires flagged in dashboard immediately; availability numbers don't hide them.
Rules on the chart
Lot Containment
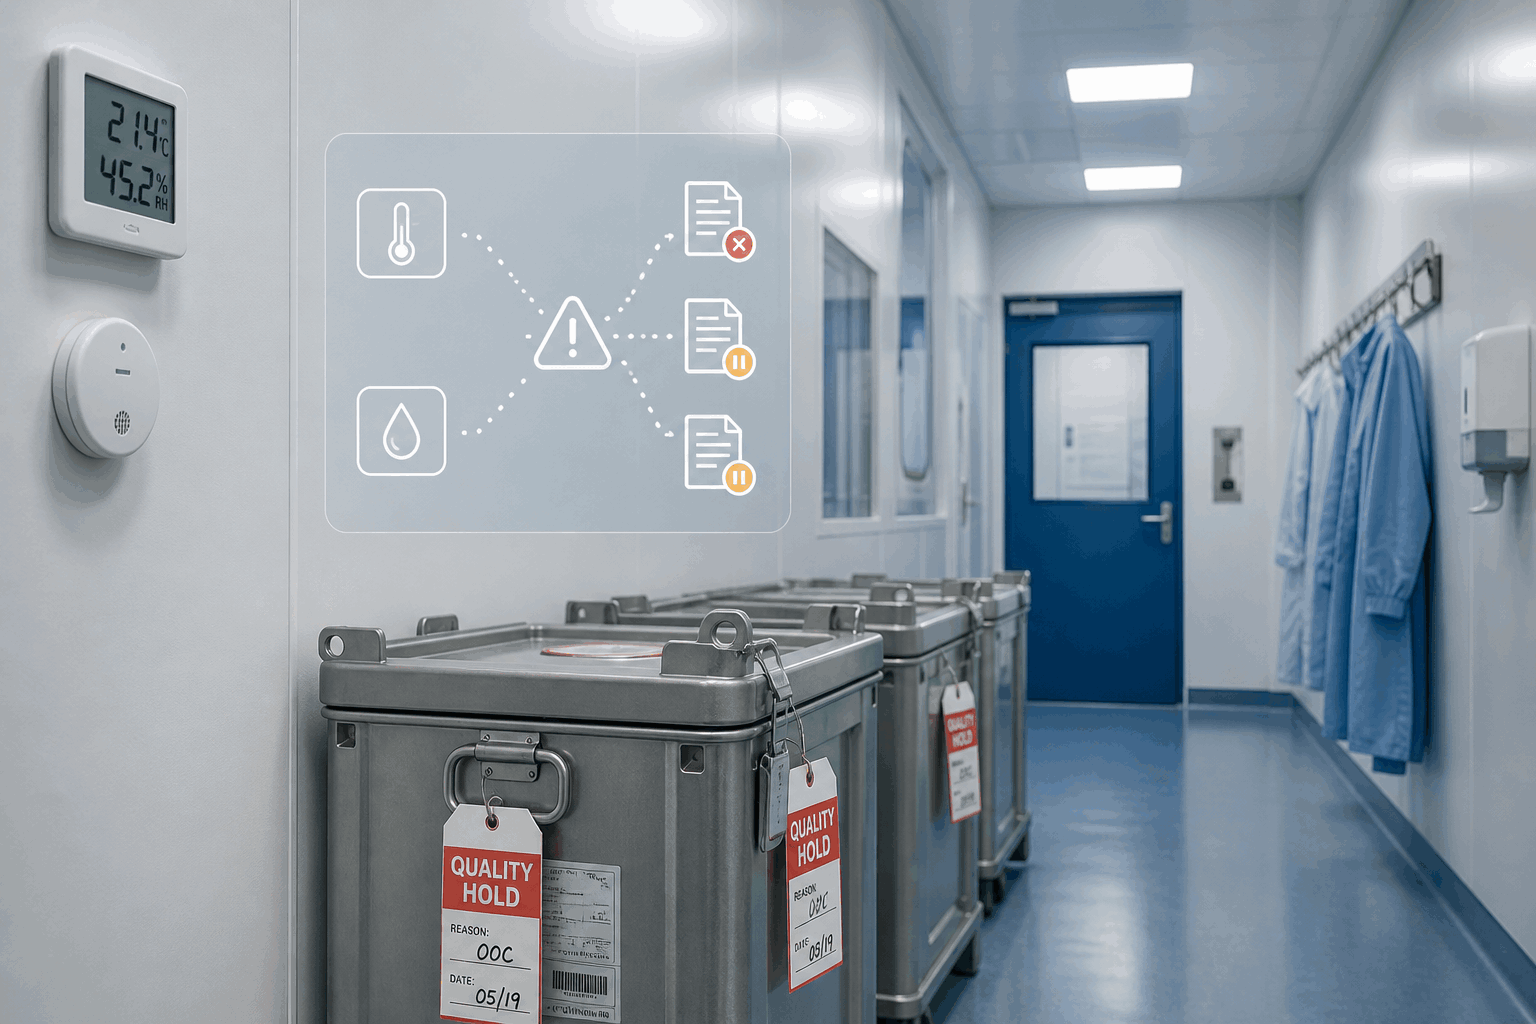
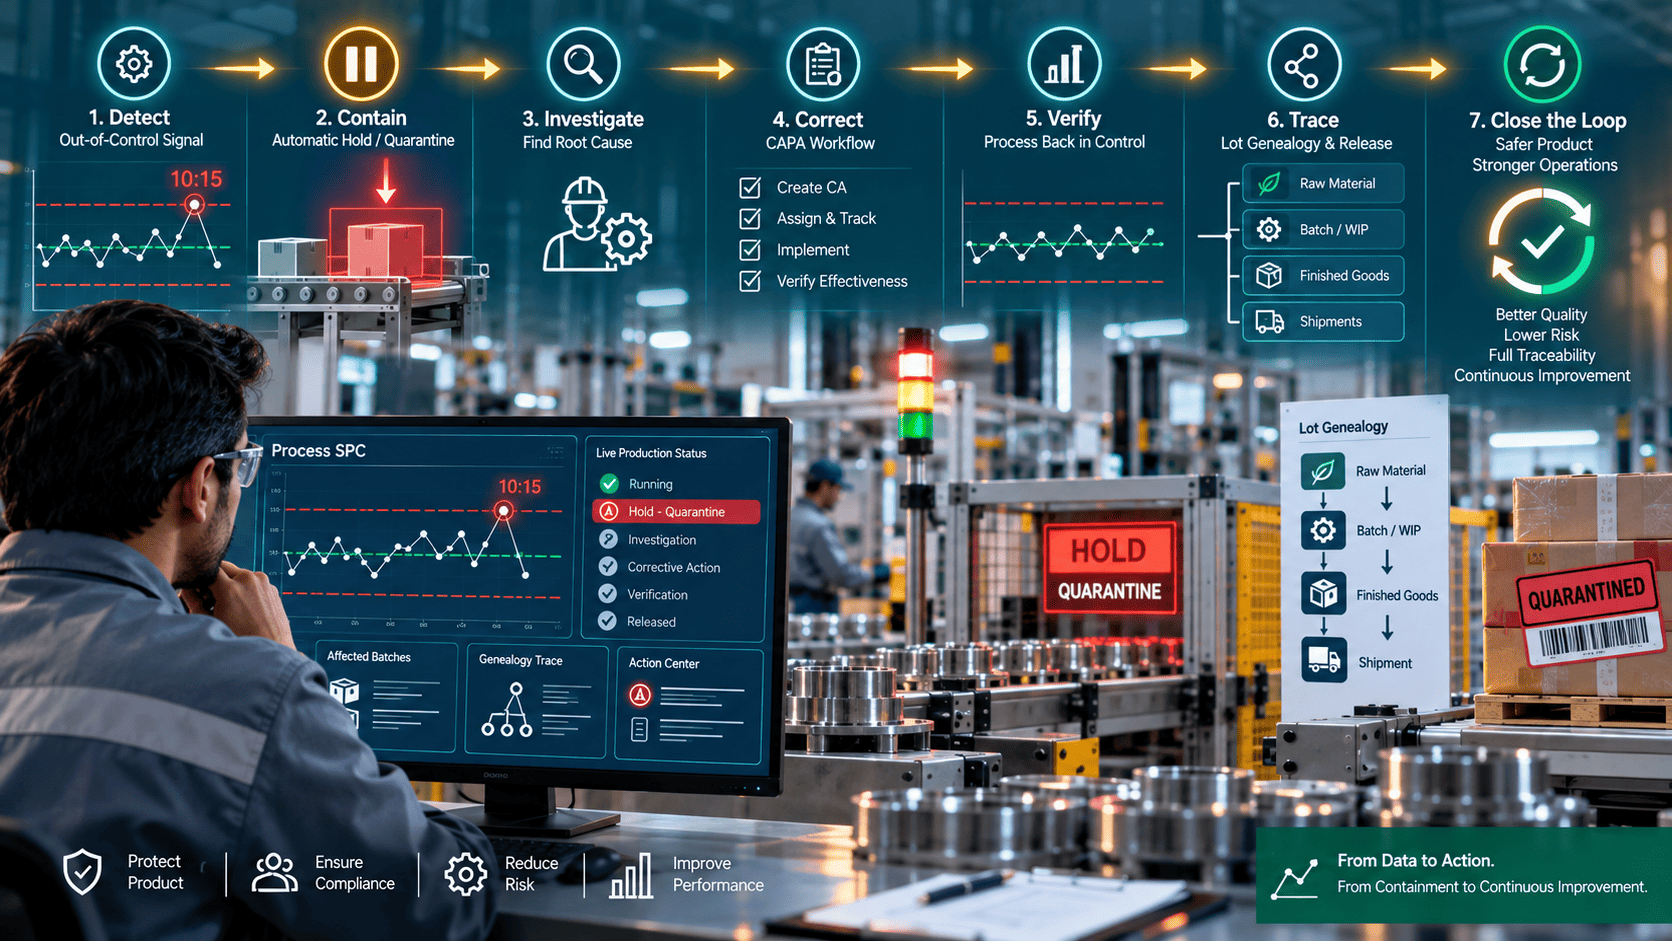
Rule fire triggers automatic hold on affected lot and sibling lots in the drift window. MES hold flag posts; downstream lines notified. Loop closes at lot level.
Hold, not just flag
Drift-Window Genealogy
Every lot in the drift window indexed with disposition — held, released, in-transit, at customer. Recall scope narrow and demonstrable in seconds.
Scope demonstrable
How iFactory AI Fits
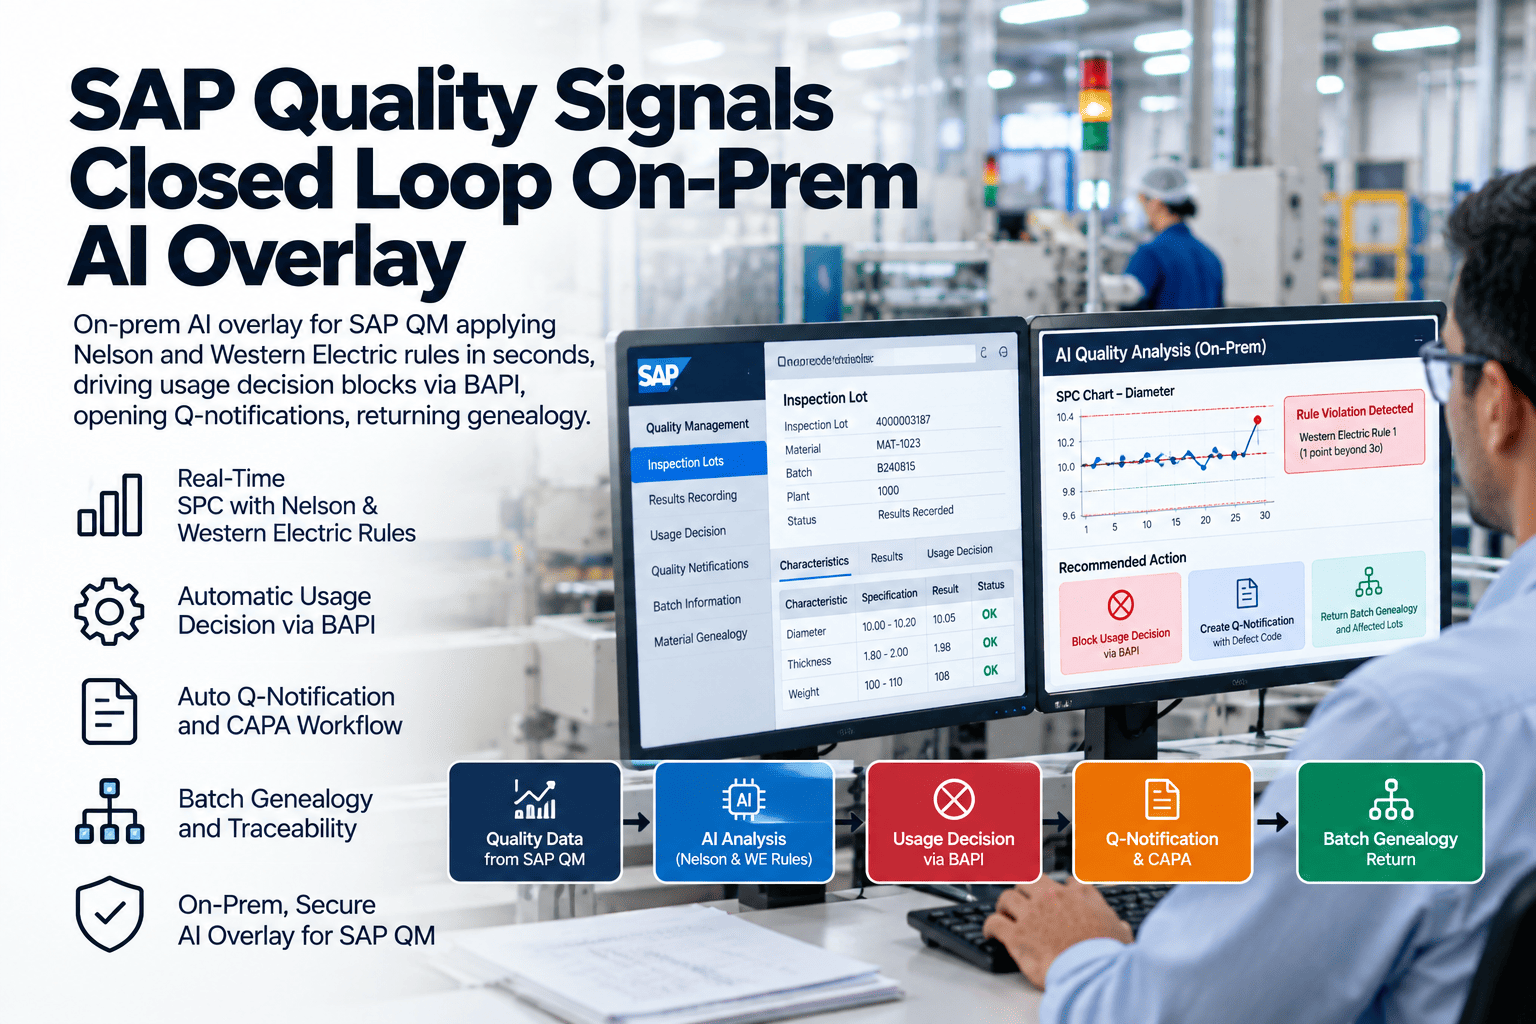
iFactory AI overlays your MES, historian, and OEE reporting — adding lot-level containment to the machine-level metrics your OEE program already tracks, and closing the loop where availability dashboards leave it open.
Dual-View Dashboard
Overlay Layer
Machine metrics (availability, performance, quality-yield) and lot metrics (drift-window, containment status) integrated in one view. Plant manager sees both without switching tools.
Rule Engine
Overlay + Historian
Nelson and Western Electric rules on critical characteristics from historian or MES inspection data. Rule fires surface immediately; classification distinguishes fire types.
MES Hold Bridge
Overlay + MES
Rule fire triggers MES hold on affected lot and sibling lots in drift window. Downstream line notification via MES event. Standard MES audit trail preserved.
Genealogy Query
Overlay + MES
Every lot in drift window queryable with disposition status. Recall scope narrow, demonstrable, and auditable. Reduces recall math from hours to seconds.
Ask your OEE program owner what happens between a Nelson rule firing during a high-availability shift and the specific affected lot being held. If the answer is "the OEE dashboard doesn't track that," the overlay is the specific closure — because availability metrics were never built for lot-level escape prevention. Book a predictive OEE review.
10-Week Predictive OEE Pilot on One Line
One critical production line, ten weeks. The pilot deploys the overlay, activates dual-view dashboards, connects rule engine to MES hold flags, and closes the first month of lot-level containment discipline.
Weeks 1–2
Overlay + Dashboard
Overlay connected to MES and historian. Dual-view dashboard live for pilot line. Baseline current-state escape rate and lot-level containment cycle time.
Weeks 3–5
Rule Engine Live
Nelson and Western Electric rules active on critical characteristics. Rule fire accuracy tuned against operator ground truth. False-fire rate under acceptable threshold.
Weeks 6–8
MES Hold Active
Rule fires drive MES hold flags in production. First automated lot containments post. Downstream line notifications tested and refined.
Weeks 9–10
Genealogy + Report
Drift-window genealogy queries live. Recall scope demonstrations for triggered events. First-month report on containment cycle and escape prevention. Rollout to sister lines scoped.
Who Owns the KPI
Predictive OEE crosses plant management, quality, MES/IT, and downstream production. Each function owns a specific KPI or the loop stays open at the dashboard.
Plant Manager
Escape rate during green shifts
Owns the outcome — escapes occurring during shifts the OEE dashboard reported as green. Overlay surfaces the divergence and closes it.
Quality Manager
Lot-containment cycle time
Owns the cycle — time from rule fire to lot hold posting. Overlay drives cycle from shifts to seconds.
MES / IT Lead
MES hold integrity + overlay uptime
Owns the integration reliability — MES hold flag accuracy, overlay availability, no adverse MES impact.
Production Supervisor
Downstream propagation prevented
Owns the propagation outcome — suspect lots reaching downstream lines before containment. Fast loop reduces propagation directly.
FAQ
Does this replace our existing OEE reporting tool?
No — overlay only. Your existing OEE tool (whether Aveva, Rockwell FactoryTalk, custom BI, or manual reporting) continues to calculate and report availability, performance, and quality-yield the same way. The overlay adds the lot-level view and the rule-based containment layer alongside it —
book a demo to see the dual-view live.
How does the rule engine avoid false-fire fatigue that operators would ignore?
Rule fires are tuned per line during pilot — Nelson 8-rule set applied selectively (many operations use rules 1, 2, 3, 5 and skip the more sensitive 4, 6, 7, 8), confirmation windows sized to reduce single-outlier fires, and severity tiers distinguishing advisory from immediate-hold. Operators only see hold-worthy fires; the noisy rules feed background analytics instead.
What if the drift-window genealogy needs to reach across multiple lines and downstream assemblies?
Multi-line and downstream-assembly genealogy requires the MES traceability model to capture cross-line consumption and assembly-level composition. Where the model is complete, the overlay walks it and returns the affected downstream units. Where the model has gaps, the overlay returns what the data supports and flags the gap for manual completion — honest about what's traceable and what needs closing.
Stop letting 92% availability hide the escape.
See Predictive OEE with Lot Genealogy — Live on One Line
Bring one production line's last month of OEE reports, one recent quality escape, and current lot-containment cycle time. We'll walk what predictive OEE with lot genealogy would have caught, and demonstrate the dual-view dashboard.
Rule engine
on critical CTQs