An auditor rarely asks whether you run SPC. They pick one special characteristic and ask to see the chart, the limits, the last signal and what the operator did about it. That is where most plants lose points. This guide shows how to set up SPC in an automotive plant so it holds up in PPAP and customer audits. Start with an SPC review.
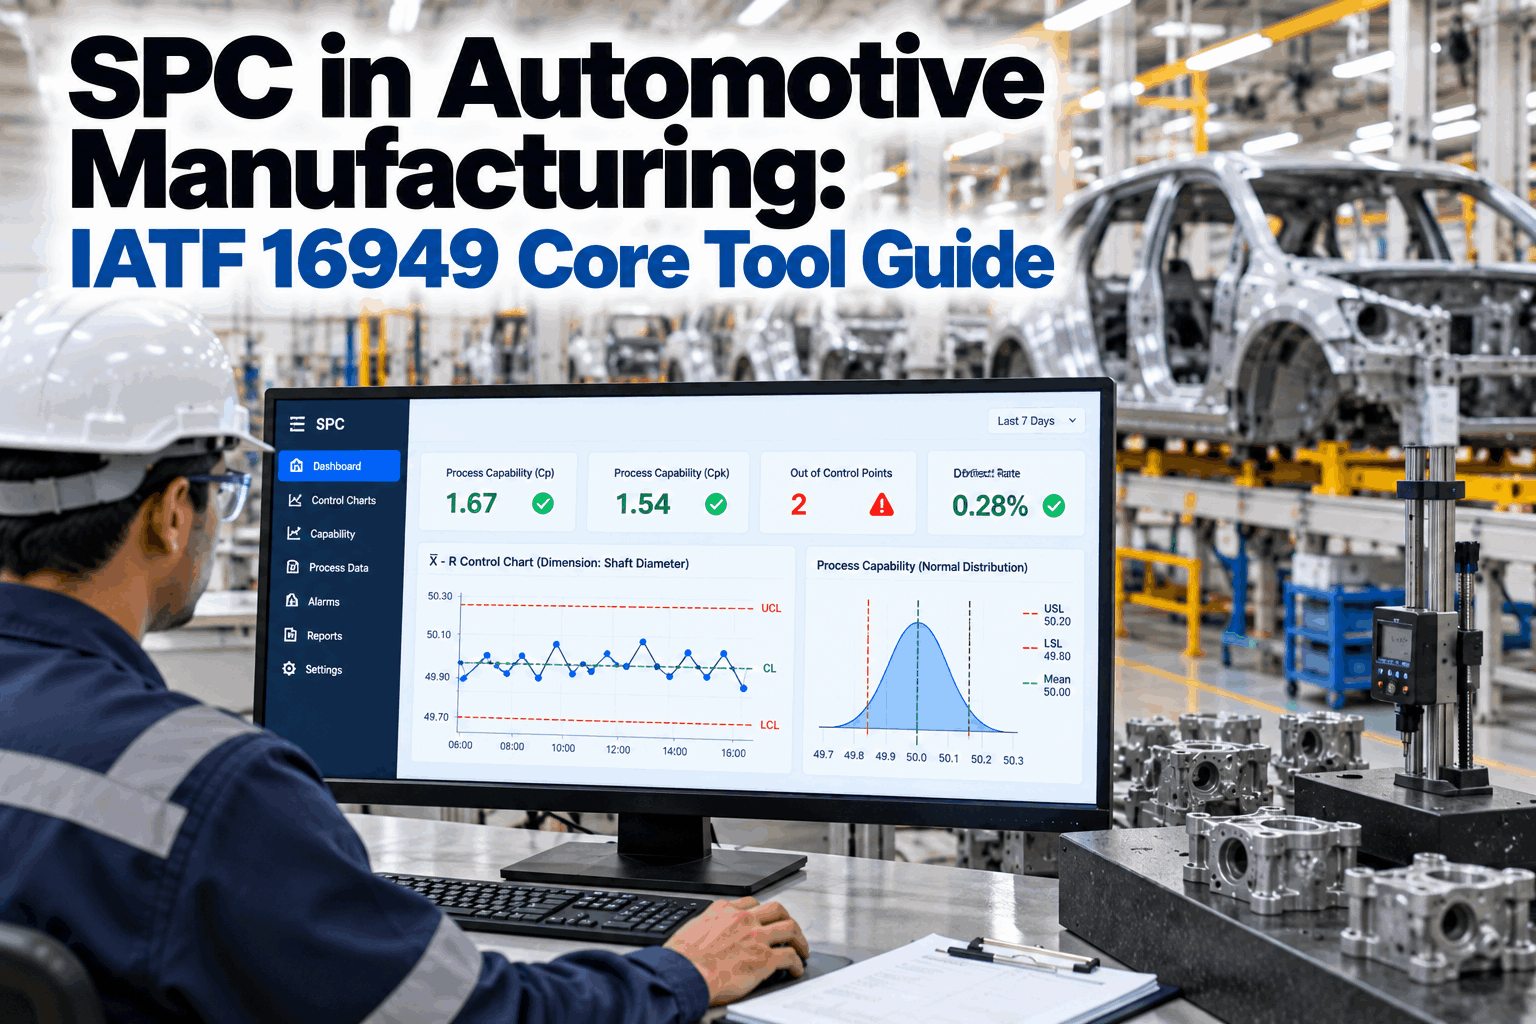
SPC in Automotive Manufacturing: IATF 16949 Core Tool Guide
SPC is the core tool that proves your process stays in control after PPAP is signed. Learn how to pick characteristics, prove the gauge, choose the right chart and run reaction plans that an auditor can follow from signal to fix.
- Where SPC sits among the five core tools
- Capability targets for PPAP and ongoing production
- Reaction plans that survive customer audits
Where SPC Fits in the IATF 16949 Core Tools
FMEA says what can go wrong. SPC shows whether it is starting to.
The five AIAG core tools work as one chain. APQP plans the launch, FMEA ranks the risks, MSA proves the gauges can be trusted, SPC watches the process and PPAP packages the evidence for the customer. SPC is the only tool that keeps working every shift after launch. If one link is weak, the SPC chart shows it first, which is why auditors go straight to it. To see how your chain connects today, talk to our quality team.
Special characteristics and high-risk failure modes tell you what to chart.
A proven gauge tells you the chart shows the process, not the measurement noise.
Sample size, frequency, chart type and reaction plan are written down per characteristic.
Initial process studies give the capability numbers the customer signs off.
Plants that chart everything usually watch nothing. Start with the special characteristics in your drawings and the high-risk items in your PFMEA, then add more only when a chart earns its place.
What IATF 16949 Actually Asks For
Three clauses carry most of the SPC weight.
IATF 16949 does not say "run X-bar charts on every line". It asks for process studies, the right statistical tools for each process and people who understand variation. Customer-specific requirements then add detail, so always check them alongside the standard. A short clause check shows where your records stand.
Monitoring manufacturing processes
Process studies on new manufacturing processes to verify capability, capability kept at the levels the customer approved at PPAP, and reaction plans used when a characteristic is out of control or not capable.
Identification of statistical tools
The right statistical tools for each process are chosen during advanced quality planning and written into the PFMEA and the control plan.
Application of statistical concepts
People who collect, analyse and act on data understand variation, control, stability, capability and the effects of over-adjustment.
The Ppk in your PPAP file tells the customer what the process can do. Clause 9.1.1.1 expects you to keep it there. A chart that drifts after launch without a recorded reaction is a finding waiting to happen.
Capability Targets: Cpk, Ppk and What the Customer Expects
Ppk proves the launch. Cpk proves the process keeps up.
Both indices compare process spread with the tolerance, but they use different variation. Cpk uses short-term, within-subgroup variation, so it shows what the process can do. Ppk uses overall variation across all readings, so it shows what the process actually did. The figures below are the common AIAG PPAP defaults. Customer-specific requirements can set higher targets, especially for safety characteristics. Our SPC specialists can map your customer targets to your charts.
(USL − LSL) ÷ 6σPotential spread only, ignores centringmin(USL − μ, μ − LSL) ÷ 3σ withinShort-term capability, centring includedmin(USL − μ, μ − LSL) ÷ 3σ overallLong-term performance, all variation includedFor ongoing production, many customers expect Cpk of at least 1.33, and higher for safety and critical characteristics. A large gap between Cpk and Ppk points to special causes between subgroups that need investigation.
Capability assumes the process is in statistical control. If the chart shows special causes, the Cpk number describes nothing in particular. Get control first, then calculate capability.
Set Up SPC That Holds: Six Steps
Most SPC failures are set-up failures.
A chart is only as good as the decisions behind it. These six steps follow the order an auditor will trace: why this characteristic, why this gauge, why this chart, why these limits, why this sample and what happens on a signal. If you can answer each one with a record, the chart will hold up. Plan the set-up with a set-up session.
Choose the characteristics
Start from drawing special characteristics and PFMEA high-risk items. Record why each one is charted.
Prove the gauge first
Run a gauge R&R. Under 10% of tolerance is generally accepted, 10% to 30% may pass with justification, and above 30% needs a better gauge.
Pick the chart type
Match the chart to the data: variable or attribute, subgroup size and production rate. The guide below helps.
Calculate limits from data
Control limits come from the process, never from the drawing tolerance. Use enough subgroups, usually 20 to 25, before fixing them.
Set sample size and frequency
Write them into the control plan. Sample more often after tool changes, set-ups and material lot changes.
Write the reaction plan
For each signal, state who stops, what is contained, what is checked and how the fix is recorded.
Take the parts in each subgroup close together in time, from one machine, one tool and one cavity. Mixing spindles, cavities or shifts inside a subgroup widens the limits and hides the very shifts the chart is meant to catch. When a process has several streams, chart each stream on its own first.
Walk into PPAP With the Numbers Ready
A PPAP capability pack should take minutes to pull, not days to rebuild from spreadsheets. When every chart, study and reaction lives in one system, the evidence is ready before the customer asks.
Signals and Reaction Plans Auditors Trust
A chart nobody reacts to is decoration.
Out-of-control rules turn a chart into a decision. Most plants use a short set based on the Western Electric and Nelson rules, written into the control plan so every shift reacts the same way. The reaction record is what auditors read: who saw the signal, what was contained and what was fixed. Questions on rule sets go to our support desk.
One point beyond 3σ
A clear special cause. Stop, contain and investigate.
Seven or more on one side
The mean has shifted, often after a set-up or new lot.
Six points rising or falling
A trend, often tool wear or temperature drift.
Two of three beyond 2σ
An early warning before a point leaves the limits.
SPC Mistakes That Fail Audits
Most findings come from a few repeat habits.
Auditors see the same patterns across plants. None of them need new software to fix, but all of them are easier to prevent when charts are live and reactions are logged as they happen. Book an audit prep session to check your charts against them.
What auditors like
- Limits calculated from process data and recalculated only after a real process change
- Every signal followed by a dated reaction record
- Charts filled at the time of measurement
- Operators who can explain the rule they reacted to
What auditors flag
- Drawing tolerances used as control limits
- Signals on the chart with no reaction recorded
- Readings back-filled at the end of the shift
- Capability calculated on an out-of-control process
Pick a special characteristic at random. Trace it from the drawing to the PFMEA, the control plan, the gauge study, the chart and the last reaction. Every gap you find is one the auditor would have found.
How iFactory Runs SPC on the Plant Floor
Readings in, reactions out, evidence always ready.
iFactory collects readings from gauges, CMMs and PLCs, charts them live and checks every point against your rules. When a signal fires, the operator gets the reaction plan on a line-side screen and logs the response there. Capability, gauge studies and reaction records sit in one place for PPAP and audits. It runs on an on-prem AI platform inside your network. Fit questions go to our solutions team.
Live control charts
Readings from gauges, CMMs and PLCs charted as they arrive, with no manual entry.
Rule alerts
Western Electric and Nelson rules checked on every point, with the alert sent to the right station.
Reaction logging
The reaction plan appears with the alert, and the operator logs containment and cause on the spot.
Capability tracking
Cpk and Ppk trended per characteristic, with a warning before they fall below customer targets.
PPAP-ready packs
Process studies, gauge R&R and chart history pulled into one pack for each part number.
Cause finder
AI links signals to tool life, set-ups, material lots and shifts, so the likely cause shows first.
Results depend on your gauges, data quality and how consistently reactions are logged. We measure signal response time, capability trends and audit readiness on your own data during the pilot, rather than promising a general figure.
Turnkey AI: Delivered, Connected and Live in 6–12 Weeks
You do not build this. It arrives ready.
iFactory ships as a pre-configured NVIDIA AI server with the software pre-loaded, racked and ready. Rack it, plug in power and Ethernet, and the AI is live on your network. Our team handles cabling, network setup, PLC, SCADA, gauge and CMM integration, operator training and 24×7 remote monitoring. Data stays on your network. For a scope matched to your plant, request a turnkey quote.
Ship, network and data
Server installed. Gauges, CMMs and PLCs connected for the pilot characteristics.
Model training and pilot
Control limits and rules set. AI trained on your signals and causes. Pilot live on one line.
Go-live and training
Live charts across the pilot line. Operators and quality engineers trained. 24×7 monitoring begins.
Frequently Asked Questions
Is SPC mandatory under IATF 16949?
IATF 16949 requires process studies, the right statistical tools for each process and people who understand statistical concepts. Most automotive customers also require the AIAG core tools, including SPC, through their customer-specific requirements, so in practice SPC is expected on special characteristics.
What are the five IATF 16949 core tools?
APQP for launch planning, FMEA for risk analysis, MSA for measurement systems, SPC for process control and PPAP for production part approval. They are published by AIAG and work best as one connected chain.
What Ppk does PPAP require?
The common AIAG default for an initial process study is Ppk above 1.67. Values from 1.33 to 1.67 are usually conditional and need customer sign-off, and values below 1.33 are not accepted. Your customer's own requirements can set different targets.
What is the difference between Cpk and Ppk?
Cpk uses short-term variation within subgroups and shows what the process can do. Ppk uses overall variation across all readings and shows what the process actually did. A large gap between them points to special causes between subgroups.
Can control limits be the same as drawing tolerances?
No. Control limits come from process data and show how the process normally varies. Tolerances come from the design. Using tolerances as control limits hides drift until parts are already out of specification.
How often should control limits be recalculated?
Only after a real, documented change to the process, such as a new tool, machine, material or method. Recalculating limits on a fixed calendar lets slow drift become the new normal.
How do we start with SPC software?
Start with one line and its special characteristics, where audit exposure is highest. A 6-week pilot connects the gauges, sets limits and rules, and shows live charts with logged reactions. To plan it, contact our team.
Make Every Chart Audit-Ready
In thirty minutes we look at your charts, your control plans and how reactions are recorded today. You keep the notes whether or not you go further with iFactory.
- 1One control plan with its special characteristics
- 2The matching charts from the last month
- 3Your latest gauge R&R results
- 4Customer-specific SPC and capability rules
- 5Your last audit findings on process control