An engine block has hundreds of machined characteristics, and if any single one — a bore diameter, a deck flatness, a bolt-hole position — drifts out of tolerance, the whole part is scrap. That is the reality of automotive CNC: dozens of critical dimensions per part, produced at 50,000 units a month, against a customer expecting not just parts in spec but statistical proof the process will stay in spec. Statistical Process Control is how that proof is built — X̄-R charts that separate real drift from normal noise, and Cpk that quantifies the margin against the specification limit. A Cpk of 1.67, the automotive bar for critical features under IATF 16949, means the process spread occupies less than 60% of the tolerance band. This guide walks through setting up SPC on a CNC line to reach it. To see it on your process, book a demo.
OPERATIONS · AUTOMOTIVE CNC MACHINING · STATISTICAL PROCESS CONTROL
Set Up SPC That Drives CNC Machining Cpk Above 1.67
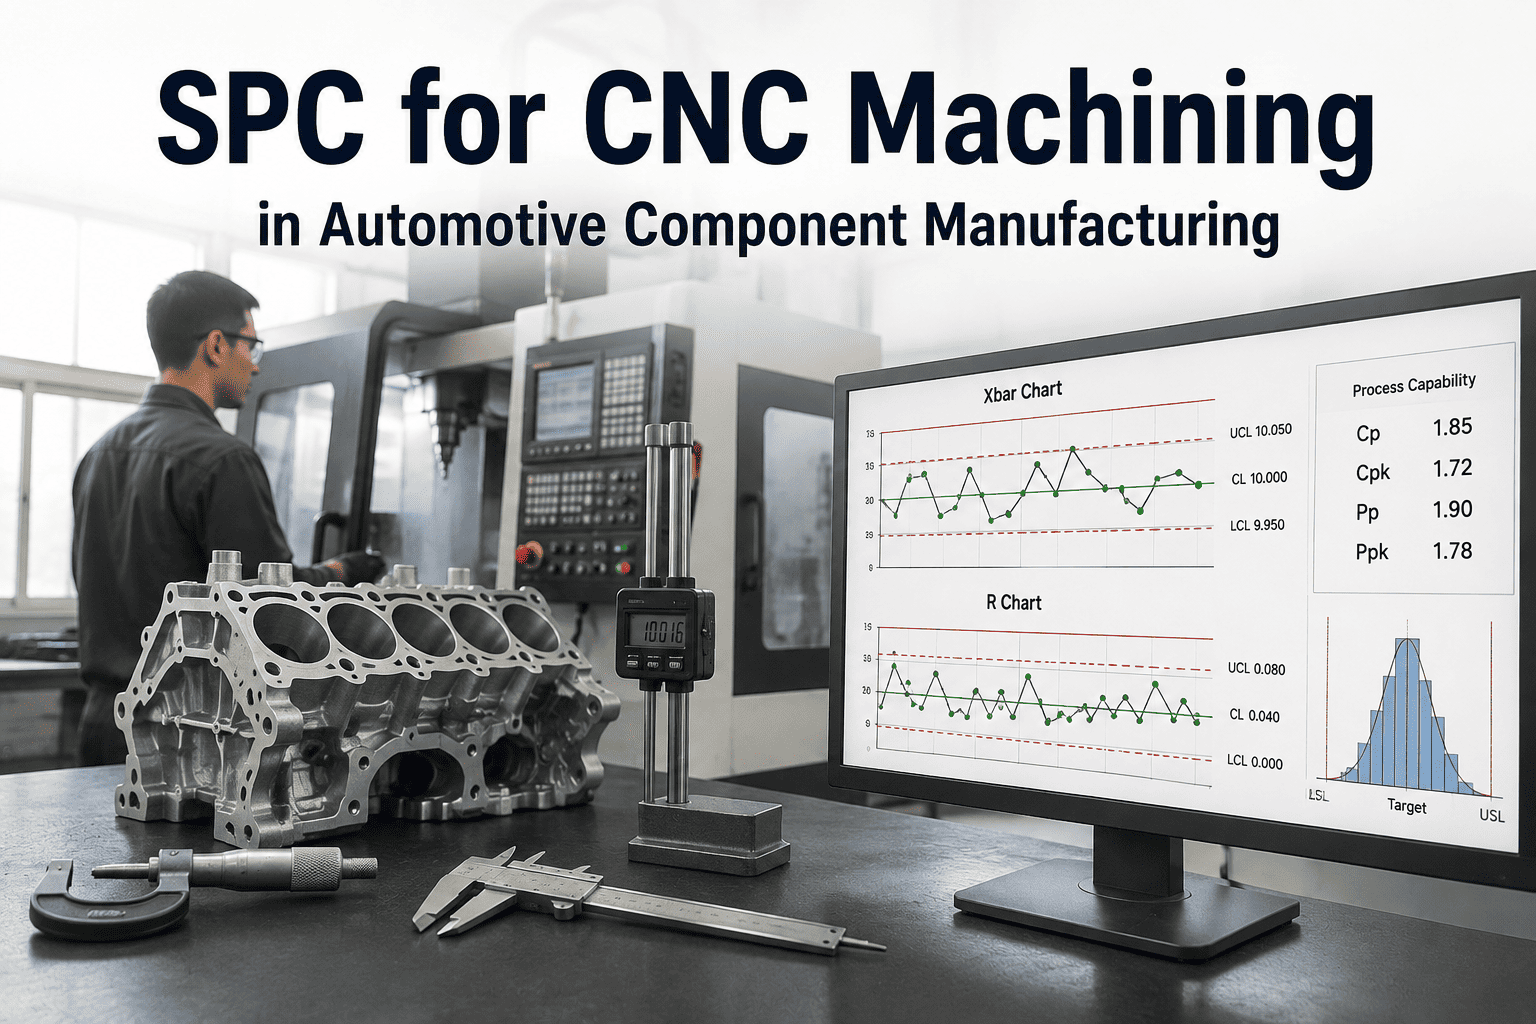
Engine block, cylinder head, transmission casing — every critical CNC dimension needs a control chart and a capability index. See how to select characteristics, build X̄-R charts, calculate Cpk correctly, and close the feedback loop that holds capability against thermal, tool-wear, and material drift.
THE NUMBERS THAT DEFINE CAPABILITY
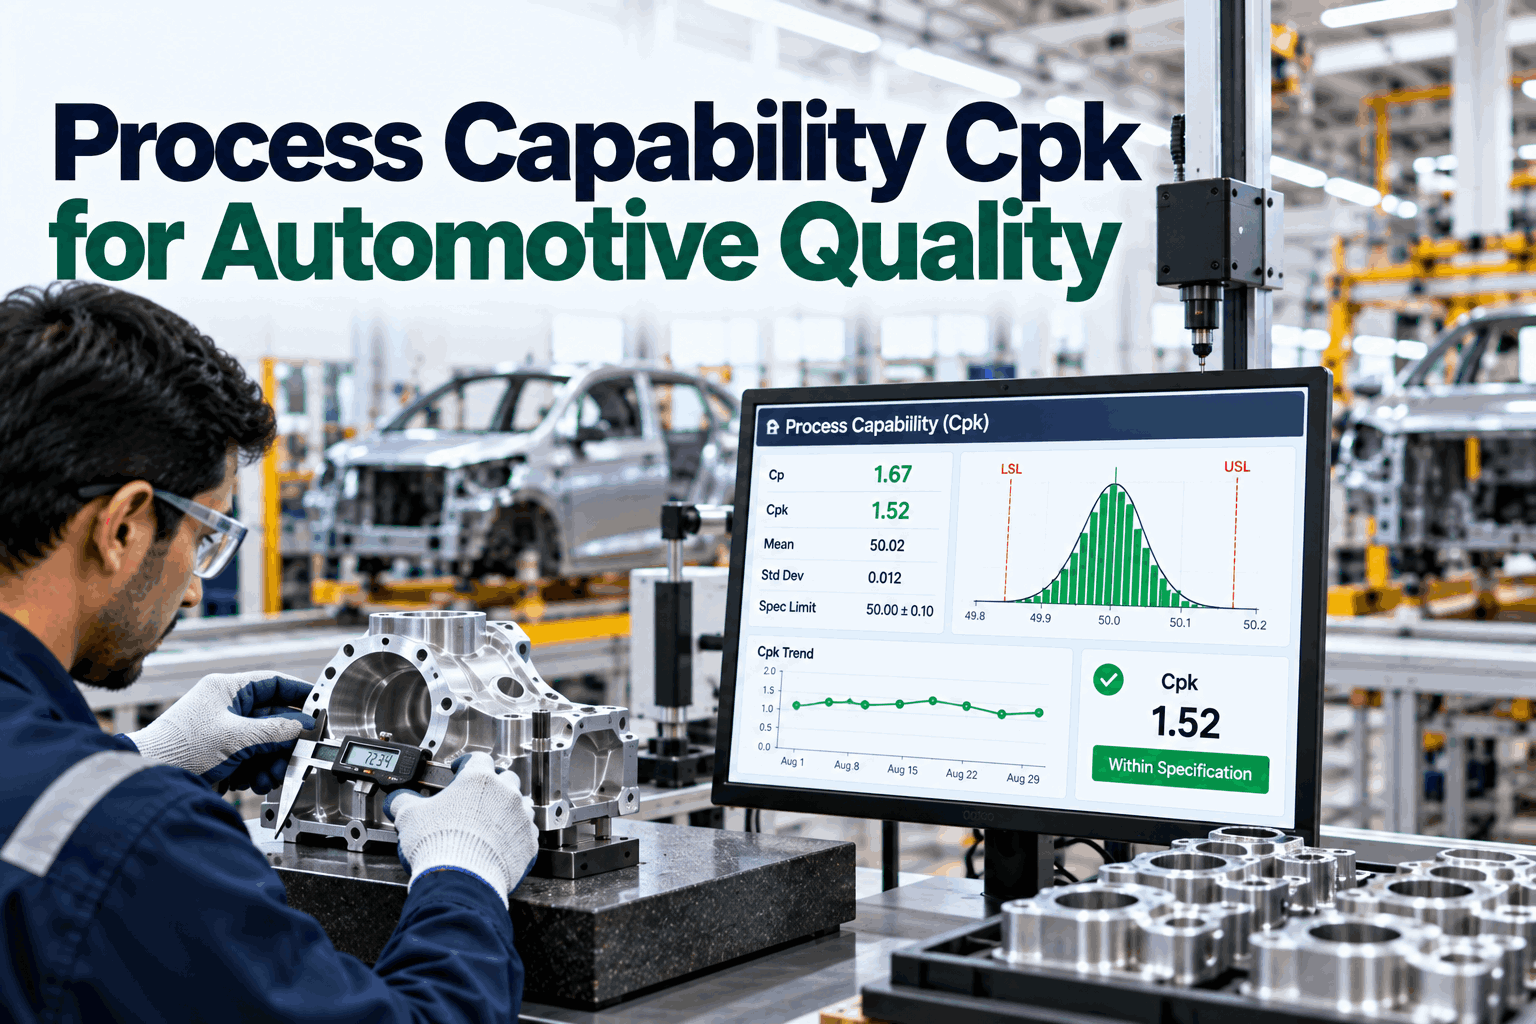
What Cpk Actually Means on an Automotive Line
1.33
Cpk minimum for normal features — roughly 63 PPM defective
1.67
Cpk for critical and safety features under IATF 16949 — about 0.6 PPM
<60%
Of the tolerance band the process spread occupies at Cpk 1.67 — real margin against drift
<1.0
Below this the process is not capable and needs 100% inspection to ship
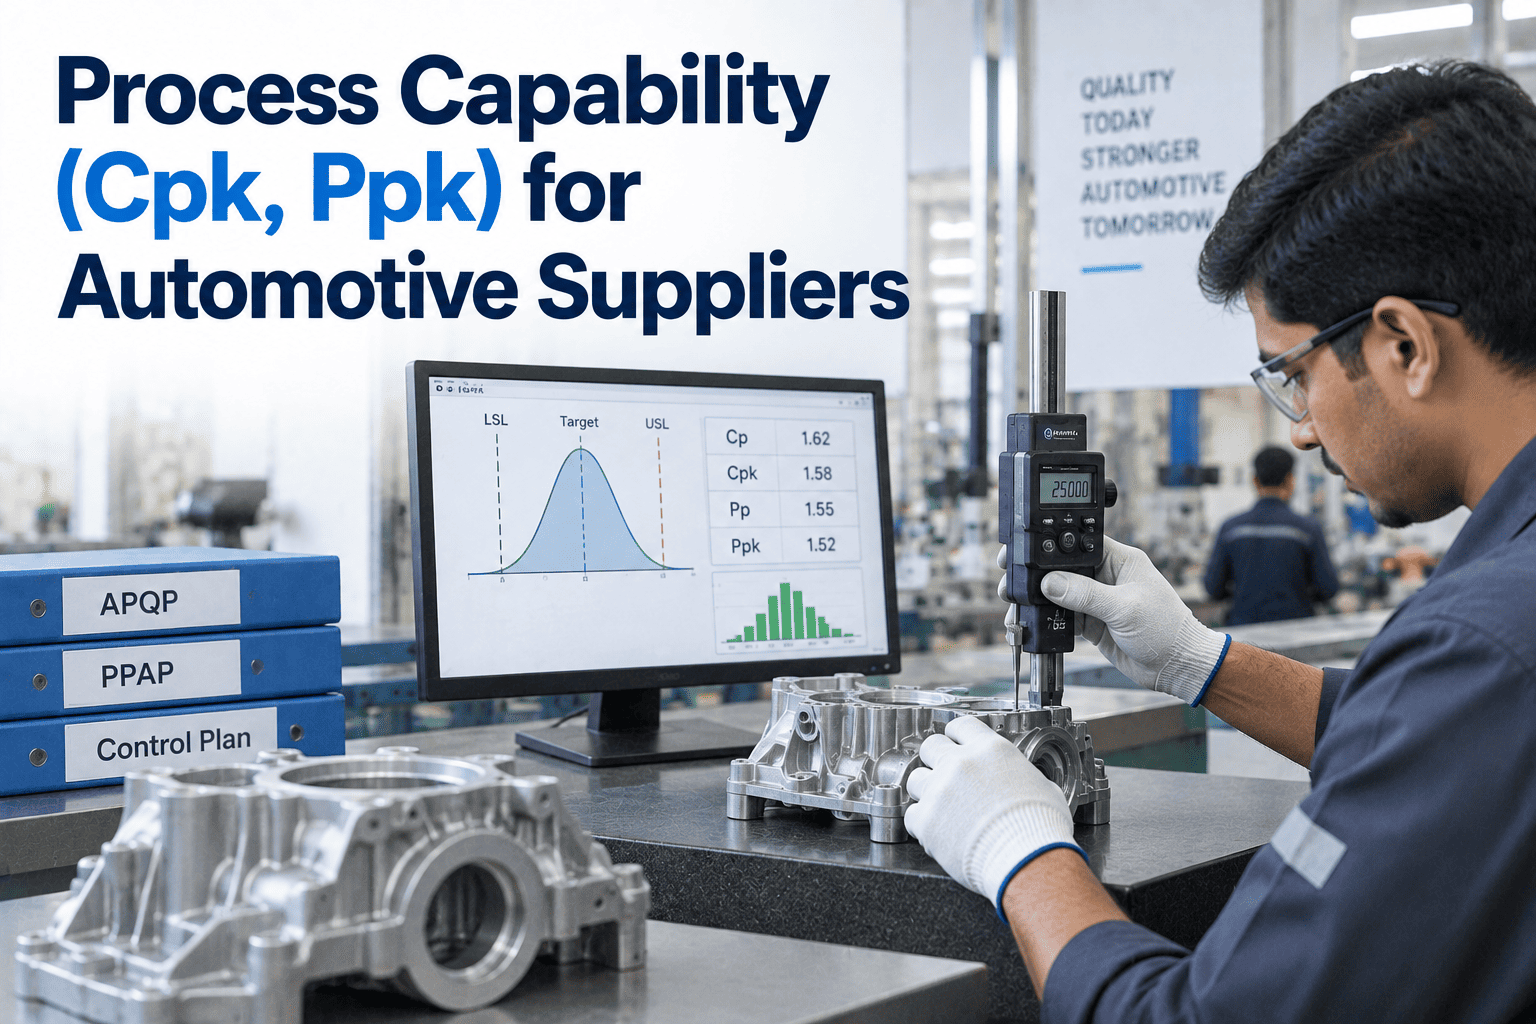
Cpk uses short-term within-subgroup variation and describes what a stable process can do; Ppk uses long-term overall variation including drift between subgroups, so it reflects delivered performance and is usually the lower, more conservative number. A process can be perfectly in control and still ship out-of-spec parts — stability without capability is the trap SPC exists to expose.
SETTING UP SPC ON A CNC LINE
From Characteristic Selection to a Capable Process
SPC on a CNC line is not a dashboard you switch on — it is a sequence, and skipping a step is how plants end up with charts nobody trusts. These five steps build a control system that produces the statistical proof an automotive customer actually audits.
1
Select the Characteristics That Get Charted
A part has dozens of features, each with diameter, position, cylindricity, and surface-finish characteristics — you cannot chart them all. The control plan names the critical and safety characteristics that get SPC: the bore that sets ring seal, the deck flatness that governs the head gasket, the dowel positions that locate the whole assembly. IATF 16949 requires every one of these to have a documented monitoring strategy.
2
Choose the Chart and the Sampling Plan
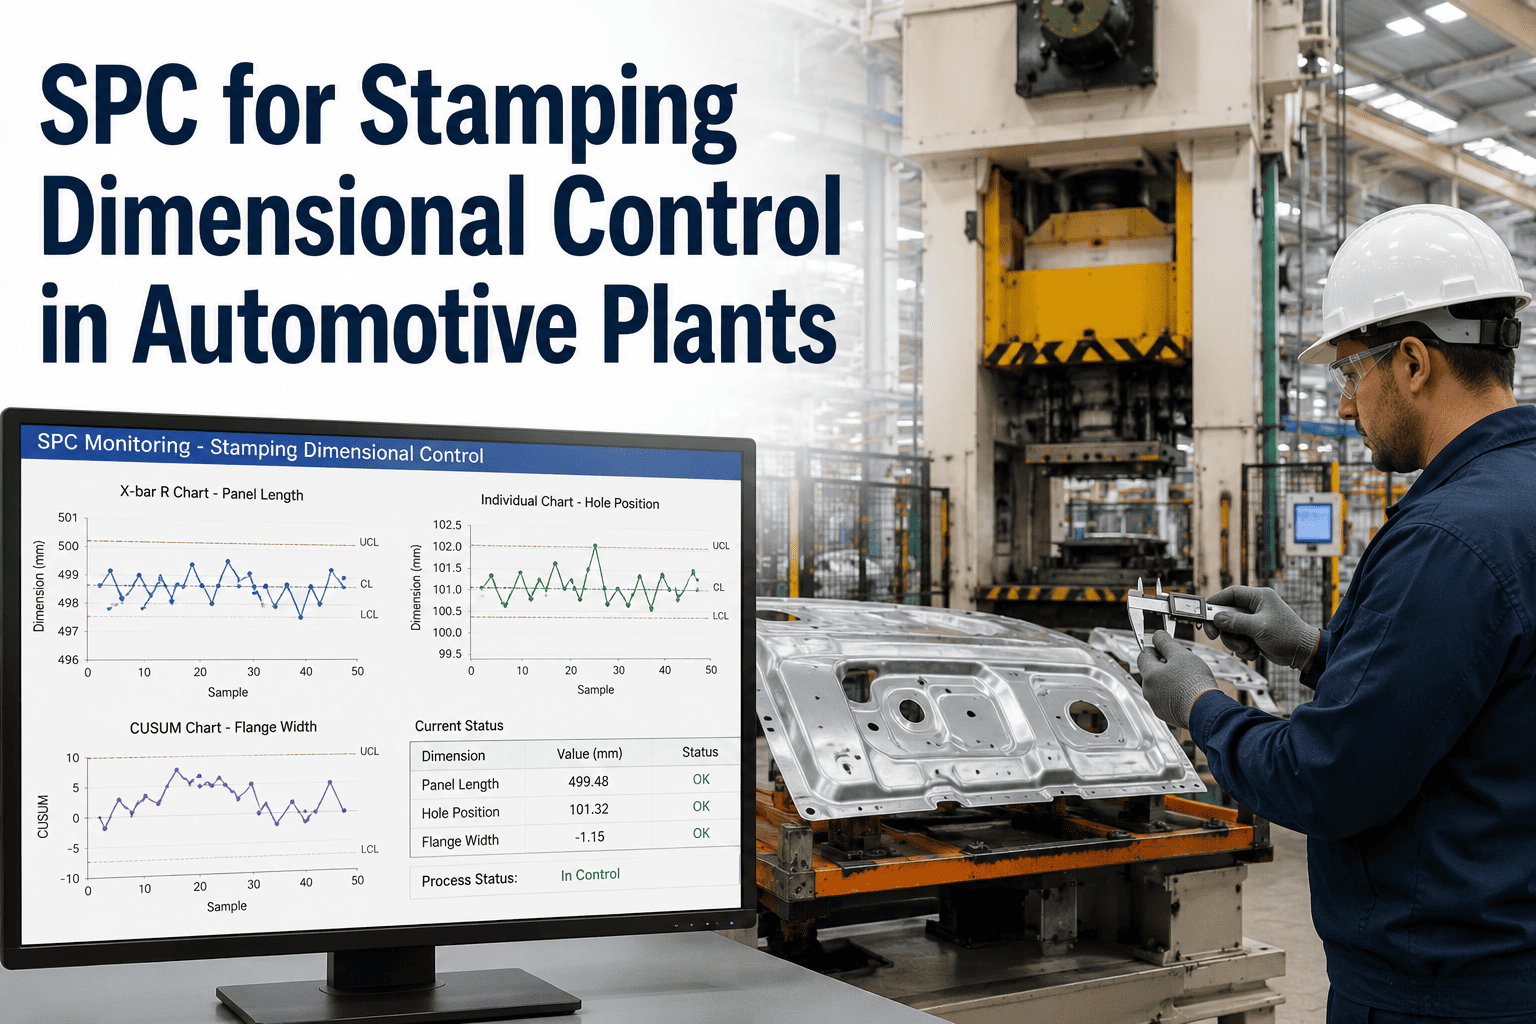
For continuous CNC dimensions the standard is an X̄-R chart with a subgroup of five parts taken consecutively every 25 to 50 parts — capturing within-subgroup variation on the X̄ chart and between-subgroup trends on the R chart. This sampling replaces 100% inspection while still catching the drift that matters.
3
Establish Control Limits From a Stable Baseline
Run at least 25 subgroups — 125 parts — under stable conditions without adjusting the process, so you measure the natural variation rather than your reaction to it. Control limits come from that data, not from the specification: on the X̄ chart, X̿ ± A₂R̄, and on the R chart, D₄R̄ for the upper limit. Control limits are not spec limits, and confusing the two is the most common SPC error on a machining line.
4
Calculate Cpk — and Read What It's Telling You
Cpk is the minimum of (USL − X̄)/3σ and (X̄ − LSL)/3σ, so it captures both spread and centering. A bore running Cpk 1.22 because the mean sits 0.003mm off-center would reach Cpk 1.39 from a single tool-offset adjustment that re-centers it — the same process, more capable. Simple pass/fail inspection never reveals that gap; Cpk does.
5
Close the Loop With In-Process Probing
After machining the critical bore, the CNC probe measures the actual diameter in the machine, the reading is logged, and a developing trend triggers a tool-offset adjustment before the dimension reaches the spec limit. This is what turns SPC from a record of what already happened into a control that prevents the next bad part.
Turn CNC probe data into live SPC charts
iFactory connects to your CNC probing and CMM data, builds the X̄-R and Cpk charts per critical characteristic, and flags drift before a dimension leaves the tolerance band.
WHAT ERODES CNC CAPABILITY
The Three Drifts That Pull Cpk Down
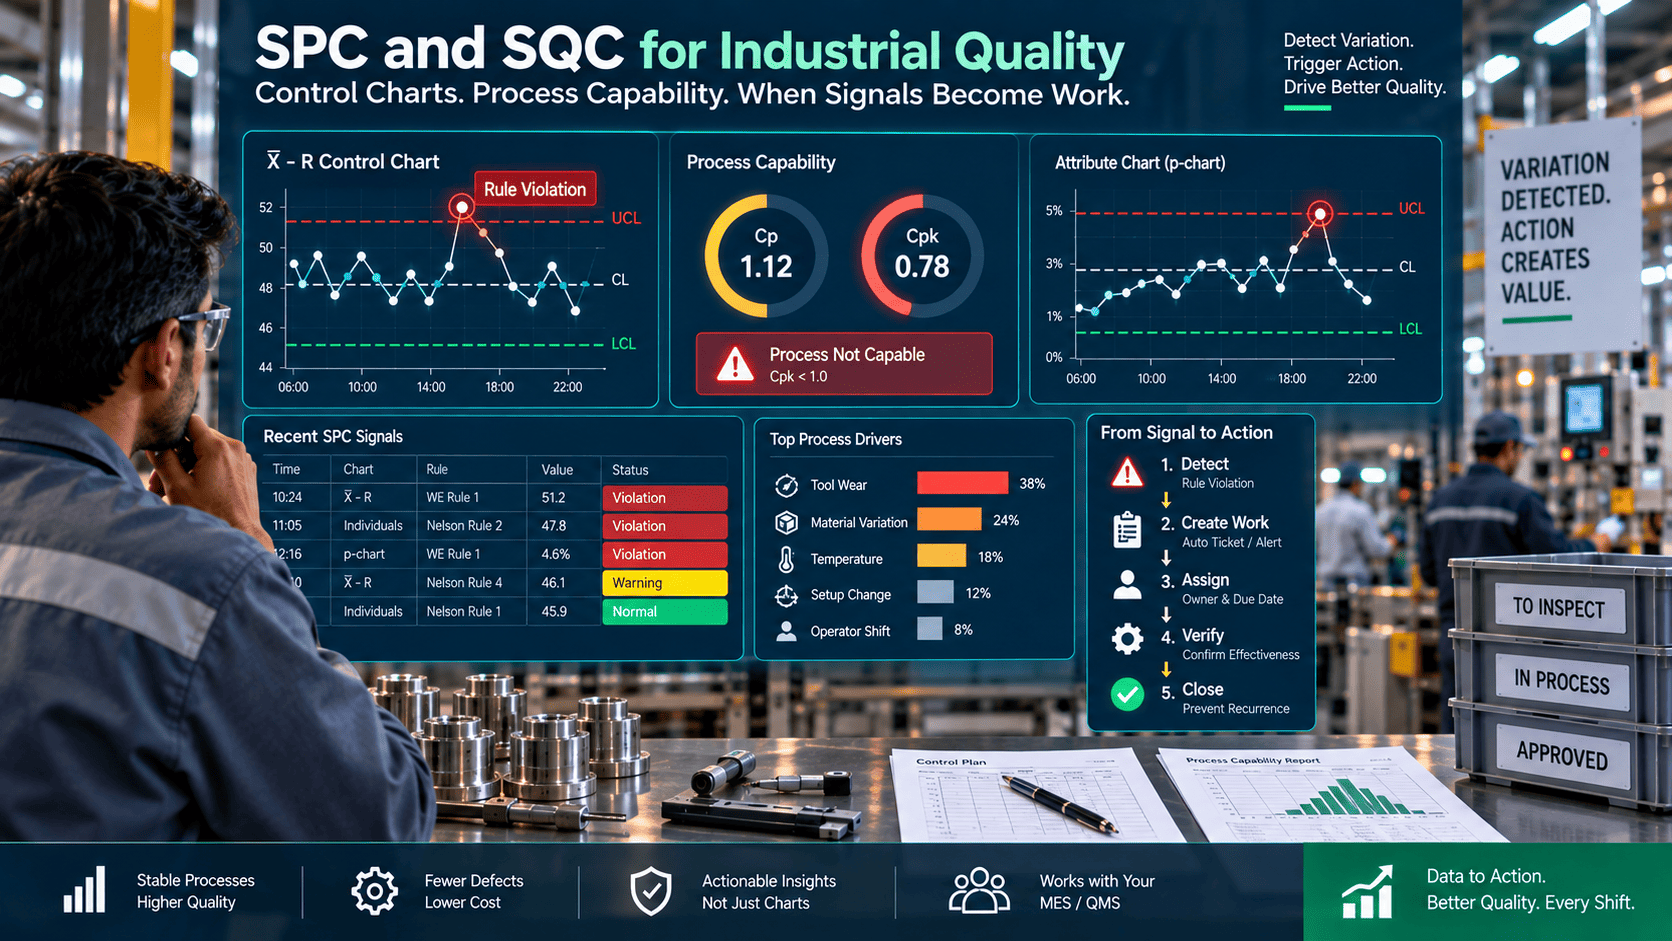
CNC capability rarely collapses in one event — it erodes through three predictable drift mechanisms, each with a signature on the control chart and each addressable once SPC makes it visible.
Tool Wear Drift
Chart signature: a slow, one-direction trend
Tool wear is monotonic and predictable — a bore gradually grows, a turned diameter gradually shrinks. Seven consecutive rising points on the X̄ chart is the classic tool-wear trend, and SPC catches it well before the dimension reaches the limit, enabling a proactive offset adjustment rather than a reactive scrap event.
Thermal Drift
Chart signature: shift after warm-up or ambient change
As a machine heats through a production run, its dimensions shift, and an ambient swing between shifts moves them again. This shows up as a sustained level change on the X̄ chart, and pairing SPC with in-process probing lets the control compensate for the thermal state rather than chase it after the fact.
Material Variation
Chart signature: increased subgroup range
Incoming stock hardness and cast-condition variation change how the tool cuts, widening the spread rather than shifting the mean. That shows up on the R chart as increased range, and separating it from tool and thermal effects is exactly what having both charts, rather than a single number, makes possible.
CHARTING BY COMPONENT
The Critical Characteristics on Common Automotive Castings
Every machined automotive component carries its own set of make-or-break dimensions. These are the characteristics that most often earn a control chart, and why each one is capability-critical.
| Component |
Critical Machined Characteristics |
Why It's Capability-Critical |
| Engine Block |
Cylinder bore diameter and cylindricity, deck flatness, main bearing bore alignment |
Bore geometry sets ring seal and oil control; deck flatness governs the head-gasket seal |
| Cylinder Head |
Valve seat concentricity, deck flatness, cam bore alignment, port dimensions |
Seat and cam geometry drive valvetrain sealing and timing; a scrap head is high-value loss |
| Transmission Casing |
Bearing bore diameters and positions, mating-face flatness, dowel locations |
Bore position controls gear mesh and shaft alignment; face flatness prevents fluid leaks |
| Crankshaft / Camshaft |
Journal diameters, roundness, concentricity, surface finish |
Journal geometry and finish determine bearing life and NVH performance |
Prove your process stays capable, part after part
Automotive customers want statistical evidence, not just conforming samples. iFactory produces the audit-ready Cpk and Ppk records IATF 16949 expects, from your own machine data.
FREQUENTLY ASKED QUESTIONS
Common Questions About SPC for CNC Machining
What's the difference between Cpk and Ppk, and which does my customer want?
Cpk uses short-term, within-subgroup variation and tells you what your process is capable of when it is stable, while Ppk uses long-term, overall variation that includes the drift between subgroups, so it reflects actual delivered performance across a whole lot. Ppk is usually the lower, more conservative number. Most automotive PPAP submissions ask for Ppk on initial runs and Cpk for ongoing production, but the specific requirement is customer-specific, so confirm it against the control plan and the customer's PPAP manual rather than assuming.
Why not just run 100% inspection instead of SPC sampling?
100% inspection tells you which parts are bad after they are made; it does not tell you the process is about to make bad parts, and at 50,000 parts a month it is slow and expensive. SPC sampling — a subgroup of five every 25 to 50 parts — catches the drift trend before a single part goes out of tolerance, which is the whole point. A process below Cpk 1.0 does need 100% inspection to ship safely, but the goal of SPC is to get capability high enough that sampling is sufficient and inspection is the exception, not the rule.
My process is in control but still producing marginal parts — how?
This is the classic stability-without-capability trap: control limits describe what your process naturally does, while specification limits describe what the customer will accept, and the two are completely independent. A process can sit perfectly between its control limits — statistically stable — while those limits fall outside the tolerance band, meaning it stably produces out-of-spec parts. That is exactly why capability indices exist alongside control charts; the chart proves stability, and Cpk proves the stable process actually fits inside the tolerance.
How does SPC actually help with tool wear on a CNC machine?
Tool wear in CNC is monotonic and predictable — a bore grows or a turned diameter shrinks in one direction as the insert wears, which shows up as a steady trend on the X̄ chart, often flagged as seven consecutive points moving the same way. Because the trend appears well before the dimension reaches the spec limit, it triggers a proactive tool-offset adjustment that re-centers the process, rather than a reactive scramble after scrap appears. Paired with in-process probing, the measurement and the correction happen in the machine, closing the loop automatically.
Do the AIAG-VDA SPC changes affect how we set this up?
AIAG and VDA released a harmonized SPC draft in 2026 that refines how capability, stability, and control-chart selection are interpreted, including a more statistical view where a smaller sample may require a higher observed index to support the same confidence. The core mechanics in this guide — X̄-R charts, stable baselines before capability conclusions, Cpk and Ppk — remain the foundation. Because implementation should be confirmed against the final published manual and your customer-specific requirements, the practical move is to make sure stability evidence is documented before capability is claimed and that out-of-control rules are configured consistently across lines.
Contact our support team to review your current SPC configuration.
STABLE, CENTERED, AND PROVABLY CAPABLE
Build SPC That Holds CNC Capability Above 1.67
Every critical dimension on every casting, charted, centered, and monitored against the drift that pulls capability down. iFactory turns your CNC probe and CMM data into live X̄-R and Cpk charts — with the audit-ready records IATF 16949 expects.