Every SPC chart shows two things at once: the process and the gauge that measured it. When the gauge adds too much noise, operators chase false alarms, real shifts hide and Cpk looks worse than it is. This guide shows how to run MSA and gage R&R properly so your automotive SPC data can be trusted. Start with a gauge review.
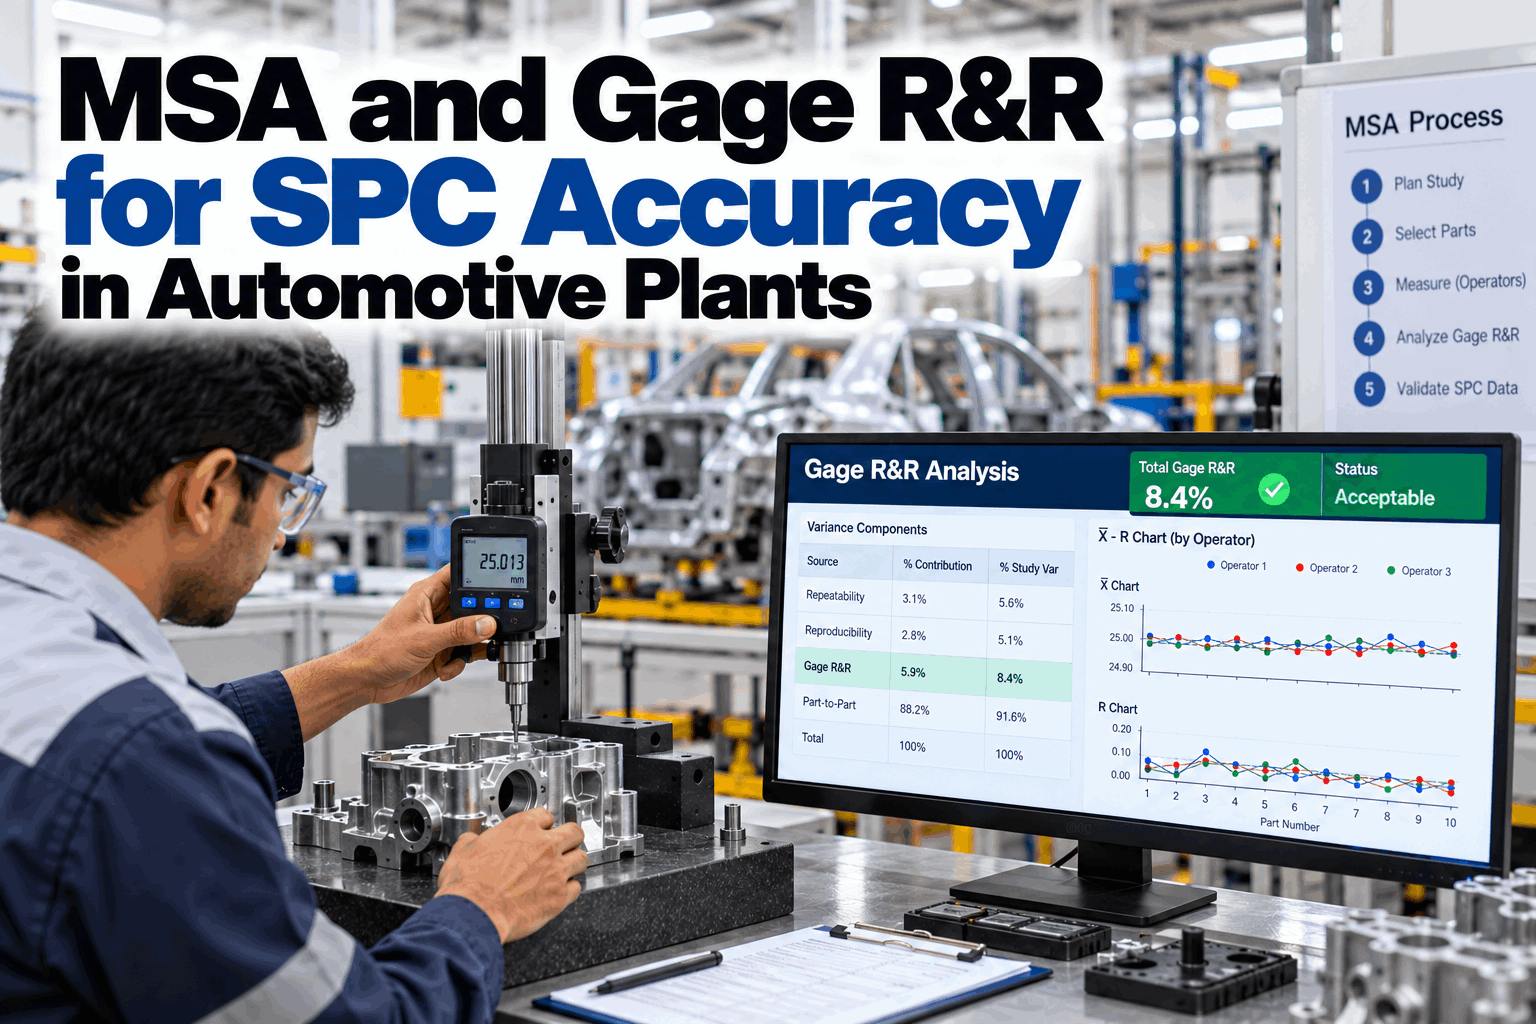
MSA and Gage R&R for SPC Accuracy in Automotive Plants
Before a chart can tell you anything about the process, the measurement has to be good enough to see it. Learn which MSA studies to run, how to set up a gage R&R that holds up in an audit and what to fix when a gauge fails.
- How measurement error distorts SPC and Cpk
- How to design a gage R&R study that counts
- What to fix when repeatability or reproducibility fails
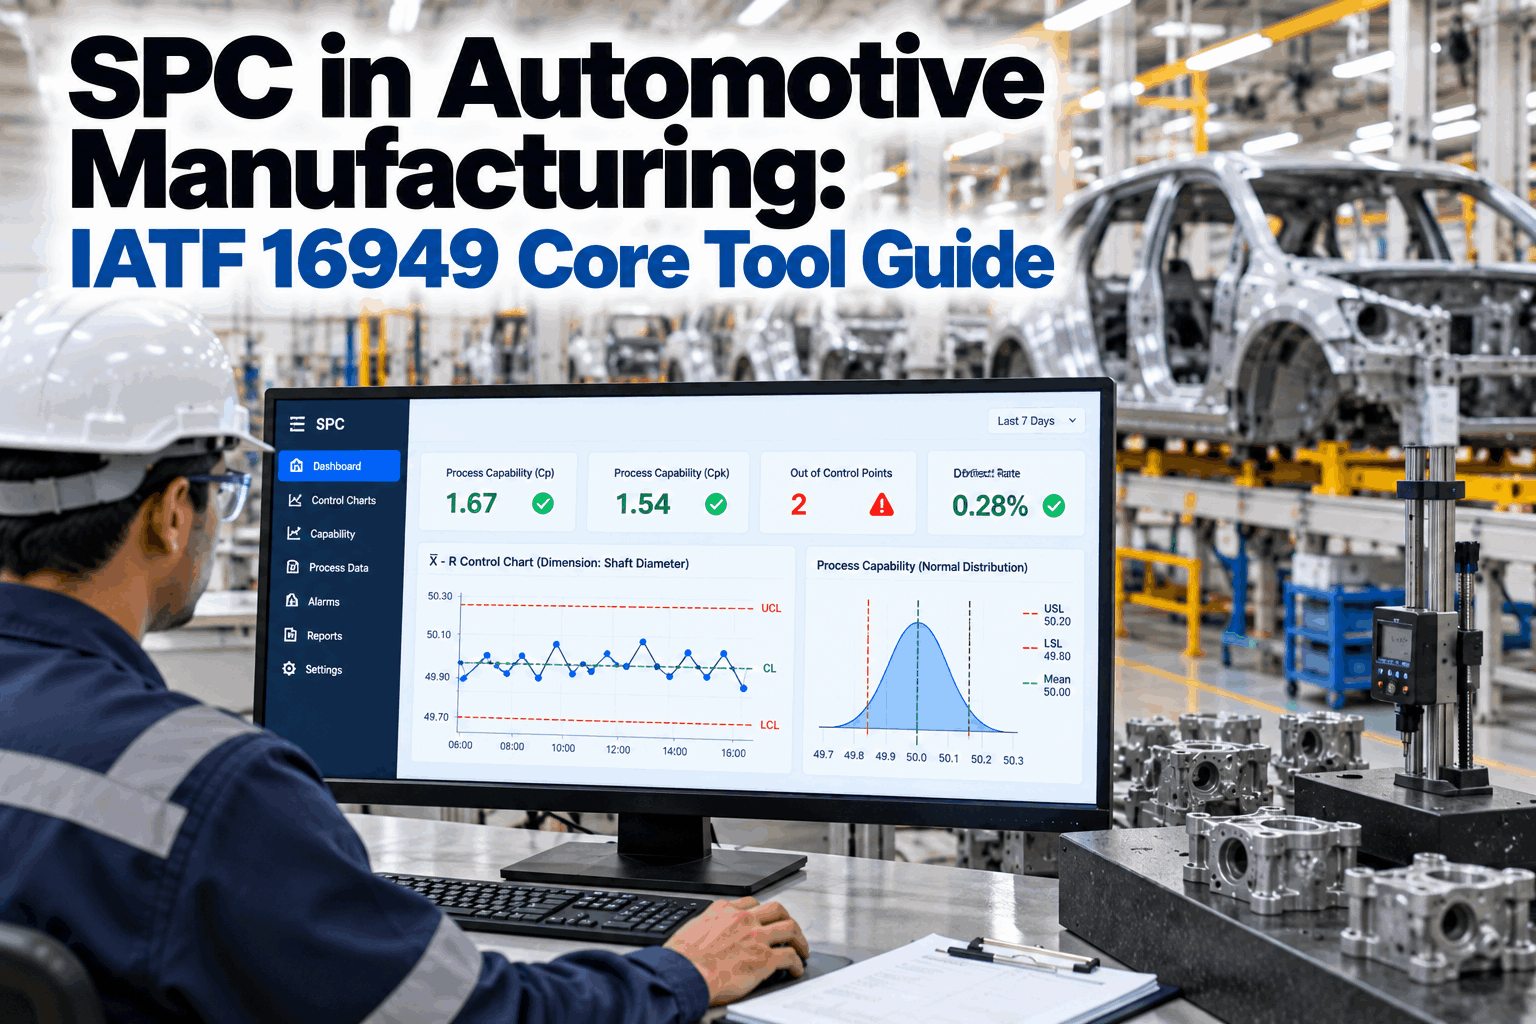
Why a Weak Gauge Makes Every SPC Chart Lie
You cannot control what you cannot measure reliably.
Variation adds up. The spread on your chart is the spread of the parts plus the spread of the measurement. When the measurement part is large, three things go wrong at once, and none of them show up as a gauge problem on the chart itself. They look like process problems, so teams adjust machines that were fine. Our quality specialists can help find where this is happening on your lines.
False alarms
Gauge noise pushes points past the limits. Operators stop and adjust a process that did not move, which adds real variation.
Hidden shifts
Wide limits, inflated by measurement noise, swallow small real shifts until parts are close to the tolerance.
Wrong capability
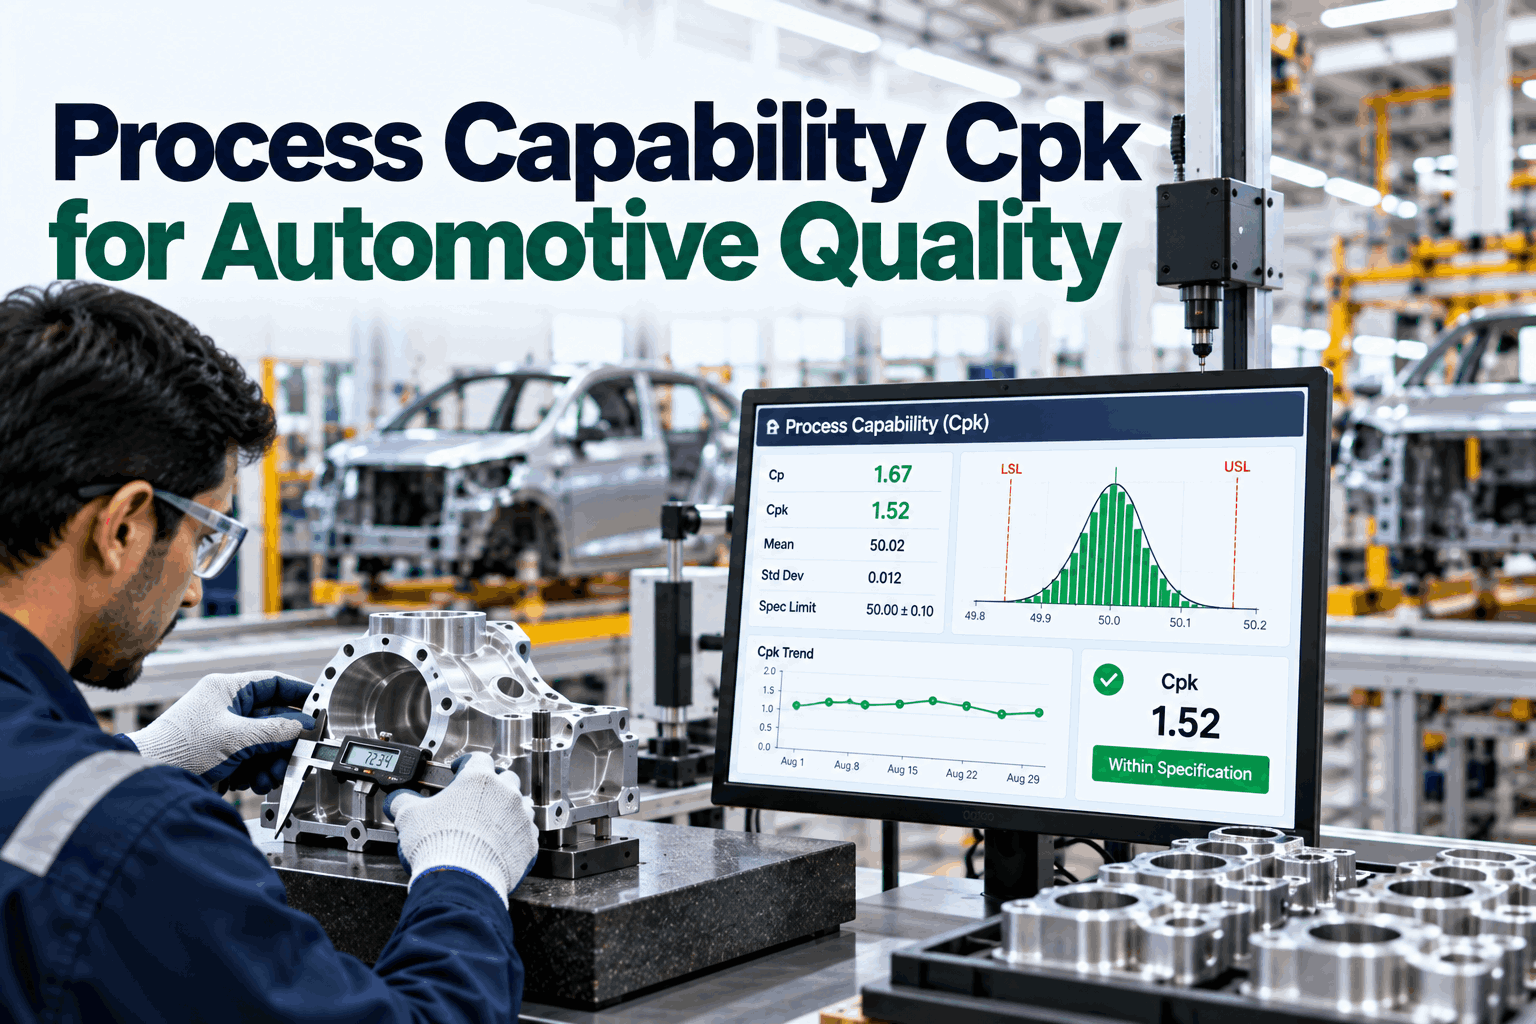
Cpk and Ppk fall because the measured spread is wider than the true spread, which can turn a capable process into a PPAP problem.
Worked example: same process, different gauges
The process below is truly capable at Cp 1.67. Only the gauge changes. Measurement spread is shown as a share of the tolerance, and the observed spread combines both sources.
When a new chart goes live, the gauge study should already be on file. If a chart starts showing odd signals, check the gauge history before touching the machine.
The MSA Studies and What Each One Answers
Gage R&R is the best known, but it is only one part of MSA.
A measurement system can be wrong in different ways. It can read high or low, read differently across its range, drift over time, scatter on repeat readings or depend on who uses it. Each study checks one of these. The AIAG MSA manual is the usual reference in automotive supply chains. To plan which studies each gauge needs, book an MSA plan session.
Clause 7.1.5.1.1 expects statistical studies on each type of inspection, measurement and test system named in the control plan. If a gauge appears in a control plan without a study on file, expect a finding.
How to Run a Gage R&R That Holds Up
A badly designed study can make a poor gauge look good.
The numbers from a gage R&R depend heavily on how the study is set up. Parts that are too alike, appraisers who know which part is which or readings taken in perfect lab conditions all give a result that will not match the line. A common design uses 10 parts, 3 appraisers and 2 or 3 trials each. Plan yours with our MSA team.
Pick parts across the range
Choose parts that cover the real process spread, not ten parts from one hour. Too-similar parts make %GRR look worse and ndc look lower.
Use the real appraisers
Pick the operators who actually measure on the line, across shifts, not only the best person in the quality lab.
Measure blind and in random order
Number the parts out of sight and mix the order each trial, so nobody remembers an earlier reading.
Match line conditions
Use the same fixture, method, temperature and part cleanliness as production. A lab result does not prove a line result. If the gauge is used on the line, run the study on the line.
Analyse with ANOVA
ANOVA separates repeatability, reproducibility and any appraiser-by-part interaction. The average and range method cannot show that interaction.
Record and act
Store raw readings, the analysis, the decision and any action. An auditor will ask for all four.
See Every Gauge's Status in One Place
Most plants know their gauges are calibrated. Far fewer can show, in one view, which control plan gauges have a current study, which ones are overdue and which ones failed.
Reading the Results Without Fooling Yourself
A single percentage is a starting point, not a verdict.
The AIAG guidelines give rough bands for %GRR, but the manual itself cautions against using them as pass and fail thresholds on their own. Look at the bands together with the number of distinct categories, what the gauge is used for and whether the result is measured against process variation or tolerance. Get a second opinion with a results review.
Generally treated as an adequate measurement system.
May be fine for some uses, depending on the characteristic, the cost of a better gauge and the risk. Decide and record why.
Needs improvement before the data is used for SPC or capability decisions.
Against process variation
Shows whether the gauge can see the part-to-part differences that SPC needs to track. Use this for SPC and capability work.
Against tolerance
Shows whether the gauge can sort good parts from bad. Use this for final inspection and conformance checks.
Number of distinct categories
The ndc estimates how many separate groups of parts the gauge can tell apart. AIAG guidance looks for 5 or more.
A gauge that uses 8% of the tolerance can still use 40% of a tight process spread. It sorts good from bad parts well, but it cannot see the small shifts SPC is meant to catch.
When a Gauge Fails: Fix the Right Thing
Repeatability and reproducibility point to different fixes.
The split between equipment variation and appraiser variation tells you where to look. Retraining operators will not fix a worn anvil, and a new gauge will not fix five people measuring five different ways. Questions on a failed study go to our support desk.
Look at the equipment
- Gauge wear, play or poor resolution
- Fixture that lets the part move
- Part dirt, burrs or temperature
- Measuring point not clearly defined
Look at the method
- Different techniques between appraisers
- Unclear or missing work instruction
- Differences in force, angle or reading
- Gaps in training across shifts
MSA Mistakes That Undermine SPC
Most bad studies are planned that way by accident.
The same habits come up in plant after plant. Each one makes the study look better or worse than the gauge really is, which defeats the point of running it. Check your studies against them with an audit prep session.
Good practice
- Parts chosen to cover the real process range
- Line operators as appraisers, across shifts
- Blind, randomised measuring order
- Study rerun after repair, relocation or a new method
Common mistakes
- Ten nearly identical parts from one batch
- Only lab technicians as appraisers
- Calibration treated as a substitute for MSA
- Studies done once at PPAP and never again
Calibration checks the gauge against a standard in ideal conditions. MSA checks the whole measurement system, including people, fixtures and the shop floor. A calibrated gauge can still fail a gage R&R.
How iFactory Protects SPC Data Integrity
Every chart linked to the gauge that fed it.
iFactory connects gauges, CMMs and PLCs to an on-prem AI platform inside your network. It runs gage R&R studies from captured readings, tracks gauge stability over time and links each SPC chart to the gauge and study behind it. When a gauge drifts or a study lapses, the charts it feeds are flagged before anyone trusts the data. Fit questions go to our solutions team.
Guided studies
Study plans with random order and blind numbering, with readings captured straight from the gauge.
ANOVA analysis
Repeatability, reproducibility, interaction and ndc calculated as soon as the last reading lands.
Stability tracking
Master part checks charted over time, with drift flagged before it affects production data.
Chart-to-gauge links
Each SPC chart shows its gauge, study result and due date, so weak data is marked on the chart.
Study scheduling
Due dates set per gauge and risk level, with reruns triggered after repairs or moves.
Cause hints
AI compares appraiser, part and fixture patterns to point at the likely source of variation.
Results depend on your gauges, fixtures and how consistently studies are run. We measure study coverage, false alarm rates and capability changes on your own data during the pilot, rather than promising a general figure.
Turnkey AI: Delivered, Connected and Live in 6–12 Weeks
You do not build this. It arrives ready.
iFactory ships as a pre-configured NVIDIA AI server with the software pre-loaded, racked and ready. Rack it, plug in power and Ethernet, and the AI is live on your network. Our team handles cabling, network setup, PLC, SCADA, gauge and CMM integration, operator training and 24×7 remote monitoring. Data stays on your network. For a scope matched to your plant, request a turnkey quote.
Ship, network and data
Server installed. Gauges, CMMs and PLCs connected. Gauge register and control plans loaded.
Model training and pilot
First guided studies run. AI trained on your gauge and chart history. Pilot live on one line.
Go-live and training
Chart-to-gauge links live. Quality engineers and operators trained. 24×7 monitoring begins.
Frequently Asked Questions
What is MSA in automotive manufacturing?
Measurement system analysis checks whether a gauge, together with the people, fixtures and method that use it, gives readings good enough for the decisions made from them. It covers bias, linearity, stability, repeatability, reproducibility and attribute agreement.
Is MSA required by IATF 16949?
Yes. Clause 7.1.5.1.1 expects statistical studies on each type of inspection, measurement and test system identified in the control plan. Many customers also require the AIAG MSA manual methods through their customer-specific requirements.
What %GRR is good enough?
AIAG guidance treats under 10% as generally adequate, 10% to 30% as possibly fine depending on the use and over 30% as needing improvement. The manual also warns against using these bands alone, so record the decision and the reason.
How many parts, appraisers and trials should a gage R&R use?
A common design is 10 parts, 3 appraisers and 2 or 3 trials. The parts matter most: they should cover the real process range, or the results will mislead.
What is ndc and why does it matter?
The number of distinct categories estimates how many separate groups of parts the gauge can tell apart within the process spread. AIAG guidance looks for 5 or more. Fewer means the gauge cannot see enough detail for SPC.
How often should gage R&R studies be repeated?
After any change to the gauge, fixture, method or location, and on a schedule set by risk for critical characteristics. Many plants also repeat studies when SPC charts start showing unexplained signals.
How do we get started?
Start with the gauges that feed charts on special characteristics. A 6-week pilot connects those gauges, runs guided studies and links each chart to its study. To plan it, contact our team.
Trust the Numbers Behind Every Chart
In thirty minutes we look at your gauge register, recent studies and the charts they feed. You keep the notes whether or not you go further with iFactory.
- 1Your gauge register with study dates
- 2Two or three recent gage R&R reports
- 3A control plan with special characteristics
- 4A chart that gives you false alarms
- 5Customer-specific MSA requirements