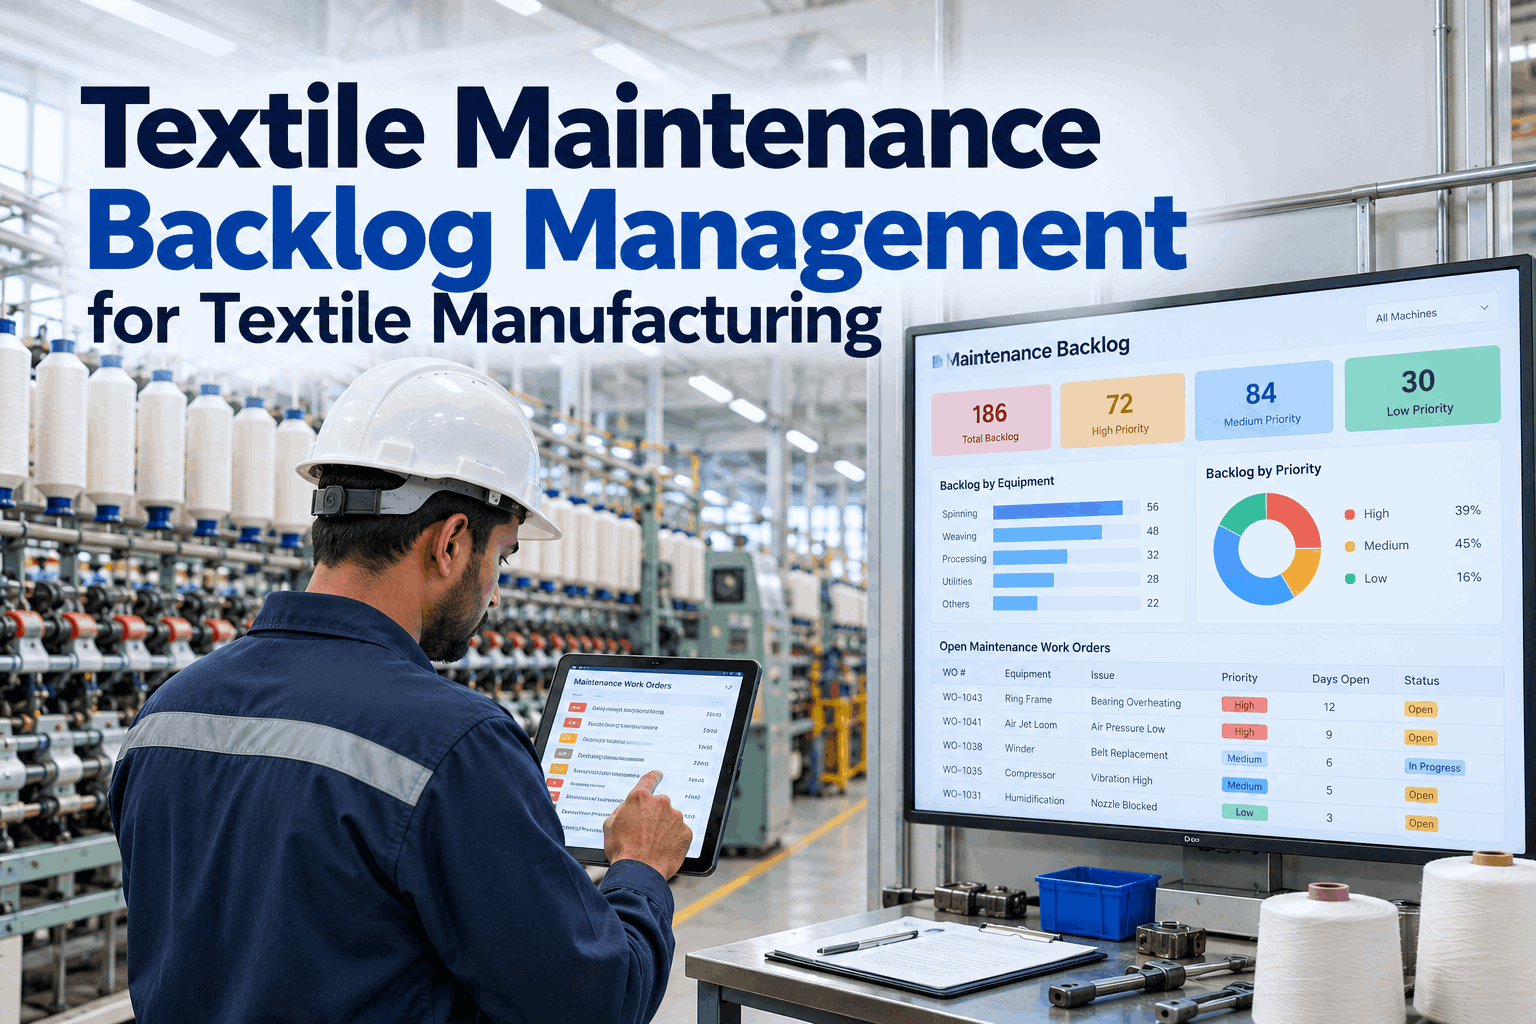
A textile mill's maintenance backlog grows quietly: a loose loom guard here, a noisy winding drum there, a ring frame running with worn aprons because the job never got scheduled. Each one looks minor, but together they show up as yarn faults, fabric defects and breakdowns that should have been prevented. Managing the backlog by risk rather than by date keeps the important jobs moving, and you can see how in a short live demo.
Turn a Growing Maintenance Backlog Into a Ranked, Risk-Based Plan
iFactory scores every open work order by its risk to safety, quality and production, shows how many weeks of work are waiting, and moves the right jobs into the next shutdown or doff window, so the backlog shrinks where it matters most.
Target range: 2–4 weeks
Ready Backlog, Total Backlog and Why Weeks Matter More Than Counts
Backlog is all the identified maintenance work that hasn't been done yet. A count of open work orders tells you little, because 140 small lubrication jobs and 140 gearbox overhauls are very different workloads. Measuring backlog in weeks of crew capacity makes it meaningful, because it answers the question managers actually care about: how long would it take to clear everything if no new work arrived? A commonly cited guideline is to keep total backlog at around two to four weeks of crew hours. Much less suggests the crew may be underused or that problems aren't being reported. Much more means work is piling up faster than it can be done. If you'd like to measure your current position, our support team can help.
Jobs with parts on hand, a plan and an estimate, waiting only for a crew and machine time. This is the work you can schedule next week.
Ready backlog plus jobs waiting for planning, parts, shutdowns or approval. This shows the full size of the problem.
Five Reasons Mills Fall Behind on Maintenance Work
Textile mills have features that make backlog especially easy to accumulate. Recognizing them helps explain why simply working harder rarely closes the gap. Most of them are about timing and planning rather than effort, so the fix is in how work is organized. If several of these sound familiar, our reliability specialists can help you plan a recovery.
A Backlog Only Shrinks When Inflow Falls Below Completion
Backlog behaves like a tank. Work flows in from operator reports, inspections, condition alerts and PM findings, and flows out as jobs are completed. If the crew completes 300 hours a week and 340 hours of new work arrive, the backlog will grow no matter how hard people try. Tracking both flows each week shows whether the problem is capacity, a surge in breakdowns or a planning bottleneck. You can see both flows charted from your own work orders in a data review.
Operator defect reports, autonomous maintenance tags, PM inspection findings, vibration and temperature alerts, quality complaints traced to machines, and improvement ideas. Knowing the mix shows which source to work on first.
Breakdowns pulling technicians away, parts not ready, no machine window, missing skills on a shift, and jobs without a clear plan. Each one needs a different fix.
Rank Jobs by Consequence and Likelihood, Not by Who Shouts Loudest
A simple risk matrix gives every job a priority based on two questions: how bad would it be if this fails, and how likely is it to fail before we get to it? Consequence covers safety, product quality and lost production. Likelihood comes from equipment condition, age and failure history. Using the same matrix for every job makes priorities consistent across shifts and supervisors. In textile mills, quality consequences deserve particular weight, because a worn part can keep a machine running while it quietly produces faulty yarn or fabric for days. You can see risk scoring on your own work orders in a working session.
See Which Backlog Jobs Carry the Most Risk Today
iFactory scores open work orders from equipment condition, failure history and production impact, then proposes the next week's schedule around doffs, beam changes and planned stops.
Watch How Long Jobs Have Been Waiting
A healthy backlog turns over. Jobs come in, get scheduled and get done, usually within a few weeks of being raised. Jobs that sit for months are a warning sign. Either they don't matter and should be closed, or they matter and are being neglected. Tracking backlog by age and priority together shows which. An old P4 improvement idea is not a concern, but an old P2 job on a carding machine probably is. If you'd like to review your oldest jobs, book a short session.
Normal flow. Most jobs should be here.
Check whether jobs are waiting on parts or windows.
Escalate P1 and P2 jobs and review the rest.
Do it, schedule it for a shutdown, or close it.
A Five-Step Backlog Review That Keeps It Under Control
Backlog control is a routine, not a one-off cleanup. Mills that clean up once without a routine usually find the backlog back at the same size within a few months. A short weekly meeting between maintenance planning, production and stores, using the same ranked list, keeps the backlog honest and the schedule realistic. Thirty minutes is usually enough when the list is already ranked and the data is current, rather than assembled by hand before the meeting. Our reliability specialists can help you set up the routine.
Check that each new job is real, not a duplicate, and has a clear description, machine and priority.
Add tasks, hours, skills and parts, so the job can move into ready backlog.
Confirm parts are in stock or ordered, and reserve them for the job.
Match ready jobs to doffs, beam changes, style changes and planned stops.
Check weeks of backlog, age profile and the P1 and P2 count against targets, and adjust crew or overtime if needed.
Four Backlog Measures Worth Reviewing Every Week
A single backlog number hides too much. These four measures together show whether the backlog is healthy, growing or hiding risk, and they can all be calculated automatically from work order data. Our support team can help set targets for your mill.
Four Backlog Habits That Hide the Real Risk
A backlog list can look under control and still hide serious risk. These habits are the usual reasons, and they often develop gradually as teams try to manage a list that has grown too long to read. Each is easy to spot once the backlog is measured in weeks, ranked by risk and tracked by age, and each one quietly undermines trust in the list. You can see these checks running automatically in a guided demo.
Backlog Analytics, Data Connections and AI Server in One Package
iFactory delivers backlog management as a turnkey bundle. A pre-configured NVIDIA AI server ships racked and ready with the software pre-loaded. You rack it, plug in power and Ethernet, and the AI is live. To scope it for your mill, request a turnkey quote.
- Pre-configured NVIDIA AI edge server, racked and ready
- Connectors for your CMMS, machine data and stores
- Risk matrix and priority rules configured to your mill
- Cabling and plant network setup
- Backlog dashboards by weeks, age and priority
- Training for planners, supervisors and managers
- 24×7 remote monitoring
Server installed, work orders and machine data connected, backlog cleaned.
Risk scoring applied, first weekly reviews run with the new ranked list.
All departments live, targets set, teams trained on the routine.
Backlog Management Built for Textile Mills
iFactory turns a long list of open work orders into a ranked, scheduled plan tied to how the mill actually runs, so planners spend their time deciding rather than sorting. Our support team can review your current backlog before a pilot.
What Textile Maintenance Managers Ask About Backlog
Make the Backlog Smaller Where It Matters Most
Measure backlog in weeks, rank every job by risk, match ready work to production windows and clean out stale jobs. The full system is delivered turnkey and goes live in 6 to 12 weeks.