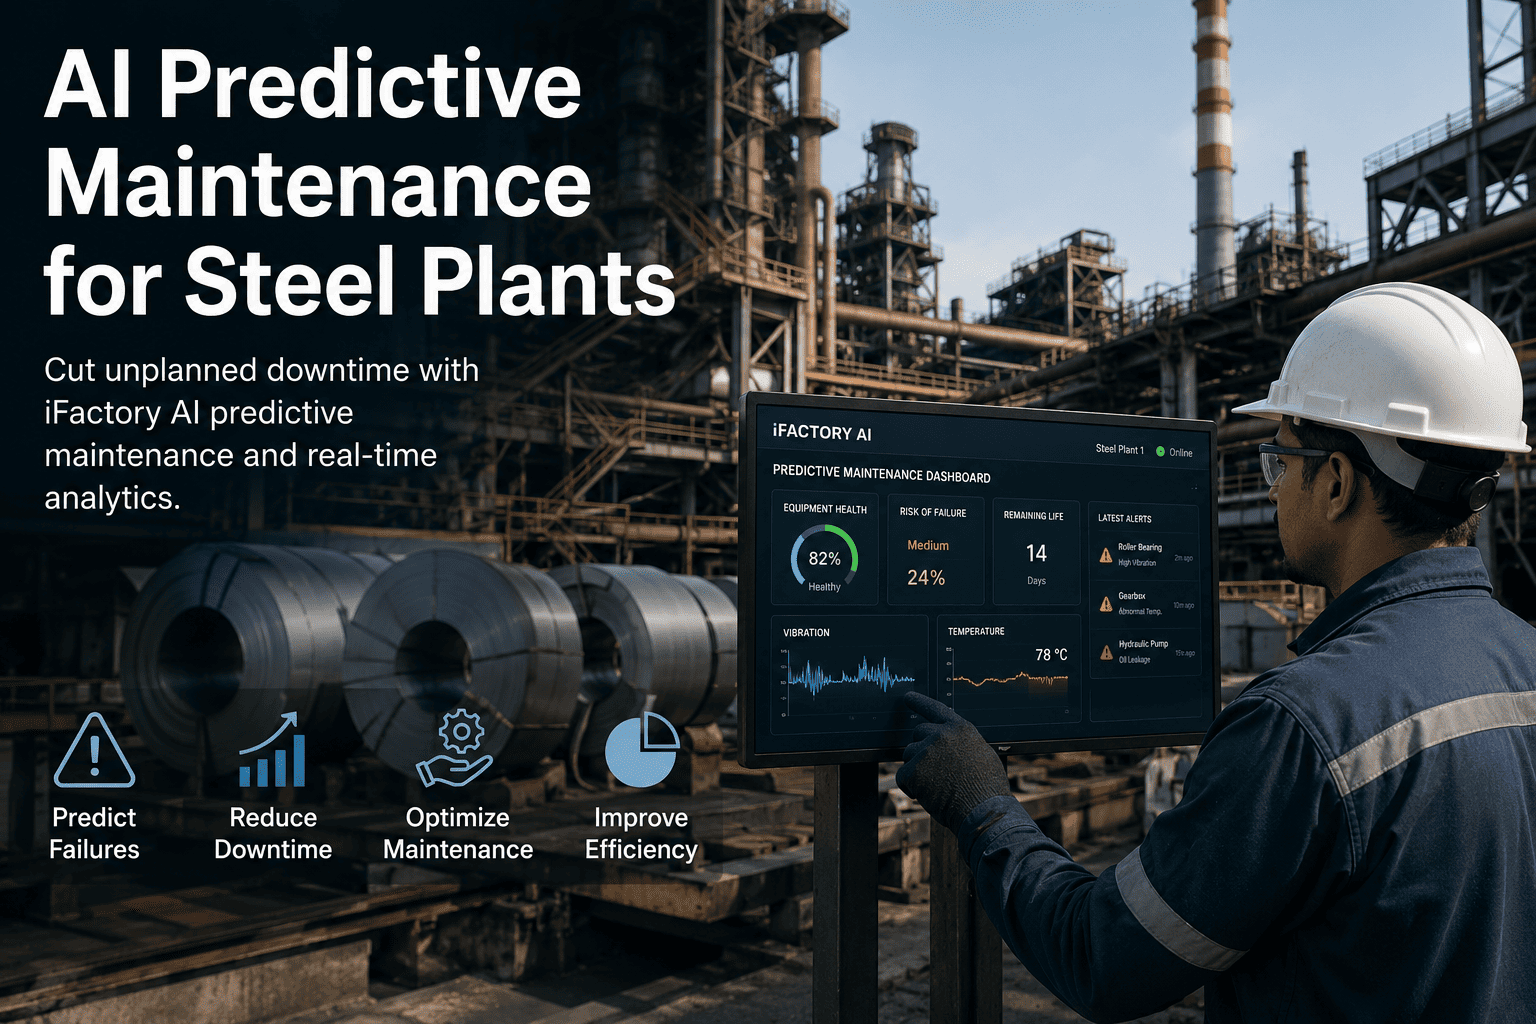
When a continuous caster's bearing seizes mid-pour, the line doesn't just stop — the tundish freezes, the slab cracks against the rollers, and a thirty-minute bearing replacement becomes a fourteen-hour metallurgical recovery. In integrated steelmaking, a single unannounced failure cascades into days of lost throughput. iFactory's AI predictive maintenance platform watches the vibration, thermal, and pressure signatures of every critical asset — rolling mills, reheat furnaces, hydraulic skids, conveyor drives — and forecasts failures weeks before they cross the threshold of no return, so interventions land inside planned stoppages instead of on top of production schedules.
PREDICTIVE MAINTENANCE / STEEL
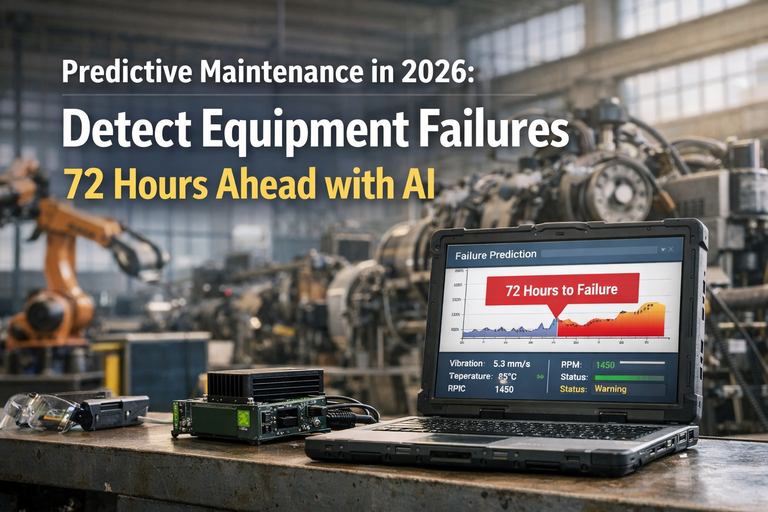
Forecast asset failure weeks before it halts the line.
Continuous condition monitoring and remaining-useful-life estimation across rolling mills, furnaces, conveyors, and hydraulic systems — tuned to the duty cycles of steelmaking, deployed on a pre-configured NVIDIA AI server racked inside your plant network.
The failure curve: from healthy signature to catastrophic seizure
A rolling-mill bearing does not fail at random. It moves through four regimes — baseline, drift, degradation, failure — each leaving a measurable signature in vibration spectral energy. The window where intervention is cheap is the drift phase, which is also the window the human ear cannot detect.
Vibration RMS trend — rolling mill drive-side bearing
Detected by iFactory AIDetected by threshold alarm
7 days
Lead time gained by AI detection over threshold alarm
Drift phase
Where bearing replacement costs 1/8th of a recovery
What the platform watches across the plant
Steel assets fail by different physics. A hydraulic press leaks pressure; a reheat furnace drifts off its combustion curve; a conveyor gearbox sheds gear-mesh harmonics long before oil debris spikes. iFactory applies the right model to each asset class rather than one generic anomaly threshold.
Pressure ripple, actuator cycle time, fluid particulate trend
Failure mode: seal degradation, valve stiction, pump cavitation
Electrical & VFD drives
Current harmonics, insulation partial discharge, thermal load
Failure mode: winding degradation, IGBT stress, bus ripple
Reactive repair vs. AI-scheduled intervention
The economics of maintenance in a steel plant are dominated not by the part cost but by the production window in which the repair lands. The same bearing swap costs 8 times more when it forces a line stop than when it slots into a planned outage.
REACTIVE — UNPLANNED
Bearing fails mid-cast
14h line stop
Slab scrap recovery
Overtime crew call-in
Expedited part freight
Total cost impact
8.0x baseline
VS
AI-SCHEDULED — PLANNED
Bearing swapped in outage
1.8h planned stop
No scrap
Day crew
Stocked part
Total cost impact
1.0x baseline
Bars are proportional to cost impact. The same physical repair — one bearing, one crew, one torque spec — costs roughly eight times more when it interrupts a cast than when it lands inside a scheduled 8-hour mill stop.
Remaining-useful-life ranking, by production impact
Not every asset matters equally. A failing conveyor on the scrap yard can be bypassed; a failing pinion on the finishing mill cannot. iFactory ranks each asset by remaining useful life weighted by production criticality, so the reliability team knows which intervention earns its place in next week's outage window.
Asset
Current RUL
Confidence
Production criticality
Intervention window
F1 finishing mill pinion — drive side
9 days
High
Next planned stop (Day 6)
Caster segment 4 — inner bearing
14 days
High
Next planned stop (Day 6)
Reheat furnace zone 3 burner
26 days
Medium
Month-end outage
Hydraulic pump H-2 — main press
41 days
High
Quarterly outage
Scrap yard conveyor C-7 drive
73 days
Medium
Monitor, no action
Cooling bed fan FB-1 motor
95 days
Low
Monitor, no action
RUL colour depth encodes urgency: deep purple = act this outage, mid purple = act this quarter, light purple = monitor only. Criticality bars encode production impact, not failure probability.
From sensor to scheduled stop: the data pipeline
iFactory does not bolt onto your historian and hope. It runs a closed loop — ingest, condition, infer, rank, schedule — with the inference engine sitting on an NVIDIA AI server racked inside your plant network, so telemetry never leaves the fence.
01
Ingest
Vibration accelerometers, thermocouples, pressure transducers, motor current sensors — polled at up to 25 kHz per channel, edge-buffered on the NVIDIA server.
02
Condition
Spectral features extracted per asset class: FFT bands, envelope spectra, order analysis, thermal gradient maps. Noise floor subtracted per sensor.
03
Infer
Per-asset models trained on steelmaking failure signatures output anomaly score, failure-mode classification, and remaining-useful-life distribution.
04
Rank
Each asset's RUL is weighted by production criticality and current schedule, producing a ranked intervention queue for the reliability engineer.
05
Schedule
Recommended interventions are matched to planned stop windows and pushed to the CMMS, closing the loop between prediction and wrench.
Anomaly heat signature — 24-hour mill floor
The live dashboard renders the plant floor as a heatmap of anomaly intensity. Each cell is an asset, each row a hour of the shift. Deep purple cells are assets the model wants you to look at now; pale cells are healthy. The pattern below — a cluster forming on the finishing mill across the night shift — is exactly how a pinion failure announces itself twelve days before threshold alarms would fire.
Caster S1
Caster S4
Furnace Z1
Furnace Z3
Roughing mill
Finishing F1
Hydraulic H-2
Conveyor C-7
Anomaly intensity
HealthyAct now
Read the Finishing F1 row left to right: anomaly intensity climbs steadily from 14:00, reaching deep purple by 22:00 — the classic drift-phase signature of a pinion bearing losing its lubrication film.
Deployment: pre-configured NVIDIA AI server, three phases, six to twelve weeks
The platform runs on a pre-configured NVIDIA AI server, racked and ready inside your plant network. No telemetry leaves the fence. The roadmap below is what a typical integrated steel plant moves through from kick-off to live prediction.
Weeks 1–3
Asset mapping & sensor audit
Reliability engineers and iFactory specialists map critical assets, verify sensor coverage, and identify gaps where vibration or thermal channels are missing on failure-prone equipment.
Weeks 4–8
Server rack, model training, integration
NVIDIA AI server is racked inside the plant network. Per-asset models are trained on historical failure data and live sensor streams. CMMS and historian integration configured.
Weeks 9–12
Live prediction & reliability handoff
Dashboard goes live across the plant floor. Reliability team trained on RUL ranking, intervention scheduling, and failure-mode classification. Pilot assets under continuous monitoring.
Runs inside your plant network. Telemetry, inference, and dashboards stay on-premise. 99.9 percent platform uptime backed by experience across 1000+ industrial clients.
Frequently asked
How much historical sensor data do you need before the models are useful?
For assets with documented failure events, three to six months of high-frequency vibration and thermal data is typically enough to train a useful failure-mode classifier. For assets without failure history, iFactory ships pre-trained baselines from comparable steelmaking equipment and refines them on your live data.
Does the platform require new sensors, or does it work with what we already have?
Phase one includes a sensor audit. iFactory works with your existing accelerometers, thermocouples, and motor current channels wherever coverage is adequate. Where critical assets are under-instrumented — typically drive-side bearings on older mill stands — the audit flags the gaps and recommends specific sensor additions.
Where does the inference run, and does any data leave the plant?
Inference runs on the pre-configured NVIDIA AI server racked inside your plant network. Raw sensor data, extracted features, and model outputs all stay on-premise. Only aggregated health summaries are optionally shared with iFactory support for model refinement, and only with explicit approval.
How does the platform handle assets that run intermittently or at variable duty cycles?
iFactory models are duty-cycle aware. A standby furnace burner and a continuously running caster segment are not compared against the same baseline. The conditioning layer normalizes by operating state — running, idle, ramping — so anomaly scores reflect genuine degradation rather than normal load variation.
What does the reliability team actually see day to day?
A live dashboard showing every monitored asset ranked by production-weighted remaining useful life, with failure-mode classification and a recommended intervention window. The team reviews the queue against the planned outage schedule and pushes work orders to the CMMS directly from the platform.
SCOPE A PILOT
Put your next bearing swap inside a planned stop, not on top of a cast.
Book a 30-minute scoping call. We will walk through your critical asset list, current sensor coverage, and the outage windows where AI-scheduled interventions would recover the most production time.