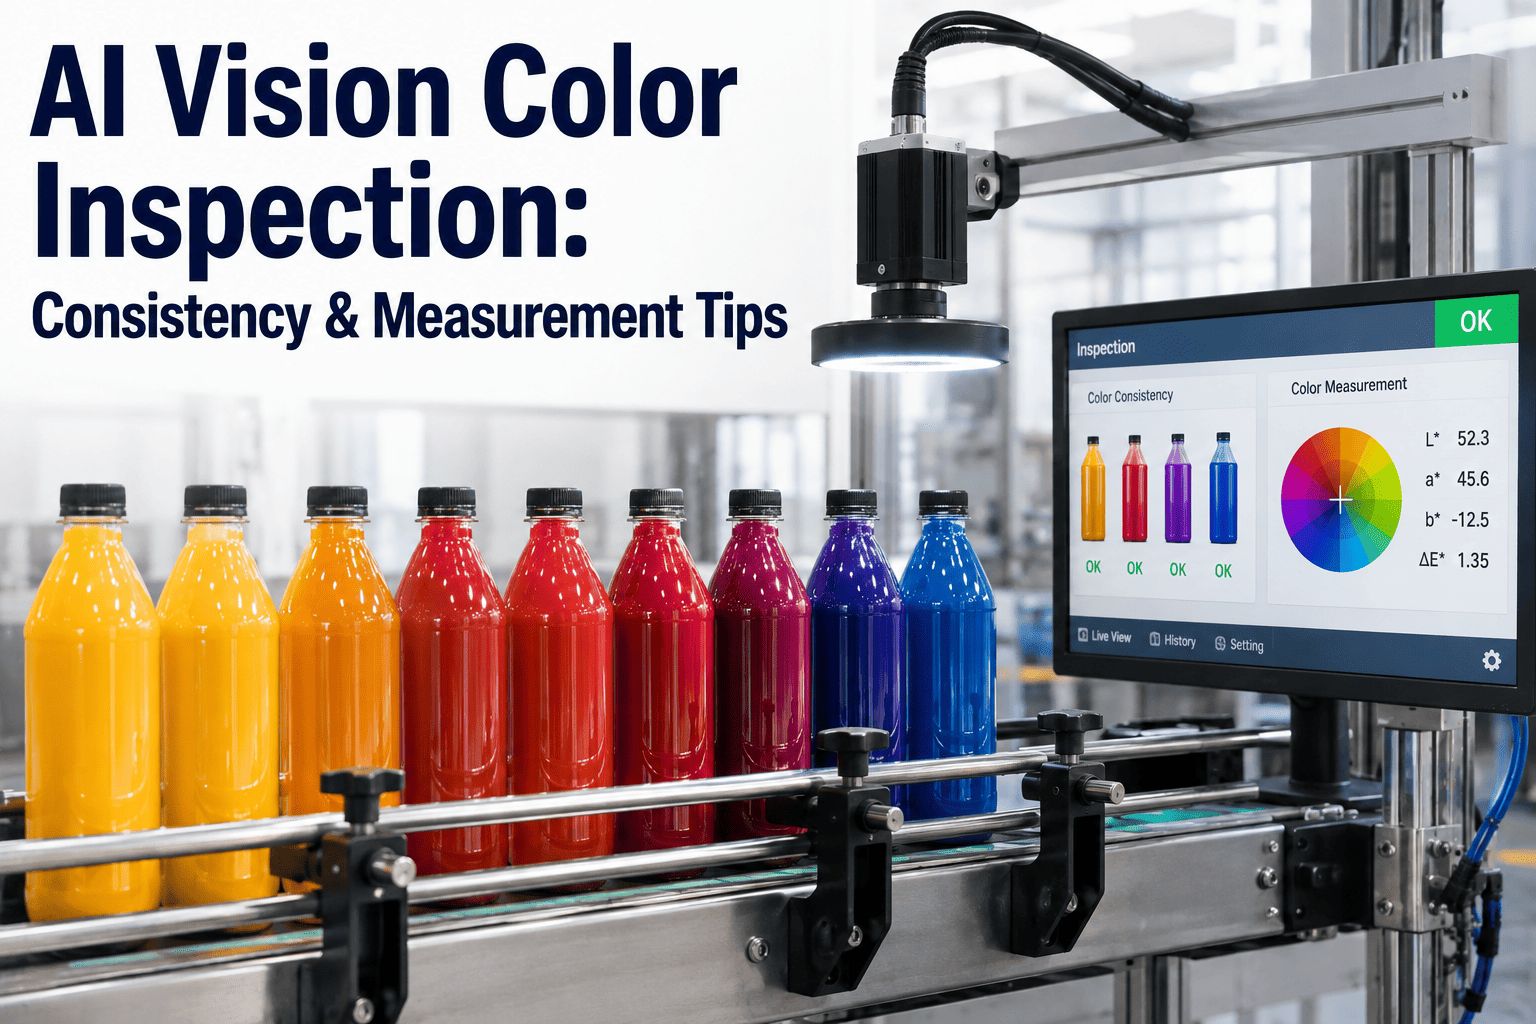
Color is one of the first things a customer notices and one of the hardest things a manufacturing line can consistently control. A batch of parts that passes every dimensional and functional check can still be rejected outright because the finish reads slightly warmer or cooler than the approved master sample, and the human eye is a notoriously unreliable instrument for catching that difference under factory lighting, especially after hours of repetitive inspection. Traditional color matching relies on spot-check spectrophotometer readings taken on a small sample of parts, leaving the rest of the batch essentially unverified until a customer complaint or an incoming inspection rejection reveals a drift that had already been running for hours or days. AI vision changes this by measuring color on every part, calculating a precise Delta E value against the approved standard, and making an automated pass or fail decision at line speed instead of relying on periodic sampling and subjective visual judgment. If color consistency is costing you rework, customer rejections, or manual inspection hours, you can book a demo to see how iFactory measures color on every part in real time.
Measure Color Consistency on Every Part, Not Just a Sample
iFactory's AI vision calculates Delta E color difference on every part at line speed, replacing periodic spectrophotometer spot checks with continuous, automated pass or fail decisions.
What Delta E Actually Measures and Why It Matters More Than a Visual Check
Delta E is a single numeric value that quantifies the perceptual difference between two colors, calculated from precise measurements across the color spectrum rather than a subjective visual comparison. A lower Delta E value means the measured color is closer to the approved standard, and manufacturers typically define an acceptable tolerance threshold based on how sensitive their product and customer base are to color variation. The scale below shows the general relationship between a Delta E value and how noticeable the corresponding difference is to a typical observer, though the exact perception threshold varies somewhat by individual and by the specific color region being compared.
What makes Delta E valuable in a manufacturing context is that it removes the subjectivity that plagues human color inspection. Two experienced quality inspectors looking at the same part under the same lighting can reasonably disagree about whether a slight tint difference is acceptable, particularly toward the end of a long shift when visual fatigue sets in. A Delta E measurement produces the same number every time under the same controlled conditions, which is exactly the kind of consistency a customer specification or an internal quality standard requires to be enforceable in a repeatable way.
Five Common Sources of Color Drift on a Production Line
Color consistency problems rarely come from a single cause. Understanding where variation typically enters the process helps quality teams target both the inspection system and the underlying process controls that reduce how often drift occurs in the first place. In most plants, a combination of two or three of these sources is responsible for the majority of out-of-tolerance batches, and continuous measurement data is often the fastest way to identify which combination is actually at play on a specific line rather than guessing based on anecdotal operator reports.
Once continuous Delta E data is available, correlating drift events with shift changes, material lot numbers, or equipment maintenance logs frequently reveals the root cause within days rather than the weeks or months it can take using sparse spot-check data. This diagnostic value is often underestimated when plants first evaluate a color inspection system, since the immediate motivation is usually catching defective batches rather than the secondary benefit of finally being able to pinpoint what is actually driving the variation in the first place.
Raw Material Batch Variation
Pigment, dye, or resin lots from different suppliers or even different production runs from the same supplier can carry subtle color differences that compound across a full production batch.
Process Temperature Fluctuation
Curing, baking, or dyeing temperature that drifts outside the ideal range changes how color develops on the finished surface, even when the input material is identical.
Equipment Wear and Calibration Drift
Spray nozzles, print heads, and mixing equipment gradually wear or fall out of calibration, introducing gradual color shift that is difficult to notice day to day.
Ambient Environmental Conditions
Humidity and ambient temperature in the production environment affect how coatings and dyes cure and set, particularly in processes sensitive to environmental control.
Operator-Dependent Manual Steps
Any manual mixing, application, or finishing step introduces person-to-person variation that a fully automated process would not, especially across shift changes.
From Camera Capture to Automated Pass or Fail Decision
Measuring color reliably at line speed requires more than pointing a camera at a part. The process below outlines how iFactory's system controls for lighting variation and produces a consistent, repeatable Delta E measurement on every single unit that passes the station. Each of these steps happens automatically within the inference cycle, meaning the full sequence from image capture to pass or fail signal completes fast enough to keep pace with production line speeds without introducing a bottleneck at the inspection point.
The controlled lighting step deserves particular attention because it is the most common point of failure in DIY or improvised color inspection setups. Off-the-shelf industrial cameras paired with standard ambient lighting can produce measurements that vary meaningfully depending on the time of day, nearby equipment, or even whether a nearby door is open, which defeats the purpose of building an automated system in the first place. iFactory's stations are engineered specifically to eliminate this variable before any measurement is taken.
Controlled Lighting Capture
Calibrated, consistent lighting at the inspection station eliminates the ambient light variation that makes visual color comparison unreliable across different times of day.
Color Space Conversion
The captured image is converted into a standardized color space that separates color information from brightness, enabling precise numeric comparison against the standard.
Delta E Calculation
The system calculates the Delta E value between the measured part and the approved master sample, accounting for the region of the part most relevant to the customer's perception.
Threshold Comparison
The calculated Delta E value is compared against your defined tolerance threshold, which can vary by product line, customer specification, or visible versus hidden surface.
Automated Pass or Fail Signal
A discrete signal is sent to the line control system, triggering diversion or an Andon alert for out-of-tolerance parts without requiring a manual inspection step.
Catching a Drifting Batch Before It Reaches Full Production Volume
The real value of continuous color inspection shows up when a batch begins drifting gradually rather than failing outright at the start. The comparison below illustrates how a spot-check approach and a full-inspection approach handle the same drifting batch differently.
| Batch Progress | Spot-Check Sampling | Continuous AI Inspection |
|---|---|---|
| Units 1-50 | Sample taken at unit 10 passes, no further check until next scheduled sample | Every unit measured individually, Delta E trend logged in real time |
| Units 51-150 | Gradual drift begins but no sample is taken during this window | Drift detected at the exact unit where Delta E crosses the warning threshold |
| Units 151-200 | Next scheduled sample finally catches the out-of-tolerance condition | Line already alerted and adjusted before this point in the batch |
| Total Affected Units | Up to 150 units potentially out of tolerance before detection | Typically fewer than 10 units affected before correction occurs |
Outcomes From Color-Critical Manufacturing Deployments
The metrics below are drawn from iFactory deployments at manufacturers where color consistency is a defined customer specification and a recurring source of rejected batches prior to implementing continuous inspection.