Most quality managers can tell you how many defects reached a customer last quarter, but far fewer can tell you what one missed defect actually cost the plant once rework, scrap, returns, line stoppages and lost trust are added together. That missing number is why vision inspection projects stall in budget meetings, even when the cameras clearly work. A good ROI case does not need complex finance models, only a clean list of costs, savings and checks done in the right order. This checklist walks through that list step by step, and if you want it filled in with your own line data, you can build your inspection business case with our team.
ROI checklist for quality teams
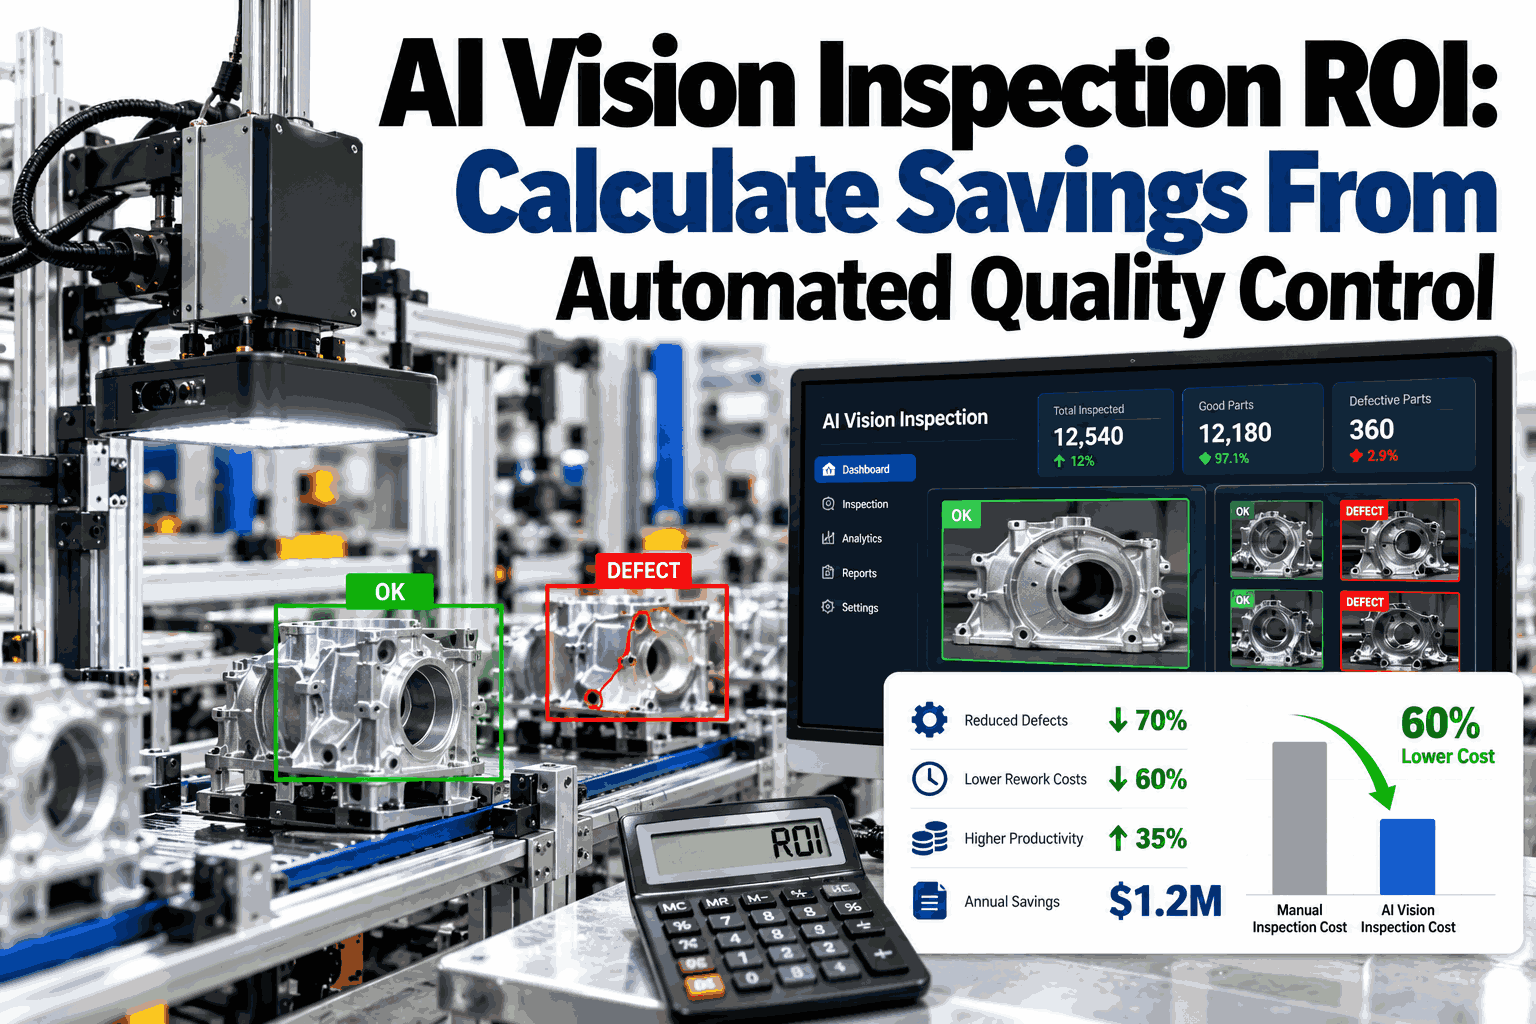
AI Vision Inspection ROI: Calculate Savings From Automated Quality Control
A practical, tick-as-you-go checklist to measure what manual inspection really costs, what automated vision can save, and how fast the investment pays back.
Start here
Why Inspection ROI Is Hard to Prove Without a Checklist
Inspection costs are spread across many budgets. Labor sits in one cost center, scrap in another, and customer complaints in a third, so nobody sees the full picture.
What teams usually count
Inspector wages
Scrap bin weight
Camera purchase price
What teams usually miss
Escapes found by customers
Sorting and containment hours
Line stops for suspect lots
Inspector fatigue and variation
The checklist below closes that gap by turning every hidden cost into a line you can measure and tick off.
Checklist one
Step One: Baseline Your Current Cost of Poor Quality
Before any savings can be claimed, you need a baseline. Pull the last three to six months of data for each item below.
Units inspected per shift
Total volume checked by people today, per line and per product family.
Scrap and rework rate
Percentage of units scrapped or reworked, with material and labor cost per unit.
Customer escapes
Complaints, returns, credits and chargebacks tied to missed defects.
Inspector hours
Paid hours spent on visual checks, including breaks, handovers and re-inspection.
Containment time
Hours spent sorting suspect lots after a defect is found late.
Stoppage minutes
Line time lost waiting on quality holds, releases and re-checks.
Where the money hides
Cost of One Defect Rises at Every Stage It Travels
A defect caught at the line costs a fraction of one caught at the customer. This illustrative index shows the typical climb, with the in-line catch set to 1.
Caught in-line by vision
1x
Caught at final inspection
5x
Caught by the customer
30x or more
The multipliers are planning figures and vary by product and contract, so replace them with your own numbers from step one.
Checklist two
Step Two: Tick Every Savings Source Vision Can Reach
Not every saving applies to every plant. Mark the ones that match your line and only count those in the model.
Scrap reduction
Earlier detection stops value being added to parts that are already bad.
Fewer escapes
Consistent detection lowers returns, credits and complaint handling time.
Labor redeployment
Inspectors move to value-adding checks instead of repetitive visual scanning.
Less containment
Traceable defect images shrink the number of units that need sorting.
Faster root cause
Defect patterns by time and station point to the source within hours.
Audit readiness
Every inspection leaves an image and record ready for customer audits.
Skip the spreadsheet work
Get Your Own Inspection ROI Worked Out
Share your volumes, defect rate and current inspection setup, and we will map the savings sources that apply to your line.
Worked example
A Sample Payback Calculation, Line by Line
This illustrative example uses round numbers for one packaging line. Swap in your own figures to test your case.
| Line item | Before vision | After vision | Annual effect |
|---|
| Scrap and rework cost | 180,000 | 110,000 | Saves 70,000 |
| Customer credits and returns | 95,000 | 35,000 | Saves 60,000 |
| Manual inspection labor | 120,000 | 60,000 | Saves 60,000 |
| Containment and sorting | 40,000 | 15,000 | Saves 25,000 |
| System, support and upkeep | 0 | 45,000 | Costs 45,000 |
| Net annual benefit | 435,000 | 265,000 | Net 170,000 |
With a one-time setup of 150,000 in this example, simple payback lands in roughly ten to eleven months.
Checklist three
Step Three: Roll Out in Four Controlled Phases
Payback depends as much on rollout discipline as on the technology. This timeline keeps risk low and proof early.
1
Pick one high-cost station
Choose the station with the highest escape or rework cost, not the easiest one to install.
2
Run in shadow mode
Let vision score parts alongside inspectors for a few weeks and compare the results.
3
Go live with reject control
Switch on automated rejects once agreement with trained inspectors is stable.
4
Measure and expand
Compare real savings to the model, then repeat on the next station.
Check your readiness
Quick Scorecard: Is Your Line Ready for Vision Inspection
Count how many statements are true for your line. The more you tick, the faster the payback tends to be.
Strong ROI signals
Defects are mostly visual
High volume, repeat products
Inspectors miss defects late in shift
Customers audit your records
Needs more planning
Lighting changes across shifts
Many one-off product variants
No defect image history yet
Unclear reject handling process
Lines in the second column are not ruled out. They simply need a short setup review before numbers are committed. You can ask our team how setup is handled for variable lines.
Avoid these
Five Mistakes That Quietly Shrink Vision Inspection ROI
A
Counting only labor savings and ignoring escapes and containment.
B
Starting on an easy station that has little defect cost to save.
C
Skipping shadow mode, so trust in the system never builds.
D
Leaving defect images unused instead of feeding root cause work.
E
Never rechecking the model against real results after go-live.
Frequently asked questions
What Quality Teams Ask Before Building the Case
How long does vision inspection usually take to pay back?
Payback depends on defect cost, volume and how much manual inspection is replaced. Lines with high escape costs often recover the investment within the first year.
Estimate your own payback period on a short call.
Does automated inspection replace our inspectors?
Usually it moves them to higher value work such as audits, root cause and exception review. Repetitive visual scanning is what gets automated first.
Ask support about workforce planning for your plant.
What data do we need to build a credible ROI model?
Volumes, scrap and rework rates, customer return costs and inspection hours are enough to start. Rough figures are fine for a first pass and can be refined later.
Review which data to gather first with our specialists.
Can the savings be proven to finance and leadership?
Yes, because every inspection leaves a timestamped image and result, so before and after comparisons rest on records rather than estimates.
Learn how reporting supports your review with the support team.
What if our products change often?
Frequent changeovers can still work when inspection recipes are saved per product and recalled automatically. The ROI model should include setup time per variant.
Test your product mix against a realistic scenario.
See the numbers before you commit
Turn This Checklist Into a Real Savings Forecast
Book a session with iFactory AI to walk through your lines, fill in the model together and see how quickly automated quality control can pay for itself.