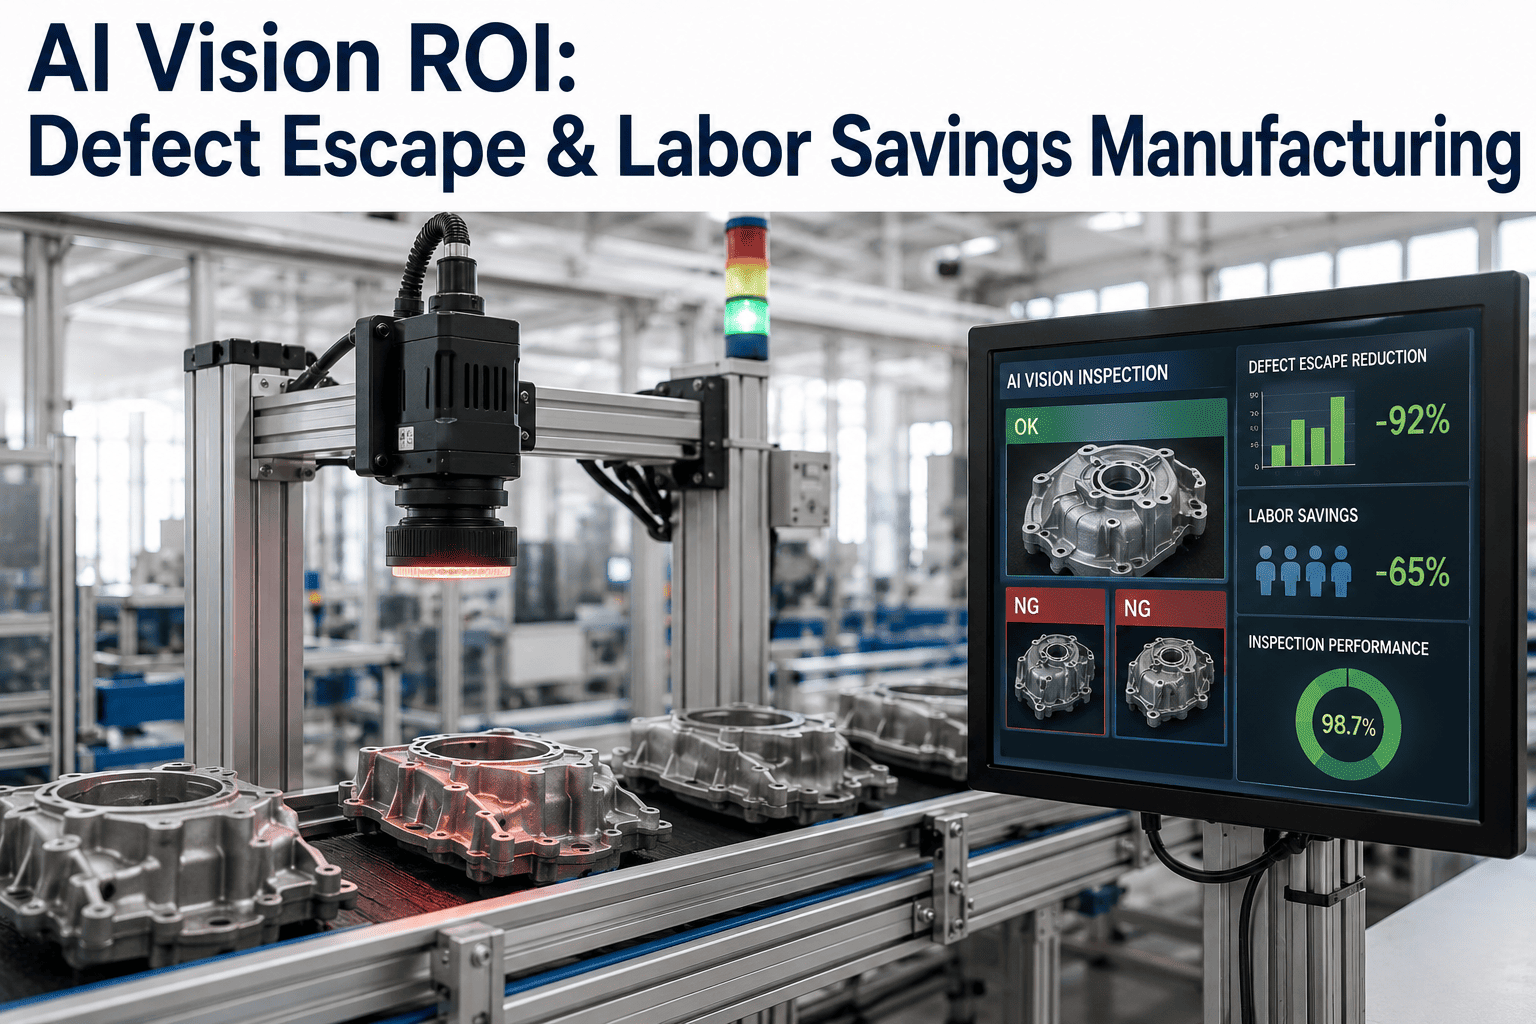
AI Vision ROI: Defect Escape & Labor Savings Manufacturing
By James Smith on August 7, 2026
Every AI vision investment proposal eventually reaches the same meeting: a finance stakeholder asking for the number, and a quality or operations leader who has an intuitive sense that the system will pay for itself but has never built the calculation that proves it with numbers finance will accept. The intuition is usually correct — AI vision inspection is one of the higher-ROI investments available to a manufacturing quality programme — but "it will probably pay off" is not a business case. A defensible ROI calculation requires quantifying three distinct value streams separately: the cost of defects currently escaping to customers, the labor currently consumed by manual inspection that could be reallocated, and the quality improvement value that compounds beyond the initial investment period. This is a structured framework for building that calculation with your own production numbers, not generic industry claims. Book a session with the iFactory ROI analysis team to build a defensible business case using your actual production and quality data.
AI Vision · ROI & Investment Justification
AI Vision ROI: Quantifying Defect Escape Reduction, Labor Savings, and Quality Improvement
A structured calculation framework for building a defensible AI vision investment business case — covering defect escape cost, inspection labor reallocation, and the quality improvement value that compounds well beyond the initial payback period.
Cumulative Savings vs. Investment — Payback Timeline
7–9 moTypical payback period
3Value streams to quantify
The Cost of the Status Quo
Before Calculating AI Vision ROI, Quantify What the Current Approach Actually Costs
An ROI calculation is only meaningful relative to a clearly quantified baseline. Most manufacturing quality programmes have never fully costed their current manual inspection approach — the labor cost is visible on a headcount report, but the cost of defects that escape manual inspection and reach customers, the cost of inconsistent inspection quality across shifts, and the opportunity cost of skilled inspectors performing repetitive visual checks instead of higher-value work are rarely aggregated into a single figure.
The visible, budgeted cost — straightforward to calculate but only the starting point of the full status quo cost picture.
Defect Escape Cost
Escaped defects × average cost per escape (warranty, return, rework, goodwill)
Almost always the largest and least visible cost component — manual inspection typically catches 70 to 85% of true defects, with the remainder reaching customers at a cost per incident many times higher than in-process detection.
Inspection Inconsistency Cost
Variance in detection rate across shifts/inspectors × associated escape cost
Detection rate varies measurably between inspectors and across a shift due to fatigue — this variance itself has a quantifiable cost distinct from the average escape rate.
Value Streams
The Three Financial Value Streams AI Vision Investment Delivers
AI vision ROI should be built from three distinct value streams, calculated separately and then combined — treating them as a single blended savings figure obscures which value stream actually drives the business case and makes the calculation harder to defend under scrutiny.
01
Defect Escape Reduction
AI vision inspection typically achieves detection rates of 95 to 99% for well-trained defect categories, compared to 70 to 85% for manual inspection — the difference in escape rate, multiplied by the cost per escaped defect, is usually the single largest value stream in the ROI calculation. This value stream alone frequently justifies the investment before labor savings are even considered.
02
Labor Reallocation
Automated inspection does not necessarily eliminate inspection headcount — it typically reallocates inspector time from repetitive visual checking to higher-value activity: root cause investigation, process improvement, exception handling for AI-flagged uncertain cases, and other tasks requiring human judgment that AI does not replace. The financial value is the productive output gained from this reallocation, not simply a headcount reduction figure.
03
Compounding Quality Improvement
Beyond the direct detection improvement, AI vision generates structured defect data (location, frequency, correlation with process parameters) that feeds root cause analysis and process improvement — a value stream that compounds over time as the underlying process improves and defect rates fall further, distinct from and additional to the detection rate improvement itself.
Build Your Case With Your Actual Numbers
iFactory Calculates AI Vision ROI Using Your Production Volume, Defect History, and Labor Costs
Generic industry ROI figures rarely survive finance scrutiny. iFactory's ROI assessment builds the calculation from your actual production volume, current defect escape data, and inspection labor costs — producing a business case grounded in your specific numbers, not industry averages.
The full ROI calculation combines the three value streams against total investment cost, producing both a payback period and an ongoing annual return figure. The structure below walks through each calculation step in sequence.
01
Establish Current Defect Escape Rate and Cost
Determine current escape rate from customer complaint, warranty, and return data (not assumed manual inspection accuracy). Multiply escaped defect volume by average cost per escape, including direct cost (warranty, return, rework) and estimated indirect cost (customer relationship, brand impact) where quantifiable.
02
Project AI Detection Rate and Escape Reduction
Estimate achievable AI detection rate for your specific defect catalog (typically informed by a pilot or benchmark on representative samples), calculate the resulting escape rate reduction, and apply the same per-escape cost figure to quantify annual defect escape cost avoidance.
03
Quantify Labor Reallocation Value
Calculate inspector hours freed by automated detection, multiplied by the productive value of reallocated time — either direct headcount cost avoidance if positions are not backfilled, or the value of redirected activity (process improvement, root cause work) if headcount is retained and redeployed.
04
Estimate Compounding Improvement Value
Apply a conservative estimate of process improvement value enabled by structured defect data — often modeled as an additional percentage reduction in defect rate over Year 2 and beyond, informed by the correlation analysis capability the AI system provides. This value stream is typically the most conservative and least certain of the three, appropriately weighted lower in the overall calculation.
05
Combine Against Total Investment Cost
Sum all three value streams by year against total investment cost (hardware, software licensing, integration, and ongoing operating cost) to produce payback period and multi-year ROI. Present the calculation with clear line-item transparency rather than a single blended figure, allowing finance stakeholders to interrogate and adjust individual assumptions.
Payback Scenarios
Representative ROI Ranges by Production Scale
The table below illustrates representative payback ranges across different production scales, based on typical defect escape costs and labor structures. Actual results depend heavily on your specific defect cost profile and should be calculated with your own numbers rather than applied directly from this table.
Production Scale
Typical Investment Range
Annual Value (Yr 1)
Typical Payback
Primary Value Driver
Single line, moderate volume
$80K–$180K
$150K–$350K
6–10 months
Defect escape reduction
Multi-line, single plant
$250K–$600K
$500K–$1.4M
7–12 months
Combined escape reduction + labor reallocation
Multi-plant deployment
$800K–$2.5M
$1.8M–$5M+
8–14 months
Escape reduction at scale + standardization value
Higher-defect-cost industries (automotive safety-critical components, medical device, aerospace) typically see faster payback driven by the escape reduction value stream, since the per-escape cost is substantially higher than in lower-consequence consumer goods categories.
Sensitivity Analysis
Which Assumptions Matter Most — Stress-Testing the Business Case
A defensible ROI case identifies which input assumptions the payback conclusion is most sensitive to, allowing stakeholders to focus scrutiny on the variables that actually matter rather than treating every assumption as equally uncertain.
High Sensitivity — Cost Per Escaped Defect
The single most influential variable in most calculations. A 30% error in the assumed per-escape cost produces a proportional error in the largest value stream. Ground this figure in actual historical warranty, return, and rework cost data rather than an estimate — this is worth the effort of pulling real data before the business case is finalized.
Moderate Sensitivity — Achievable AI Detection Rate
Detection rate assumptions should be validated through a pilot or benchmark on representative production samples rather than assumed from generic industry figures, since actual achievable rates vary by defect type and fabric/material complexity. A pilot phase before full deployment reduces this uncertainty directly.
Lower Sensitivity — Compounding Improvement Value
This value stream is inherently the most speculative and should be weighted conservatively in the primary business case — if the payback calculation depends heavily on this component to justify the investment, the case is weaker than one where escape reduction and labor reallocation alone justify the payback period.
ROI Tracking KPIs
Six Metrics That Validate the Business Case After Deployment
Actual vs. Projected Detection Rate
Target: within ±5% of case
Comparing the AI system's actual production detection rate against the rate assumed in the original business case — the foundational validation metric for whether the ROI calculation's core assumption held.
Defect Escape Rate Reduction
Target: matches or exceeds case
Measured reduction in defects reaching customers, tracked via the same warranty, return, and complaint data sources used to establish the pre-investment baseline — the direct financial validation of the largest value stream.
Actual Payback Period
Target: within ±2 months of projection
Time until cumulative realized value equals total investment cost, tracked against the projected payback timeline from the original business case — the headline metric for programme financial validation.
Labor Reallocation Realization
Target: >80% of projected hours redeployed
Percentage of the projected freed inspection labor hours actually redeployed to the higher-value activity assumed in the business case, rather than absorbed without measurable productive redirection.
Year 2+ Defect Rate Trend
Trend: continued decrease
Whether the compounding improvement value stream is materializing as projected — a continued defect rate decline beyond the initial detection improvement validates that the structured defect data is genuinely informing process improvement.
Total Realized ROI
Target: matches or exceeds case
Cumulative financial value realized across all three value streams against total investment and operating cost, tracked annually — the ultimate business case validation figure reported to finance and executive stakeholders.
From the Business Case Table
“
The business cases I have seen fail to get funded are almost never rejected because the underlying investment was not worthwhile — they fail because the calculation presented could not withstand five minutes of finance scrutiny. A single blended savings number with no visible line items, an assumed detection rate with no supporting pilot data, and a defect escape cost figure that was estimated rather than pulled from actual warranty and return records — any finance director worth their position will find the soft spot in that presentation within minutes, and once they find one weak assumption, they reasonably start questioning all of them. The cases that get funded quickly are the ones that show their work: here is our actual historical escape cost from real warranty data, here is our pilot detection rate measured on our own production samples, here is the labor reallocation assumption with a specific plan for what freed inspector time will actually do. That level of rigor takes more effort to build initially, but it converts a skeptical finance conversation into a collaborative one, because you have given them a calculation they can actually interrogate and trust rather than a number they have to take on faith.
Solveig Adekunle-Braithwaite
Quality Investment Analyst · Manufacturing Business Case Specialist · 19 years building and validating capital investment cases for quality and automation programmes · Former Director of Quality Finance, multi-plant industrial manufacturer · Specialist in AI and automation ROI methodology
Business Case Questions
AI Vision ROI — Frequently Asked
How do we get an accurate cost-per-escaped-defect figure if we've never calculated this before?
Building this figure from scratch requires pulling several existing data sources that most manufacturers already have but have not previously aggregated for this purpose. Start with direct cost categories that are usually already tracked separately: warranty claim cost per incident from your warranty administration system, return processing and restocking cost from logistics or customer service records, and rework or scrap cost when an escaped defect is caught before reaching the end customer but after leaving the inspection point. For indirect costs — customer relationship impact, brand damage, lost future business from a dissatisfied customer — a fully rigorous quantification is difficult, and many organizations reasonably choose to exclude indirect costs from the primary business case or apply a conservative, clearly-labeled estimate separately from the direct cost figure, preserving the credibility of the core calculation. Combining direct cost categories across a representative sample of actual historical escape incidents, then dividing by incident count, produces a defensible average cost-per-escape figure grounded in real data rather than assumption. For guidance on assembling this calculation from your specific data systems, book a session with the iFactory ROI analysis team.
Should the ROI case assume inspector headcount reduction, or does that undermine the business case if we don't actually plan to reduce headcount?
The business case should reflect your actual organizational intent, not a generic assumption, and both headcount reduction and labor reallocation are legitimate value streams if accurately represented. If the genuine plan is to reduce inspection headcount through attrition or reassignment, direct headcount cost avoidance is the correct and straightforward calculation. If the genuine plan is to retain inspection staff and redeploy their time to other value-generating activity — which is common and often preferred, since experienced inspectors often have valuable process knowledge better used elsewhere than repetitive visual checking — the calculation should quantify the value of that specific redeployed activity rather than a headcount reduction figure that will not actually occur. Presenting a headcount reduction assumption when the actual organizational plan is retention and redeployment undermines credibility if scrutinized, since the projected savings will not appear in the labor budget line the way the calculation implies. Be explicit about which scenario applies and calculate accordingly — both are defensible when accurately represented.
How confident can we be in a projected AI detection rate before the system is actually deployed and running on our production line?
Pre-deployment detection rate confidence should be grounded in a pilot or benchmark test using representative production samples rather than a generic industry claim or vendor marketing figure — this is the single highest-leverage step for reducing uncertainty in the business case's most sensitive variable. A pilot typically involves running the candidate AI model (or a representative model architecture, if the final production model is not yet trained) against a curated sample set including both known-good product and a representative distribution of actual historical defect types and severities, measuring detection accuracy directly rather than assuming it. This pilot data, even from a limited sample, is substantially more defensible in a business case than an unvalidated projection, and most organizations find the pilot effort worthwhile specifically because it de-risks the largest and most sensitive assumption in the entire calculation. iFactory's engagement model typically includes this validation step before finalizing the business case projection. Contact our support team to discuss pilot scope and timeline for your specific defect catalog.
How should the ROI case handle ongoing operating costs — is this a one-time investment or does the payback calculation need to account for continuing expenses?
A complete ROI calculation must include ongoing operating costs, not just the initial capital investment — omitting them overstates ROI and undermines credibility once actual costs appear in subsequent budget cycles. Ongoing costs typically include software licensing or subscription fees, cloud or platform hosting costs if applicable, periodic model retraining and maintenance effort, hardware maintenance and eventual replacement reserve, and any dedicated staffing time for system administration and oversight. These should be included as an annual recurring cost in the payback and multi-year ROI calculation, netted against the annual value streams rather than treated as a one-time expense only in the investment year. A common and reasonable business case structure presents Year 1 with full investment cost plus partial-year operating cost against partial-year value realization (since deployment and ramp-up rarely deliver full value from day one), followed by Years 2 onward showing full annual value against full annual operating cost — producing both an accurate payback period and a credible ongoing annual return figure for years beyond payback. Book a session to build a complete multi-year projection including your specific operating cost structure.
How do we present this business case to finance stakeholders who are skeptical of AI investment claims in general?
Skeptical finance stakeholders respond best to transparency about uncertainty rather than an attempt to project false precision. Present the calculation with clear line-item breakdown by value stream rather than a single blended figure, explicitly label which inputs are grounded in actual historical data (highest confidence) versus pilot-validated projections (moderate confidence) versus estimates (lowest confidence, and ideally minimized in the core case), and lead with the sensitivity analysis showing which assumptions the conclusion depends on most heavily — demonstrating that the team has already interrogated its own numbers rather than waiting for finance to find the weak points. Presenting a conservative base case alongside a more optimistic upside scenario, rather than a single point estimate, also tends to build credibility with financially sophisticated audiences who understand that any forward projection carries a range of outcomes. Most importantly, commit to the post-deployment KPI tracking described earlier in this reference and report actual results against the original case — finance stakeholders who see a first business case validated by actual results become substantially more receptive to subsequent investment proposals from the same team.
Stop Presenting Estimates. Start Presenting a Calculation.
Build an AI Vision Business Case Grounded in Your Actual Production, Defect, and Labor Data
iFactory's ROI analysis team works with your quality, operations, and finance stakeholders to build a transparent, line-item AI vision business case — using your actual warranty and return data for defect escape cost, a validated pilot for detection rate confidence, and a clear labor reallocation plan rather than generic industry claims that will not withstand scrutiny.