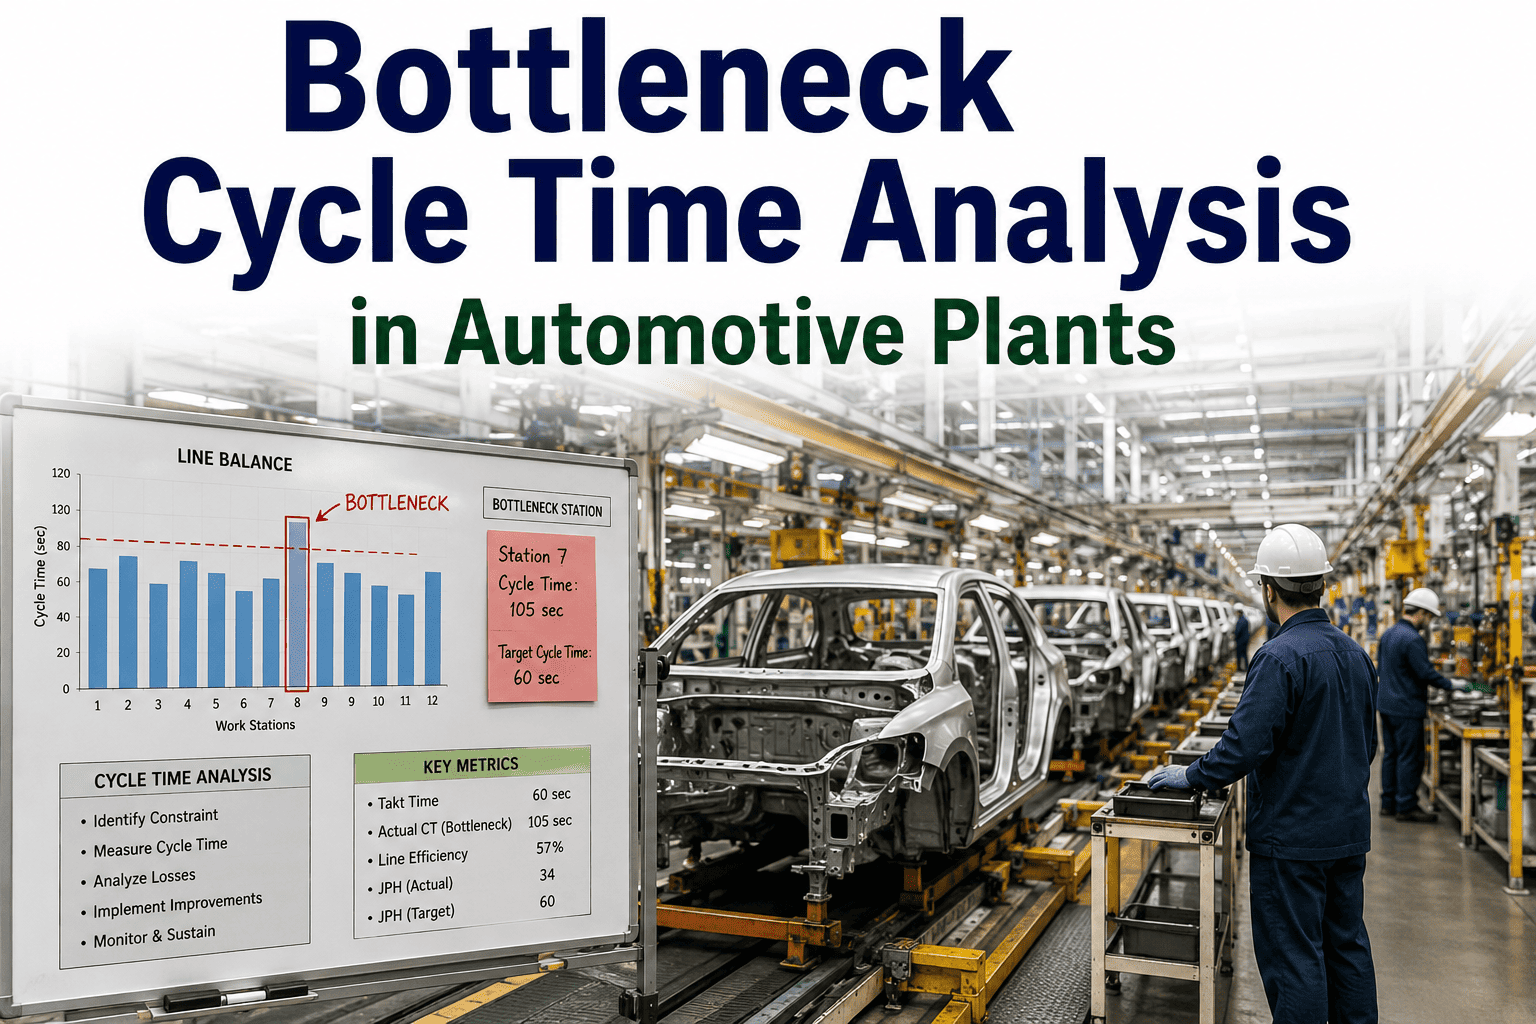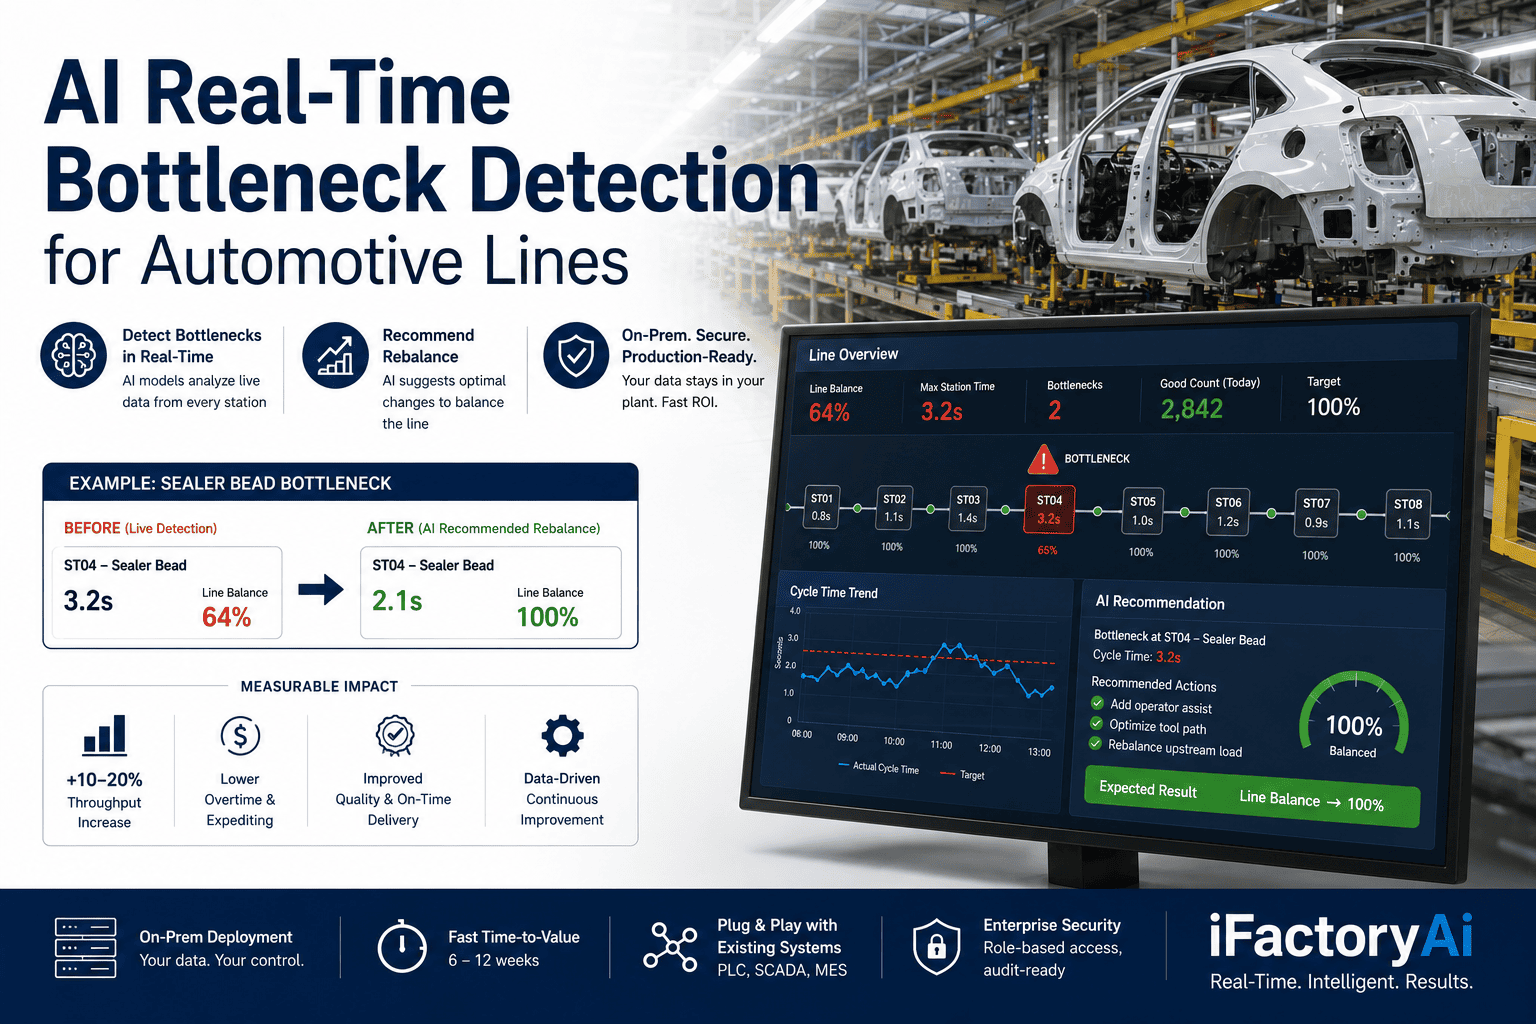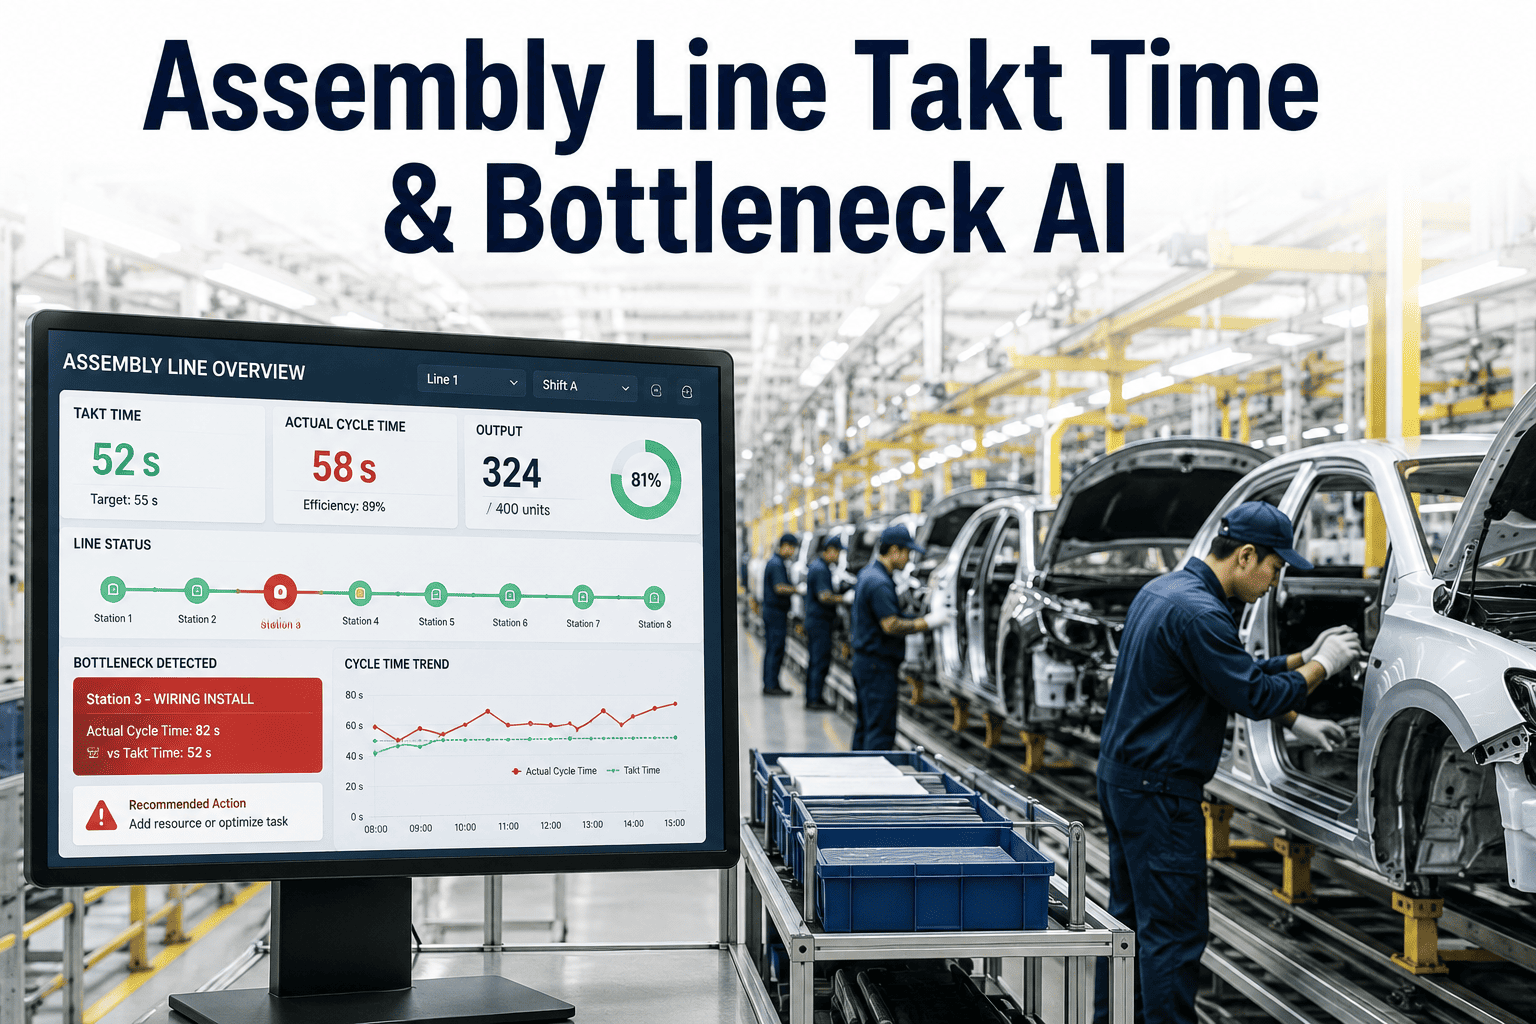
Every assembly line has a slowest station, and that single station quietly sets the ceiling on everything the entire line can produce, no matter how efficient every other workstation runs. Most plants know this in theory but struggle to pinpoint the actual bottleneck in practice, because it shifts — a station that is the constraint on the morning shift with fresh operators may not be the constraint by the afternoon once fatigue, material replenishment delays, or minor stoppages change the picture. AI-based takt time and WIP analytics track cycle time at every station continuously, surfacing the real bottleneck as it moves and letting supervisors rebalance before it costs a shift's worth of output. Plants applying this typically see throughput improve by around 12% without adding headcount or new equipment. To see how this could work on your line, Book a Demo with iFactory's operations analytics team.
Find the Real Bottleneck Before It Costs a Shift.
iFactory AI tracks station cycle time and WIP flow continuously, showing supervisors exactly where the line is constrained right now, not what last week's report said.
Why the Bottleneck You Fixed Last Month Isn't the One Slowing You Down Today
Line balancing exercises typically happen once or twice a year, based on a time study conducted over a few representative shifts. That snapshot becomes the basis for staffing and station assignments for months afterward, even though the actual constraint on a mixed-model line shifts constantly with product mix, operator experience level, and upstream material availability. A station balanced perfectly for one product variant can become the binding constraint the moment a higher-complexity variant enters the sequence.
Without continuous cycle time visibility, supervisors are left managing the line based on intuition and end-of-shift production counts, reacting to a throughput shortfall after it has already happened rather than catching the constraint building in real time. AI-based takt time monitoring closes this gap by comparing every station's actual cycle time against target takt continuously, flagging drift the moment it starts rather than after the shift total comes up short.
How Continuous Cycle Time Tracking Follows Product Through the Line
The monitoring model tracks four connected signals as product flows through each station, building a live picture of where WIP is accumulating and why.
Station Cycle Time
Actual time per unit at each station is compared continuously against target takt.
WIP Accumulation
Buffer levels between stations reveal where product is queuing up ahead of a slow point.
Micro-Stoppage Detection
Short stops under a minute are captured and aggregated, since these rarely appear on shift reports but add up fast.
Live Bottleneck Flag
The current binding constraint is surfaced on the supervisor dashboard in real time, not at shift end.
The Bottleneck Sources Most Assembly Supervisors Underestimate
Some constraints are obvious — a station with a visibly slower manual operation. Others hide inside patterns that only show up when cycle time data is aggregated across an entire shift or week.
Higher-complexity variants that take longer at a specific station create rolling bottlenecks that a fixed staffing plan cannot absorb.
Repeated short stops for part misalignment or tool resets rarely get logged individually but compound into significant lost capacity.
A station waiting on kit delivery appears to be underperforming when the actual constraint is upstream logistics timing.
Uneven task allocation across otherwise similar stations creates a hidden constraint that a static line balance sheet never captures.
Annual Time Studies vs Continuous AI Monitoring
The table below reflects the practical difference between traditional periodic line balancing and continuous, data-driven bottleneck tracking.
| Factor | Annual Time Study | Continuous AI Monitoring |
|---|---|---|
| Bottleneck detection speed | Identified retrospectively, months old | Flagged within the shift it occurs |
| Mixed-model sensitivity | Averaged across product mix | Tracked per variant in real time |
| Micro-stoppage visibility | Rarely captured | Aggregated and trended automatically |
| Rebalancing frequency | Once or twice a year | Continuous, data-driven adjustment |
Getting Continuous Line Balancing Running on Your Assembly Floor
Station instrumentation review — existing andon, PLC, or sensor data at each station is assessed for cycle time capture readiness.
Baseline takt mapping — target takt time per product variant is established against your current demand rate and shift pattern.
Live dashboard rollout — supervisors gain real-time visibility into station-by-station performance against target, replacing end-of-shift reporting.
Rebalancing cycle — staffing and task allocation adjustments are informed by ongoing data rather than an annual study, closing the loop continuously.
The Shift From Reactive Supervision to Predictive Line Management
Supervisors who have worked with continuous takt monitoring describe the biggest change not as a single dramatic fix but as a shift in how they spend their shift. Instead of walking the line reactively after a shortfall shows up on the hourly count board, they can see a station trending toward the takt limit twenty or thirty minutes before it becomes a full stoppage, giving them time to reallocate a floater or address a material gap before output is actually lost.
Plant managers report a secondary benefit that takes longer to show up but matters more over time: because the system builds a continuous historical record of station performance across every product variant, staffing decisions for new product launches can be based on real comparable data rather than starting from a fresh manual time study each time.
Assembly Line Takt Time AI — Frequently Asked Questions
Does this require new sensors at every workstation?
Many plants already have enough PLC, andon, or barcode scan data to establish reasonable cycle time tracking at most stations. Manual stations with no existing data capture typically need a simple light curtain or pushbutton sensor added, which our support team can scope during an initial walkthrough.
How is this different from a standard OEE dashboard?
OEE dashboards typically report availability, performance, and quality at the line or equipment level in aggregate. This system focuses specifically on station-to-station cycle time comparison and WIP flow to identify the exact binding constraint, which is a more granular and operationally actionable view for line balancing decisions.
Can this handle a line with frequent product changeovers?
Yes, target takt time and expected cycle time profiles are stored per product variant, so the system automatically adjusts its comparison baseline as different models move through the line rather than applying one fixed target across all variants.
Will this replace our line supervisors or industrial engineers?
No, it gives them better information to act on faster. Decisions about staffing, task reallocation, and process changes still rest with supervisors and engineers — the system removes the lag between when a constraint develops and when someone becomes aware of it.
How quickly can we expect to see throughput improvement after deployment?
Most lines see initial rebalancing gains within four to six weeks as supervisors act on the first round of bottleneck data, with the full throughput improvement typically realized within two to three months as staffing and task adjustments compound. Book a Book a Demo session to discuss a realistic timeline for your line.
See Where Your Line Is Actually Losing Throughput.
Book a session with iFactory to review your current line data against what continuous takt monitoring could reveal.