Here is the number that humbles every automotive plant: your jobs-per-hour is set by your single slowest station, and nothing else. You can have the fastest framing robots in the body shop, a paint line that hums, and a general assembly crew that never misses a beat — and if one station runs a few seconds long, the whole plant runs at that station's pace. The other stations just wait, or pile up work in front of the choke point. Most plants spend money speeding up stations that were never the problem. The plants that actually lift JPH do one thing first: they find the real bottleneck, prove it with cycle-time data, and break it before they touch anything else. An iFactory analytics layer is what turns that hunt from a guessing game into a measured one.
iFactory · Automotive Throughput Analytics
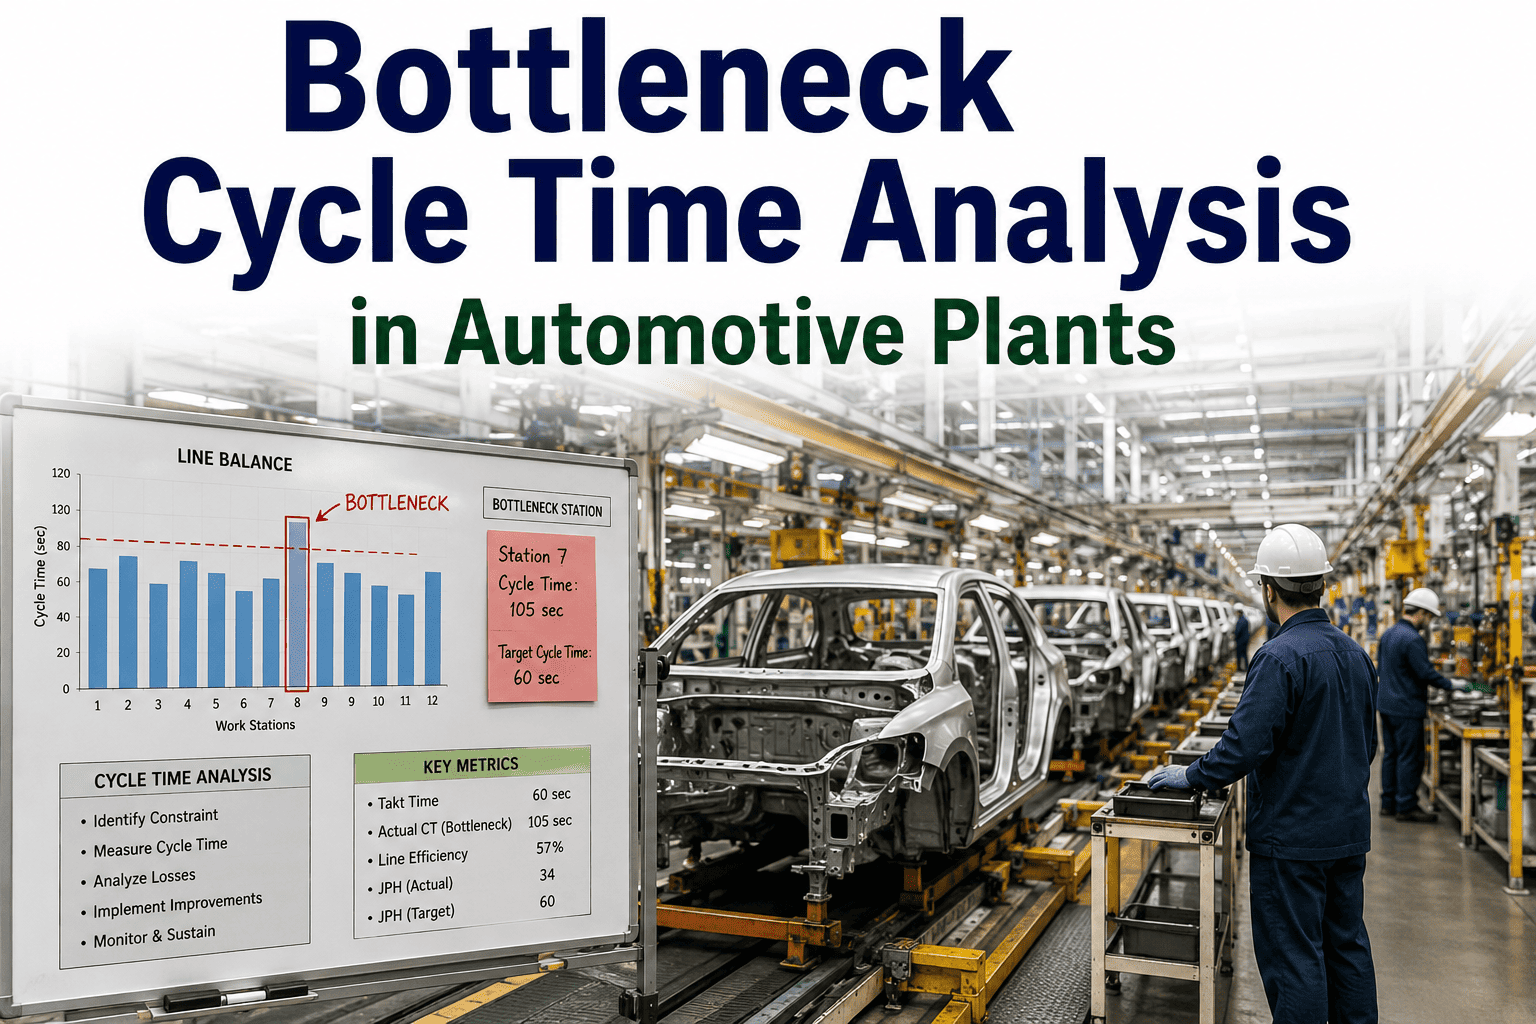
Bottleneck Cycle Time Analysis: Find the Station That Sets Your JPH
JPH is governed by your slowest station, not your fastest. Here is how to identify, measure, and break the bottleneck cycle time across body, paint, and general assembly — using the theory of constraints, not gut feel.
3600 / CT
JPH equals 3600 sec over slowest cycle time
1
station sets the whole line rate
5
focusing steps to break a constraint
~55 sec
typical auto-line takt to plan against
The Math That Decides Your Plant's Output
Jobs per hour and cycle time are two sides of one equation. There are 3600 seconds in an hour, so your line's JPH is simply 3600 divided by the cycle time of the slowest station. If your worst station runs at 65 seconds, your line cannot exceed about 55 JPH — no matter how fast everything upstream and downstream can go. This is why a station running just a few seconds over its design cycle quietly caps the entire plant. The whole point of bottleneck analysis is to find which station owns that number, because that station, and only that station, is your throughput.
65s
Station C — bottleneck
Line JPH is set by Station C, not the average
3600 ÷ 65s ≈ 55 JPH — the other three stations just wait
The Weakest Link Owns the Whole Chain
A production line is a chain, and a chain is only as strong as its weakest link. Strengthening any other link is wasted effort — it does not make the chain stronger, it just adds slack where there was already enough. Picture a convoy led by its slowest, heaviest vehicle: every faster truck has to match the leader's speed or the convoy falls apart. Speed up a non-bottleneck station and you do not gain a single extra job per hour. All you do is build a pile of work-in-process inventory in front of the real constraint — burning floor space and cash while throughput stays flat.
Reinforce the 40s or 42s station and the chain is no stronger. Only the 65s link sets what the line can carry.
Where Bottlenecks Hide in Each Shop
The constraint can sit anywhere from the first weld to final inspection, and each shop hides it differently. Walk the plant the way a constraint hunter does, and the symptoms tell you where to look.
Body Shop
Framing and aperture stations with heavy weld content
Tell: a station running well over its design cycle; downstream stations starved waiting for bodies
Paint Shop
Booths, ovens, and cure cycles that cannot simply be sped up
Tell: paint frequently dictates the whole plant JPH because its process time is fixed by chemistry
General Assembly
High-work-content stations on complex or multi-model trim
Tell: operators consistently chasing the line; model mix overloading certain stations
Between Shops
The handoffs where one shop starves or blocks the next
Tell: starvation and blockage losses — often a bigger drain than any single station
Want to know which shop owns your plant's JPH right now? Talk to a throughput specialist and we will pinpoint it from your station cycle data.
How to Actually Measure It — Not Guess
Opinions about the bottleneck are cheap and usually wrong. The constraint reveals itself in the data, and four signals point straight to it. When all four line up on one station, you have found it.
01
Longest cycle time
The station whose actual cycle time runs highest — and especially the one running over its design cycle.
02
Highest utilization
The station that is almost never idle while others wait. The constraint is the one with no slack.
03
Work piling up in front
A persistent queue or buffer building just upstream is the surest physical sign of the choke point.
04
Starvation downstream
Stations after it sitting idle, waiting for parts that never arrive fast enough — the constraint starving them.
Breaking the Bottleneck: The Five Focusing Steps
Once you have found it, the theory of constraints gives you the disciplined sequence to break it. The order matters: you wring everything out of the constraint with what you already own before you spend a rupee on new capacity. Most plants skip to the last step and waste capital.
1
Identify
Find the one station that sets the line rate — by cycle time, utilization, queue, and downstream starvation.
2
Exploit
Get more from it with no capital. Never let it sit idle — protect it through breaks, keep it fed, cut its micro-stops.
3
Subordinate
Make every other station serve the constraint. Buffer just before it so it never starves; pace the rest to its rhythm.
4
Elevate
Only now spend. Add a station, re-balance work, change tooling — with a throughput business case, not a hunch.
5
Repeat
Break one constraint and another appears elsewhere. Go back to step one — and do not let yesterday's fix become inertia.
Want these five steps run against your real station data, shop by shop? Book a demo and we will map your constraint and the path to break it.
Frequently Asked Questions
How exactly does cycle time set JPH?
An hour has 3600 seconds, so the maximum jobs per hour a line can produce is 3600 divided by the cycle time of its slowest station. A 65-second bottleneck caps the line at roughly 55 JPH regardless of how fast every other station runs. That is why the bottleneck's cycle time, not the line average, is the number that actually governs output.
Why shouldn't we just speed up our slowest-looking station?
Because the station that looks slow is not always the true constraint, and speeding up a non-constraint gains you nothing. The chain is only as strong as its weakest link — reinforce any other link and throughput stays flat while work-in-process piles up in front of the real choke point. Measure first; the four signals tell you which station genuinely owns the rate.
What's the difference between a bottleneck and a constraint?
A bottleneck is any resource whose capacity is lower than the demand flowing to it. The constraint is the specific resource that limits the whole system's output. Every constraint is a bottleneck, but a bottleneck is only the active constraint if demand actually exceeds its capacity. In a running plant at full schedule, they are usually the same station.
Why is paint so often the constraint?
Paint shop process times are governed by chemistry and physics — booth passes, flash-off, and oven cure cycles that cannot simply be accelerated the way a robot weld or a manual trim task can. When the fixed cure time is longer than the cycle time elsewhere, paint sets the plant's JPH by default, and elevating it usually means added capacity rather than a faster cycle.
How fast can we see results?
Exploitation and subordination — getting more from the constraint and aligning the rest of the line to it — often deliver throughput gains in weeks, because they need no capital, just discipline and good data. Elevation through new equipment or re-balancing takes longer. Expect the constraint to move once you break it, and plan to run the cycle again.
Stop spending money on stations that were never the problem.
Find the Station That Owns Your JPH
Bring one line — body, paint, or general assembly. We will measure cycle time, utilization, queueing, and starvation at every station, pinpoint the true constraint, and lay out the five-step path to break it before you spend on capacity. Turnkey analytics over your existing line data: pre-configured, integrated to your stations, with starvation-and-blockage tracking built in. Live in weeks, not quarters.
4
signals that pinpoint the constraint
5
steps to break it, in order
3
shops measured end to end
Weeks
to first throughput gain