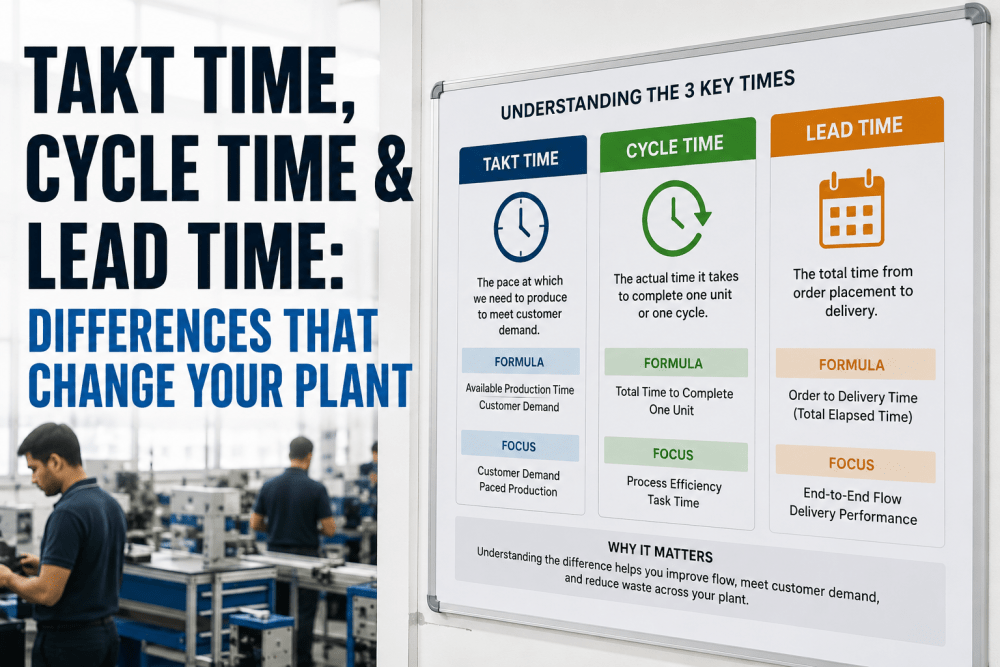
Takt time and cycle time are the two numbers that run an automotive assembly line. Takt time is the pace the customer needs. Cycle time is the pace the line actually works at. When cycle time creeps above takt at even one station, jobs per hour fall and the shift ends short. This practical guide explains both terms, shows the simple math behind JPH, and covers how leading plants balance their lines. To see takt and cycle time tracked live on a sample line, book a short walkthrough.
Takt Time and Cycle Time in Automotive Assembly: A Practical Guide to Hitting JPH
Takt sets the pace the customer needs. Cycle time shows whether each station can keep it. See both, station by station, in real time.
It is available production time divided by the number of vehicles the customer needs.
It is how long a station really takes to finish its work on one vehicle.
A station above takt cannot keep up; a station far below it wastes labor.
Stops and defects decide how many jobs per hour the line really delivers.
What Is Takt Time?
Takt time is the pace at which a line must finish vehicles to meet customer demand.
Available production time divided by customer demand. The Lean Enterprise Institute gives this example: 480 minutes a day and demand of 240 units gives a takt time of 2 minutes.
Illustrative. Change the demand or the available time and takt changes with it.
The word comes from German, where it means a beat or pulse. The Lean Enterprise Institute notes it was used in the German aircraft industry in the 1930s and adopted by Toyota in the 1950s.
Takt is not a choice the plant makes. It follows from demand. We can work out takt for your lines on a call.
What Is Cycle Time?
Cycle time is the time it actually takes to complete the work on one vehicle, measured at the station.
| Type of cycle time | What it measures | Who uses it |
|---|---|---|
| Operator cycle time | Time for one person to complete all work elements on one job | Team leaders, industrial engineers |
| Machine cycle time | Time for a robot or machine to complete its sequence | Maintenance, controls engineers |
| Planned cycle time | The target a station is designed and staffed to meet | Planning, line balancing |
| Line cycle time | Time between vehicles leaving the end of the line | Production managers |
The Lean Enterprise Institute defines cycle time as the time required to produce a part or complete a process, as timed by actual measurement. The key word is measured. Takt is calculated; cycle time is observed.
Automatic measurement from line controls gives cycle time for every job, not a stopwatch sample. See it in a demo.
Takt Time vs Cycle Time vs Lead Time
The three terms are often mixed up. Each answers a different question.
| Takt time | Cycle time | Lead time | |
|---|---|---|---|
| Question | How fast must we build? | How fast do we build? | How long does the customer wait? |
| Comes from | Demand and available time | Measurement at the station | Order date to delivery |
| Typical unit | Seconds per vehicle | Seconds per job | Days or weeks |
| Changes when | Demand or shift pattern changes | Work content, method or equipment changes | Queues and inventory change |
| Owned by | Planning | Production and engineering | Supply chain |
Keeping the three apart avoids most confusion in line reviews. Our specialists use the same definitions with every plant.
How Takt Time Sets Jobs per Hour
Jobs per hour is simply 3,600 seconds divided by takt time in seconds.
Simple arithmetic: JPH = 3,600 ÷ takt in seconds.
High-volume plants run takt times near one minute. Sports and luxury lines run several minutes per station because each job carries more manual work.
Neither is better. Takt should match demand. Ask our team to model yours.
Why Cycle Time Under Takt Is Not Enough
A line can have every station under takt and still miss its JPH target.
- The slowest station sets the rate. One bottleneck above takt holds back the whole line.
- Stops take time away. Breakdowns, short stops and material waits reduce available time.
- Defects take jobs away. Vehicles sent to repair do not count as finished on time.
- Variation matters. A station averaging 58 seconds may hit 65 on a heavy-option car.
Illustrative. This is why plants set a planned cycle time a little below takt.
Many practitioners aim for a planned cycle time of roughly 90–95% of takt to leave room for small losses. That figure is a rule of thumb, not a standard.
Seeing losses and cycle time together shows which one is costing jobs. We include both in every rollout.
Line Balancing: Spreading Work Against Takt
Line balancing gives each station work that adds up to just under takt time.
Illustrative. Station 14 is over takt; station 15 has room to take work from it.
Live cycle time data shows the real balance, not the one on paper. See a balance chart built from line data in a session.
Takt Time on Mixed-Model Lines
When different models share a line, takt is a weighted average and work content varies car by car.
Based on an AllAboutLean example. The station copes only if A and B alternate.
- Sequence matters. Two heavy vehicles in a row push the station over takt.
- Spacing rules help. Limits such as no more than two sunroof cars in five keep stations within reach.
- Averages hide peaks. Track cycle time by variant, not just the mean.
Cycle time by variant shows which options cause overcycles. Our engineers can set that up from your build data.
What to Do When Takt Time Changes
Every change in demand or shift pattern changes takt, and the line has to be rebalanced.
Volume plan or shift pattern changes.
Recalculate available time divided by demand.
Check every station’s cycle time against the new takt.
Move work elements; add or remove operators.
Reissue standardized work and train the team.
Confirm cycle times on the floor for the first shifts.
A faster takt needs more stations or more people. A slower takt lets work be combined. Either way, old standardized work no longer fits.
Plants that keep cycle time data current can rebalance in days. Discuss your next rate change with our advisors.
Common Takt and Cycle Time Mistakes
Most problems come from a handful of habits.
- Takt calculated once and never revisited
- Cycle time taken from a stopwatch study years ago
- Averages used, peaks ignored
- Bottleneck station not identified
- Stops and defects left out of the JPH plan
- Mixed-model effects handled by overtime
- Takt recalculated with every demand change
- Cycle time measured automatically on every job
- Cycle time tracked by variant
- Bottleneck shown live to team leaders
- Planned cycle time set below takt
- Sequence rules protect heavy stations
None of this needs new theory, only current data. A line review shows where your lines stand.
Takt and Cycle Time Checklist
A quick check for any assembly line.
Most lines pass on takt and fall short on live cycle time data. We can close that gap in a pilot.
How iFactory Tracks Takt and Cycle Time
iFactory reads cycle time for every job from your line controls and compares it with takt, station by station.
Measured on every job from PLC signals.
Each station shown as a share of takt.
Cycle time by model and option.
The station limiting JPH right now.
Built from real data, not old studies.
Hour-by-hour output against plan.
It runs on premises and connects to your PLCs and MES. Share one line’s data and we will chart it in a working session.
See Which Stations Are Over Takt Right Now
Share cycle time signals from one line. We chart every station against takt, by variant, and show which one is holding back JPH.
Cycle time averages 61.5 s against a 60 s takt on high-option cars. The station recovers on base models, but two heavy cars in a row push it over.
An Overcycle Found and Rebalanced
This is how a production supervisor might use live takt tracking.
iFactory ships as a pre-configured NVIDIA AI server, racked and ready with the line balancing and cycle time models loaded. Rack it, plug in power and Ethernet, and the AI is live. Scope covers data connections across press, body, paint, assembly and machining areas, PLC/SCADA, MES, CMMS and ERP integration, cabling and network setup, team training and 24×7 remote monitoring.
Server installed, PLC, MES and CMMS links live, history loaded.
Models tuned on your own lines, then piloted in one area with your team reviewing every output.
Rollout to the agreed lines, team training done, 24×7 remote monitoring in place.
Software, server and integration come as one package. For pricing, contact our sales team.
Frequently Asked Questions
Takt time equals available production time divided by customer demand. For example, 26,400 seconds of available time and 440 vehicles gives a takt of 60 seconds.
Takt time is the pace needed to meet demand. Cycle time is the measured time a station takes to complete one job. Cycle time should sit just under takt.
Divide 3,600 by takt time in seconds. A 60-second takt gives 60 jobs per hour; a 90-second takt gives 40.
The station cannot keep up. Work spills into the next station, the line stops or vehicles leave incomplete, and jobs per hour fall.
An operator balance chart that stacks each operator’s work elements against the takt line, used to balance work across stations.
A first line is typically live within 6–12 weeks. Plan it with our specialists.
Keep Every Station Under Takt
iFactory measures cycle time on every job, compares it with takt and shows the station holding back JPH, so the line hits its number.
Illustrative. Bars above about 95% leave no room for variation; bars far below it show spare time.