Predicting Boiler Tube Leaks Before They Cause Forced Outages
By Jackson T on June 17, 2026
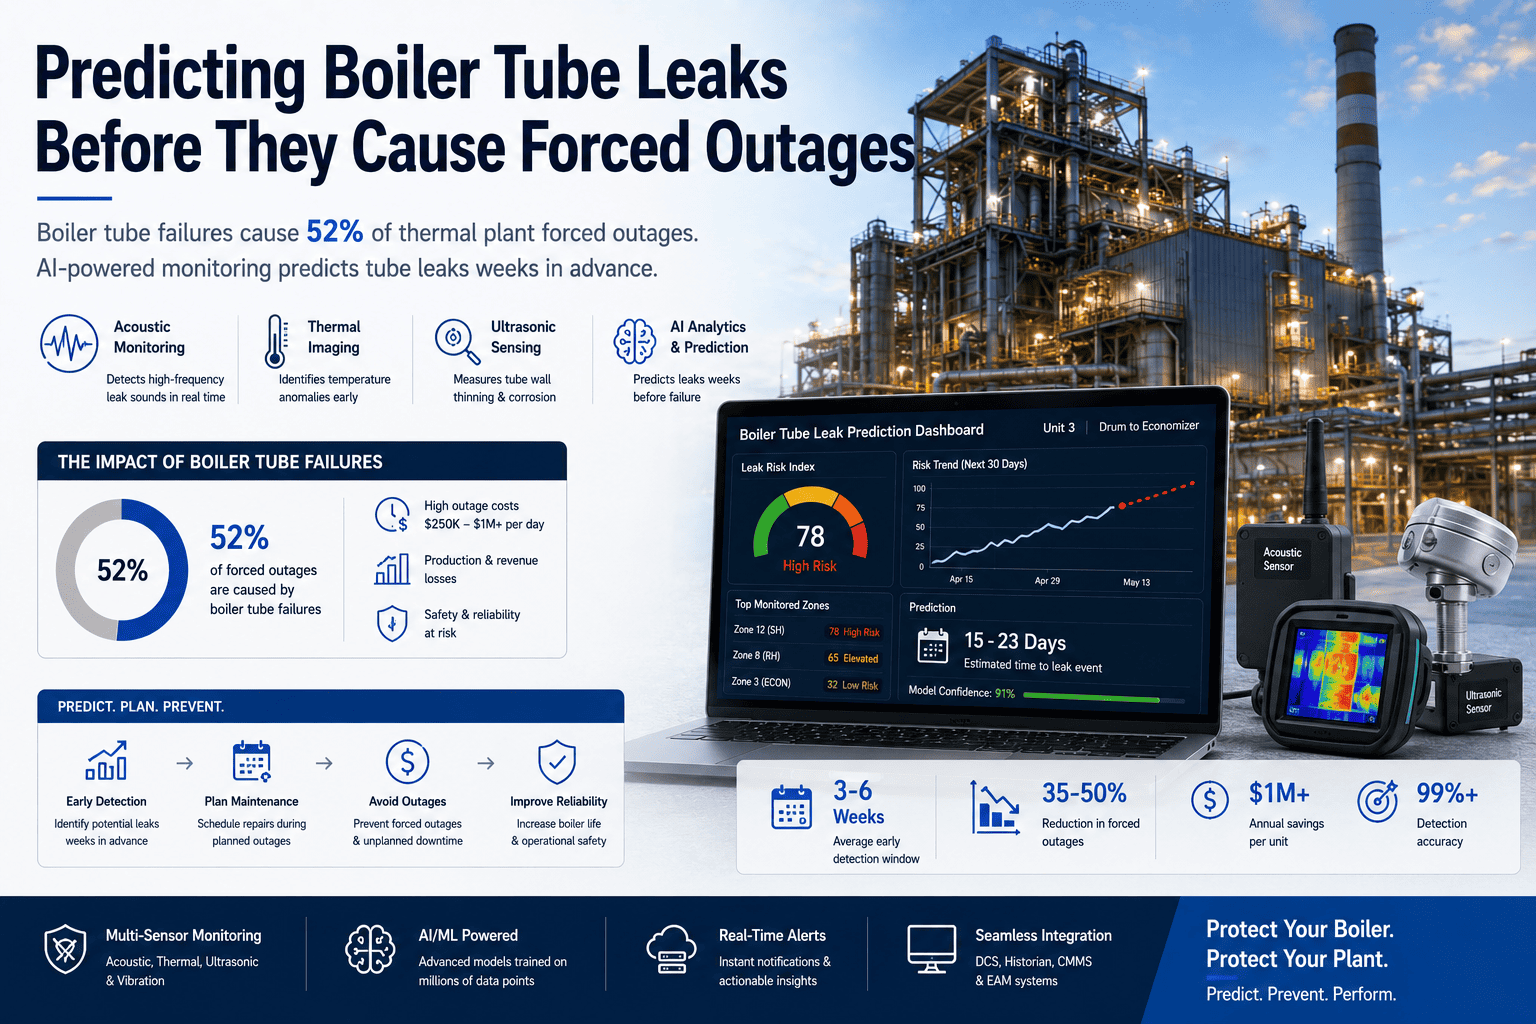
Boiler tube leaks are the single largest source of forced outages in thermal power generation — 52% of unplanned shutdowns across the coal-fired fleet, per NETL data — and the average tube failure on a 500 MW unit costs more than $3 million in lost generation against an average 3.6 days of repair. The expensive truth is that almost every one of those failures was leaving a signature for weeks before the rupture: an ultrasonic acoustic emission the maintenance team will never hear with the naked ear, a thermal anomaly visible only if you knew where to look, a sodium tracer trending up by parts per billion. The signals are already in the plant. An iFactory boiler tube leak prediction module reads acoustic, thermal, water chemistry, and ultrasonic thickness signals together, runs them through an AI model trained on this specific boiler and ore body, and flags the developing leak weeks before it forces the unit offline.
iFactory AI · Power Plant Reliability
Predicting Boiler Tube Leaks Before They Cause Forced Outages
Acoustic emission, thermal imaging, water chemistry, and ultrasonic thickness fused into a single AI model trained on your specific boiler — flagging the developing leak weeks before it ruptures, not hours after.
Why BTLs Account for More Than Half of Every Forced Outage
A waterwall tube rupture at 03:00 forces an emergency boiler shutdown, ninety-six hours offline, and $2.4 million in lost revenue while the plant scrambles to locate spare tubes and qualified welders. A superheater tube failure that could have been caught during the last planned outage instead becomes a mid-campaign rupture and a ten-day emergency repair. Economizer tube erosion that accumulated for eighteen months propagates from a pinhole to a full rupture inside forty-eight hours. The pattern is the same on every site that runs reactive: the signature was there for weeks, nobody saw it, the failure was catastrophic. The pattern reverses the moment the boiler is fully instrumented and the signals are fused.
Where Tubes Actually Fail — Boiler Anatomy
Roughly forty percent of all boiler tube failures occur in the water walls, with the rest distributed across the second superheater, first reheater, first superheater, and economizer. Each zone has a characteristic set of failure modes driven by its operating temperature, the gas-side environment, and the water chemistry it sees. The schematic below shows where the leaks actually originate on a typical coal-fired boiler and which zones carry the highest historical failure rates.
1
Economizer · cold-end acid dew-point corrosion
2
Reheater · creep + oxide-scale exfoliation
3
Superheater · long-term overheat, high-temp creep
4
Right water wall · fly ash + soot-blower erosion
5
Left water wall · corrosion fatigue, hydrogen damage, caustic gouging
Numbered failure hot zone
Tube bank area
Burner
The Six Failure Modes That Cover Almost Every BTL
NETL and EPRI classifications converge on roughly the same shortlist. Six mechanisms account for the great majority of boiler tube failures, and each one leaves its own signature in the acoustic, thermal, chemistry, and thickness data — which is precisely what makes multi-sensor fusion the right architecture for catching them.
Failure Mode
Primary Location
Mechanism
Detection Signature
Lead Time
Corrosion Fatigue
Water walls
Cyclic stress combined with corrosive environment; load-cycling units most exposed.
Acoustic emission + chemistry trend (Na/Fe)
2-4 wks
Hydrogen Damage
Water walls (fire side)
Under-deposit corrosion releases atomic hydrogen, decarburization and microcracking follow.
Chemistry (cation conductivity) + UT thinning
1-2 wks
Caustic Gouging
Water wall waterline
NaOH concentration under deposits dissolves the protective magnetite layer; bare steel attacked.
Chemistry (Na trend, pH excursion)
3-6 wks
Fly Ash Erosion
Economizer, reheater
Particulate-laden flue gas impingement wears the tube OD; accelerates with high-ash coals.
Thermal IR + UT thinning trend
4-8 wks
Soot Blower Erosion
Superheater, generating bank
Steam jet impingement during cleaning cycles wears tube OD over time; lance alignment a factor.
Want this catalog mapped against your boiler's actual failure history? Talk to a reliability specialist and we'll walk through the last five years of your BTL reports.
Multi-Sensor Fusion — How the AI Hears, Sees, and Smells the Leak Forming
No single sensor catches every failure mode. Acoustic emission picks up the ultrasonic signature of micro-leaks but is blind to slow erosion. Thermal IR sees hot spots but not water-chemistry excursions. Water chemistry is the earliest warning for corrosion modes but lags for mechanical damage. UT thickness is definitive but only at the inspection points. The architecture that catches all six failure modes runs all four streams in parallel and fuses them at the model level.
Stream 1
Acoustic Emission
Array of high-frequency transducers around the boiler walls. Detects the ultrasonic signature of pinhole steam escapes the human ear cannot hear.
Trained on this boiler's operating history and the local failure-mode population. Cross-references all four streams cycle by cycle, learns which combinations precede which failures, and updates the prediction every shift.
↓
Output
Time-to-Failure Estimate + Recommended Action
Specific tube zone, failure mode, projected days-to-rupture, and the recommended inspection or repair action ahead of the next planned outage window.
Detection Lead Times — Hours, Days, or Weeks
The detection lead time is the entire ROI calculation. A leak found at the rupture costs the full forced-outage bill. The same leak found weeks ahead becomes a scheduled repair during a planned outage window — same physical work, an order of magnitude less cost.
Reactive
Hours
Visible steam, drum-level deviation, water makeup spike
Full forced-outage cost
Acoustic only
1-3 days
Ultrasonic emission heard at the wall before steam escapes
Reduced outage if caught at shift
Multi-sensor AI
Weeks
All four streams fused; degradation flagged before pinhole forms
Planned-outage repair, no forced outage
Want lead times benchmarked against your last five forced outages? Book a demo and we'll walk through the historical signatures.
What Changes in the Maintenance Plan
The biggest shift is upstream of the failure, in the maintenance planning cycle. The reactive program runs around the next expected rupture. The proactive program runs around the next planned outage window — and the entire campaign of inspections, tube replacements, and chemistry adjustments is sequenced against the AI's degradation projections rather than against the calendar.
Reactive maintenance
Built around the rupture
BTL repair scheduled after the unit forces offline
Inspection scope set by RCFA on the last failure, not the next one
Tube spares ordered after the call, lead time stretches the outage
Water chemistry adjustments after assays surface deviations
Planned outage scope reactive to the campaign that just ended
Predictive maintenance
Built around the next planned outage
BTL risk ranked across zones weeks before the window opens
Inspection scope driven by the AI's degradation projections
Tube spares staged in advance; outage duration minimized
Chemistry trends drive interventions before the corrosion fires
Planned outage scope built proactively from the current model state
Standing Up a BTL Prediction Pilot in Four Weeks
The pilot does not need every sensor in place on day one. The fastest path to a useful first prediction is to connect the streams you already have — water chemistry analyzers, the historian, and existing UT inspection records — and add acoustic and thermal coverage in parallel. Most plants have first-pilot predictions running inside four weeks, with the full multi-sensor model maturing over the following ten to twelve weeks.
1
Connect Existing Streams (Wk 1)
Read-only attach to the water chemistry analyzers, the steam-cycle historian, and the UT inspection database. Five years of historical failure records loaded into the model.
2
Baseline the Boiler (Wk 2)
AI learns this specific boiler's failure-mode population and the chemistry envelope it actually runs in. Live degradation dashboard goes up for the reliability team.
3
Deploy Acoustic + Thermal (Wk 3)
Acoustic emission array and thermal IR cameras installed and feeding the fusion model. No boiler downtime required — sensors mount externally to the existing skin.
4
First Prediction Live (Wk 4)
First multi-sensor degradation projection on the operator and reliability console. Refines weekly as the model accumulates this boiler's specific cycle-to-cycle behavior.
Want this 4-week shape scoped against your boiler and your reliability team's cadence? Talk to a specialist and we'll lay it out unit by unit.
Frequently Asked Questions
Can we predict BTLs with acoustic emission alone?
Acoustic catches the very late stage — the ultrasonic emission of an active micro-leak, which usually buys one to three days of lead time before the rupture. That is useful, but it misses the corrosion modes (caustic gouging, hydrogen damage, creep) that develop silently for weeks. Multi-sensor fusion is what turns days into weeks of lead time, which is what changes the outage from forced to planned.
Do we need to take the boiler offline to install sensors?
No. Acoustic emission transducers and thermal IR cameras mount externally to the boiler skin and the casing — no internal access required. The water chemistry instruments and the historian connections are read-only and require no process changes. Installation is during normal operation, and there is no validated-stack disturbance.
Will this work on older boilers?
Yes. The pilot deliberately starts with the data already on the unit — water chemistry analyzers, the historian, and the UT inspection records, all of which exist on practically every coal-fired boiler regardless of age. Acoustic and thermal coverage are added externally and do not depend on the age of the controls. Most installations target boilers that are decades old; that is where the BTL bill is highest.
How does this interact with our existing CMMS and outage planning?
The AI's degradation projections feed the CMMS as work-order recommendations with projected days-to-failure and the recommended inspection scope. The reliability team accepts, modifies, or rejects them — and the next planned outage gets sequenced against the projections rather than against the calendar. The CMMS stays the system of record; the AI sharpens what goes into it.
What about ROI in the first year?
Most plants justify the system on a single avoided forced outage. A 500 MW unit BTL forced outage averages $3 million-plus in lost generation and repair. The pilot itself costs a fraction of that, and most installations see positive ROI inside the first twelve months from a single shifted outage — usually a corrosion mode that was developing for weeks before the prediction flagged it.
Weeks of lead time. Planned outages. No 3 AM ruptures.
See the BTL Prediction Model Running on Your Boiler
Bring one unit — preferably the boiler with the highest BTL count over the last five years. We'll connect the water chemistry analyzers and the historian read-only inside the first week, baseline the failure-mode population from the unit's actual history, install acoustic and thermal coverage externally, and have the first multi-sensor degradation projection on your reliability console by week four. The next planned outage builds its scope from the model — not the other way around.