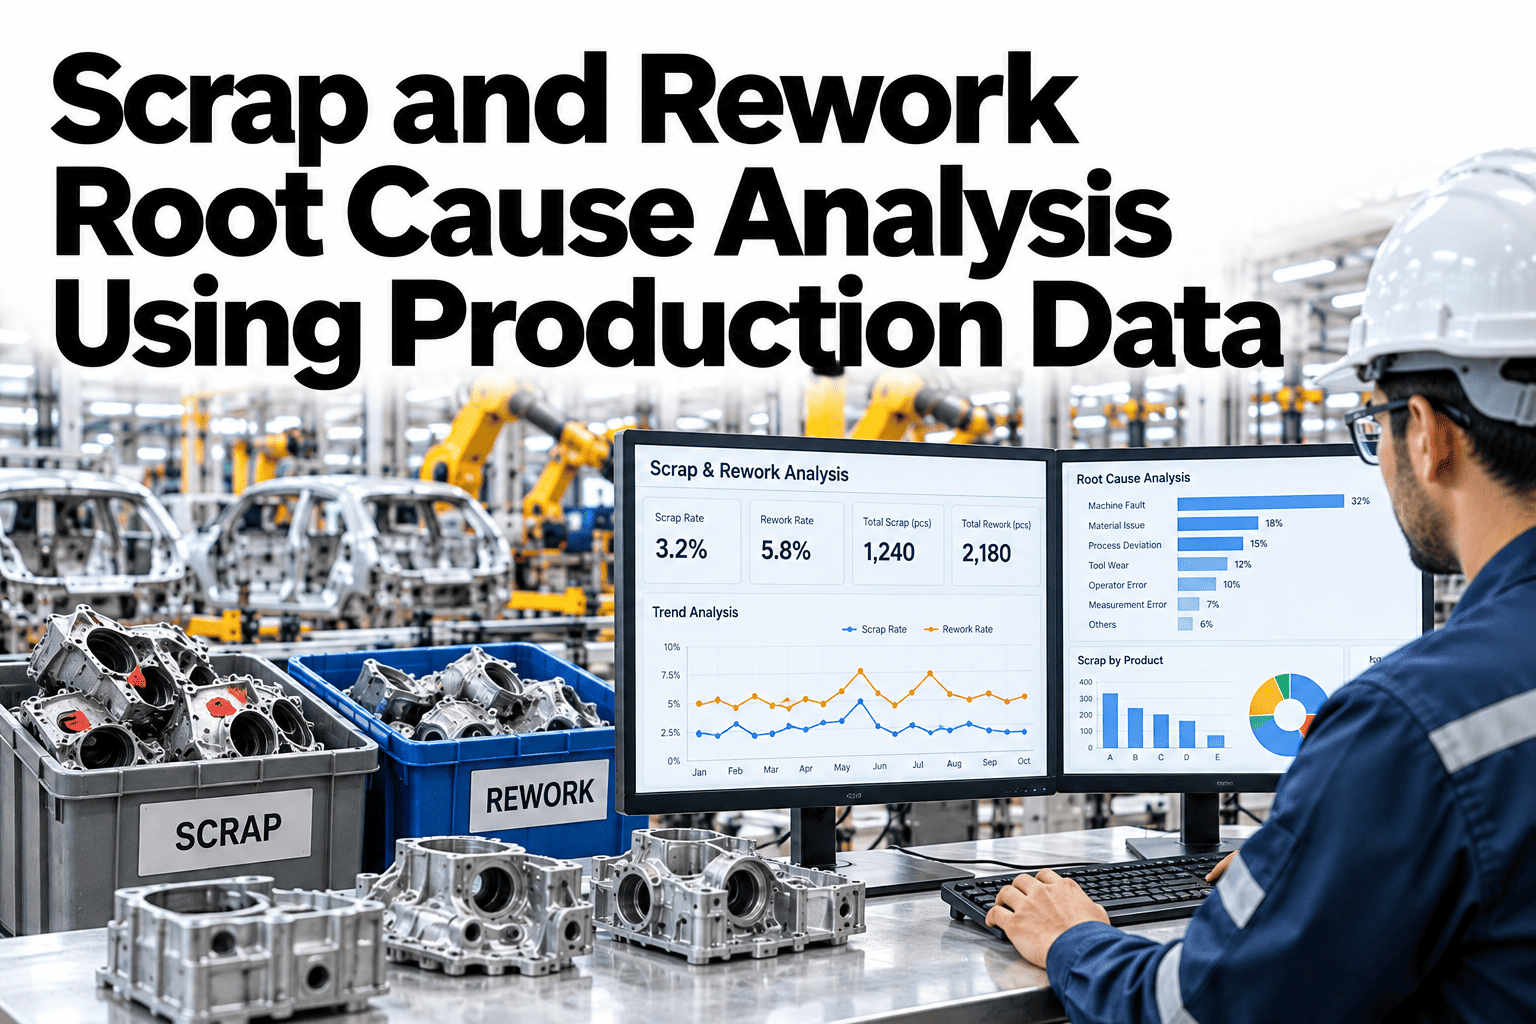
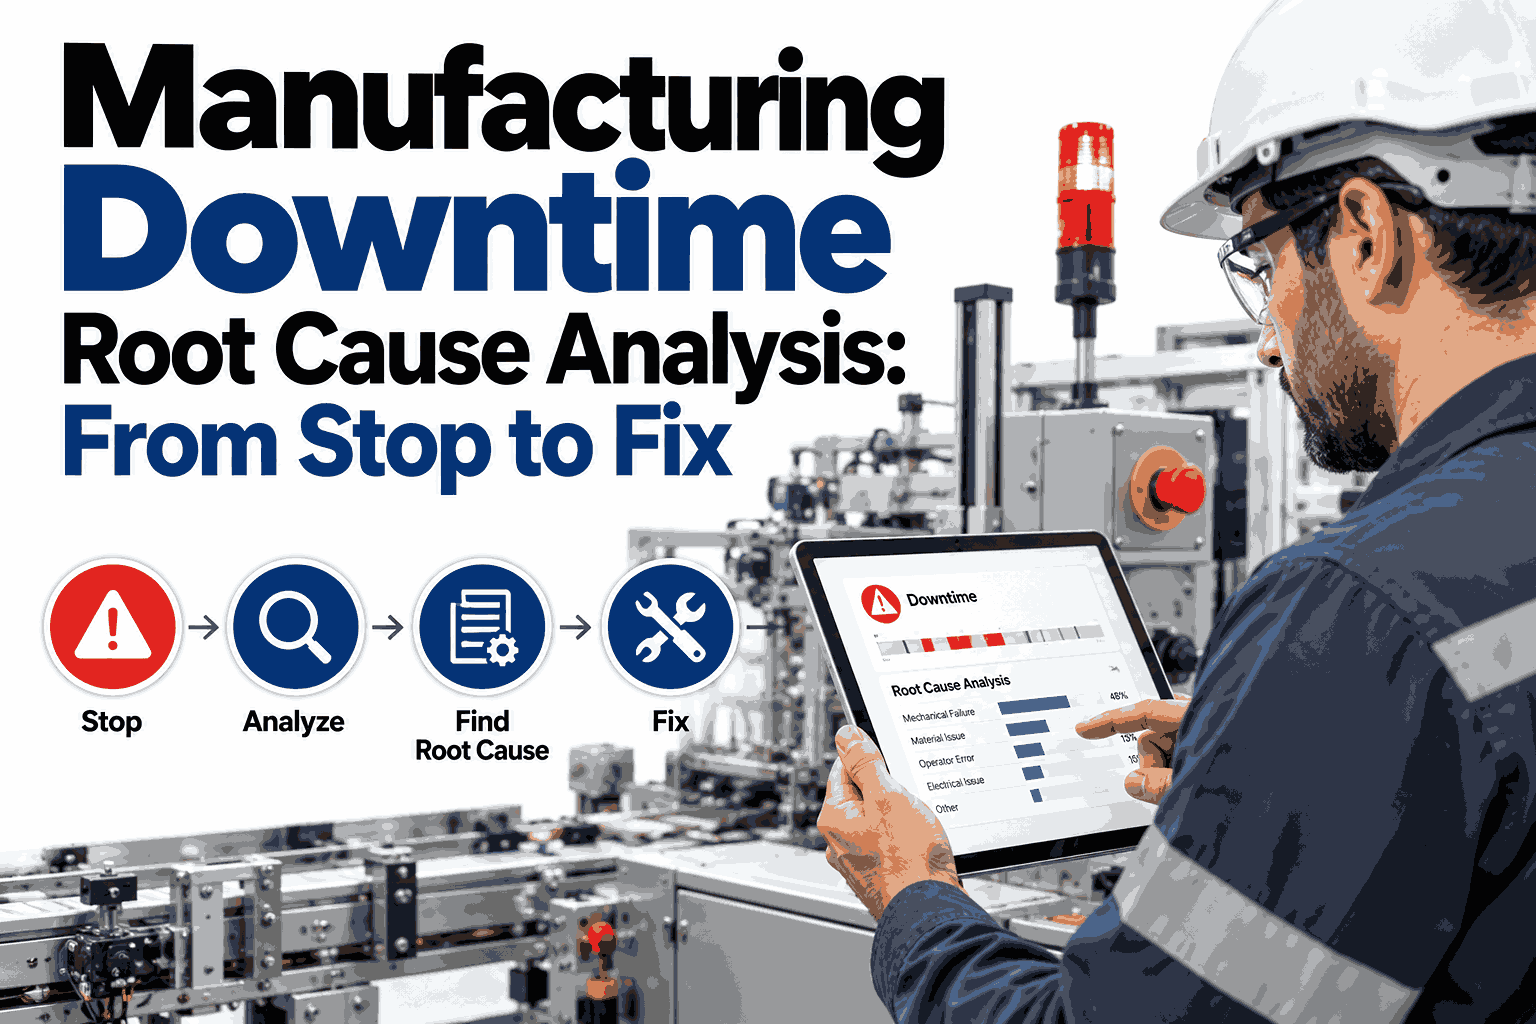
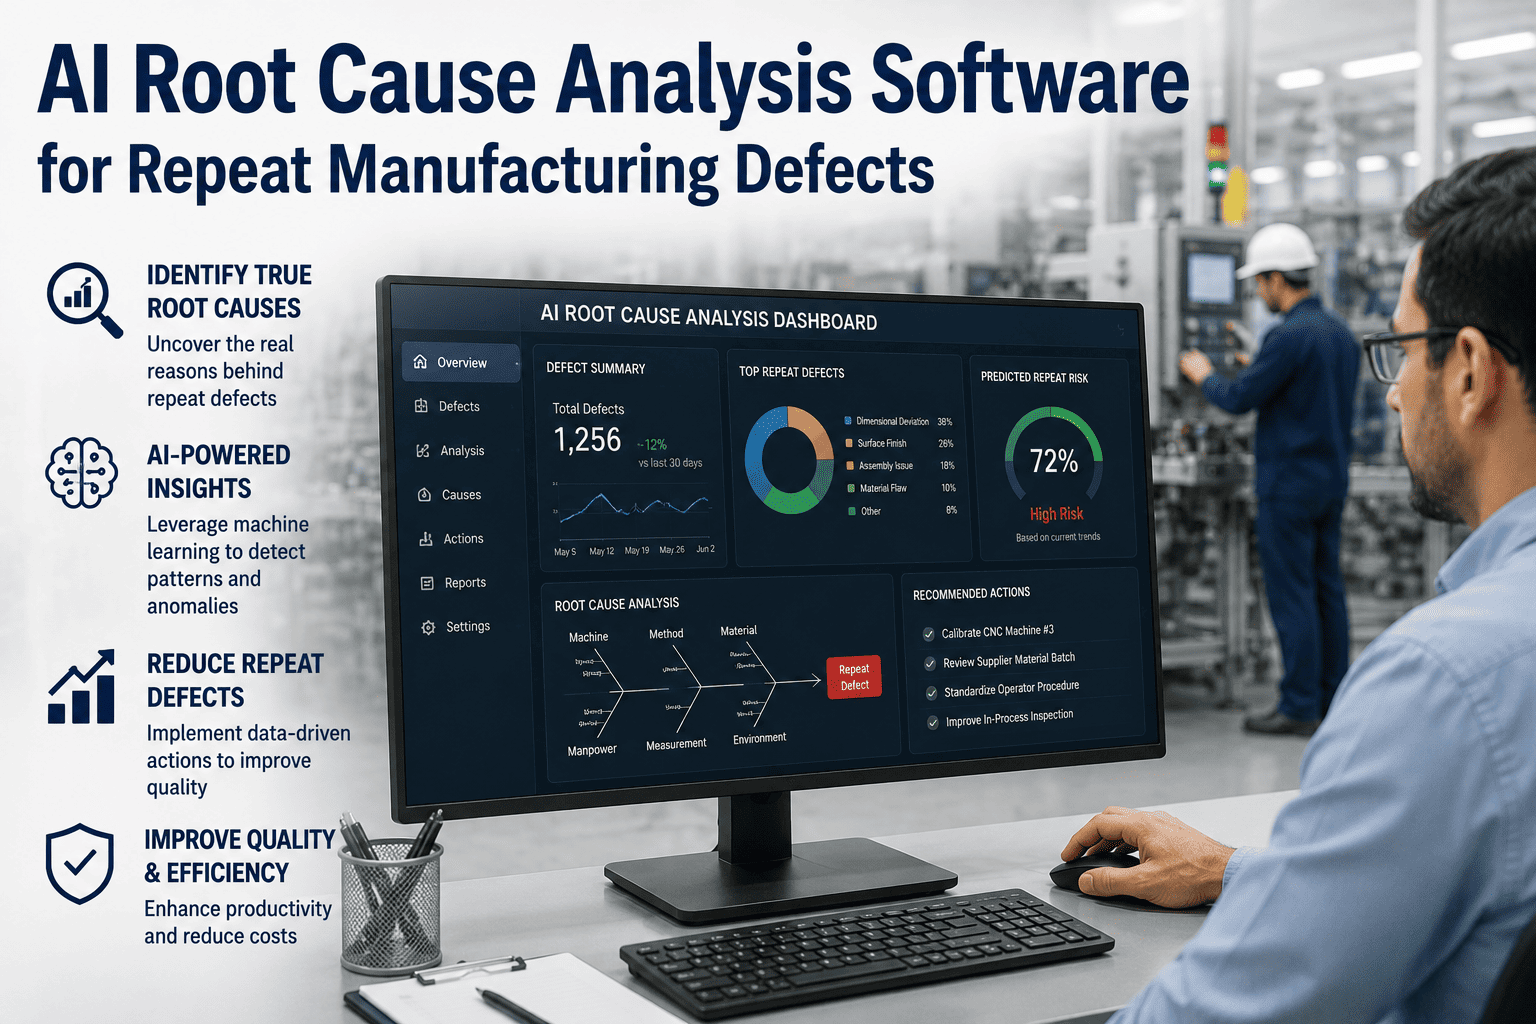
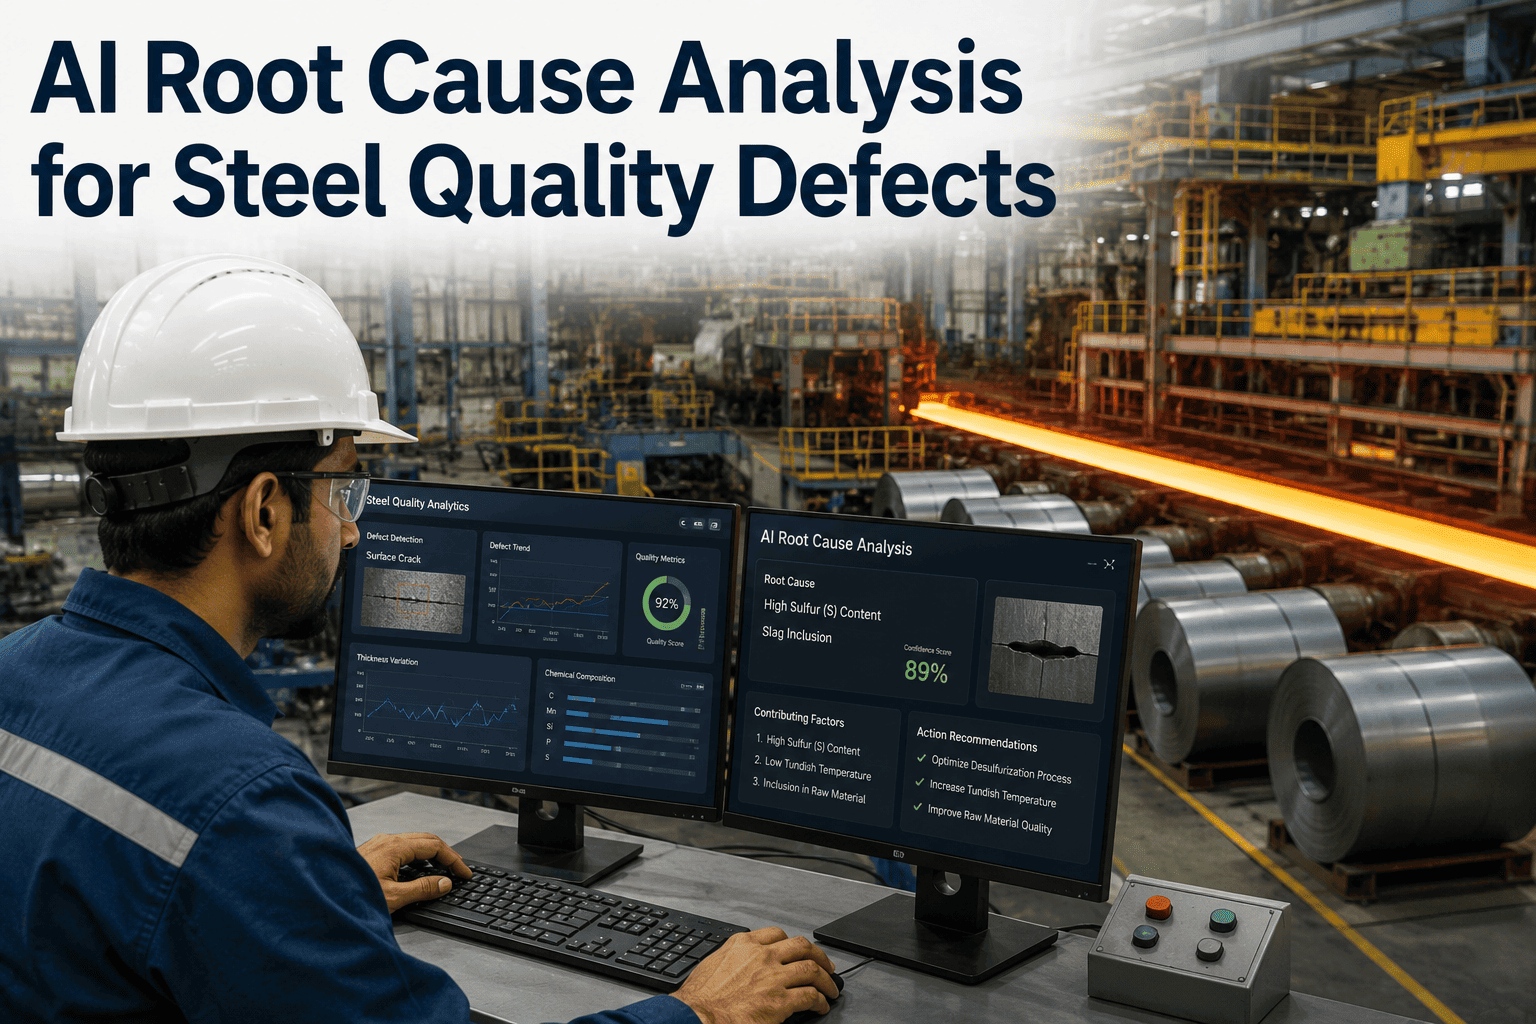
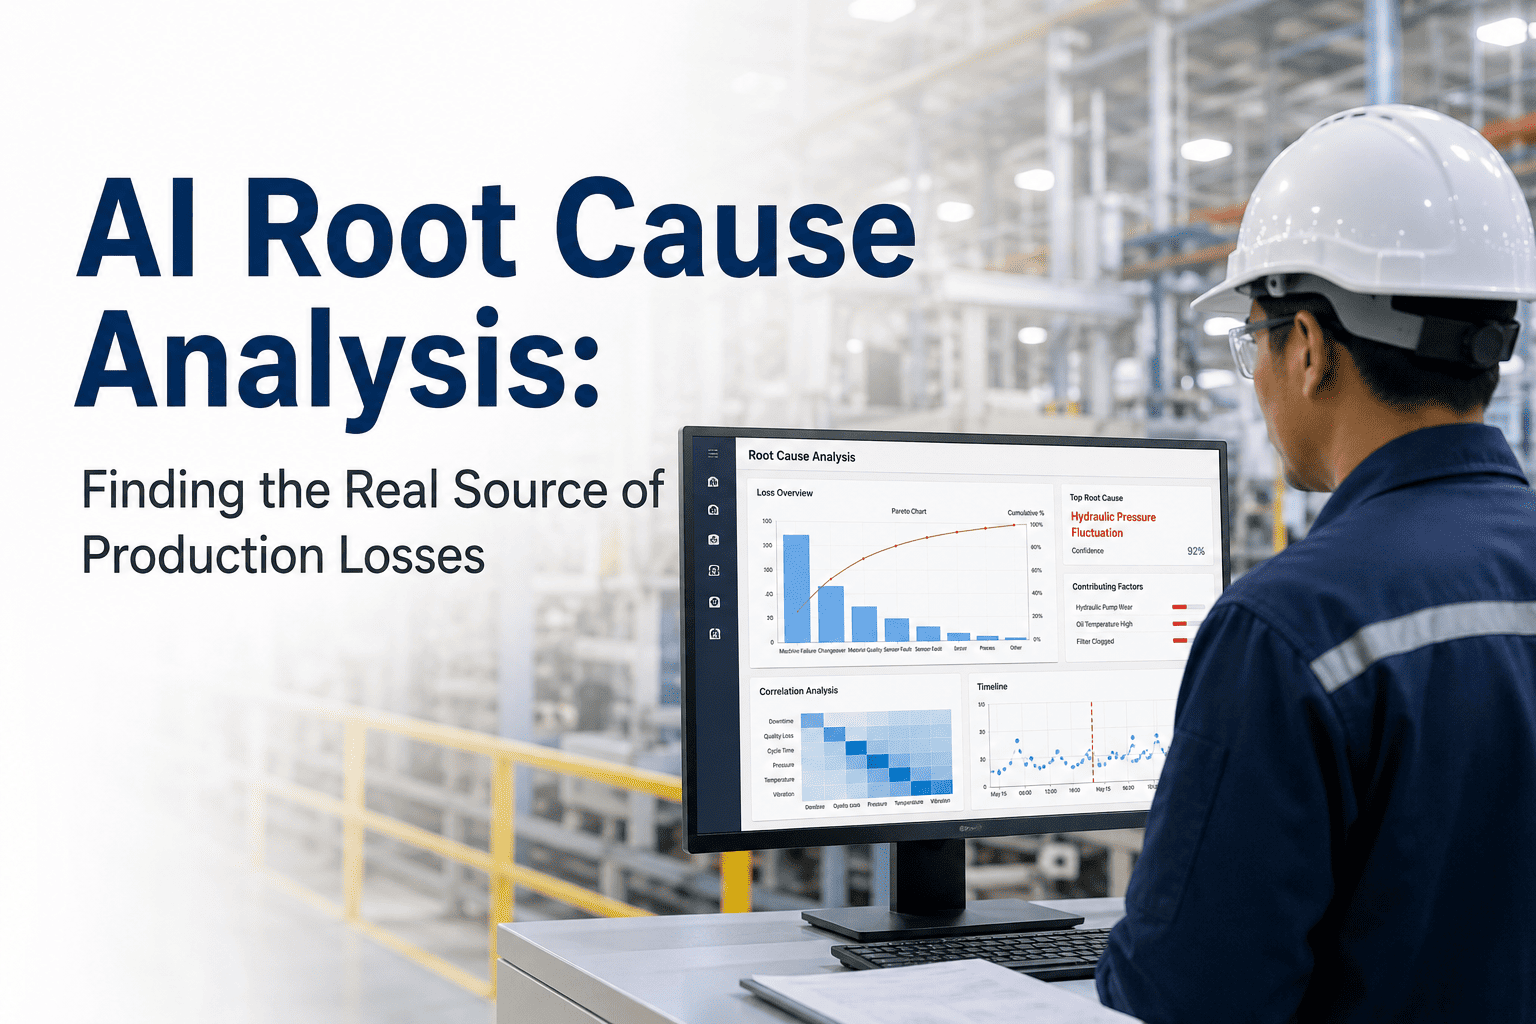
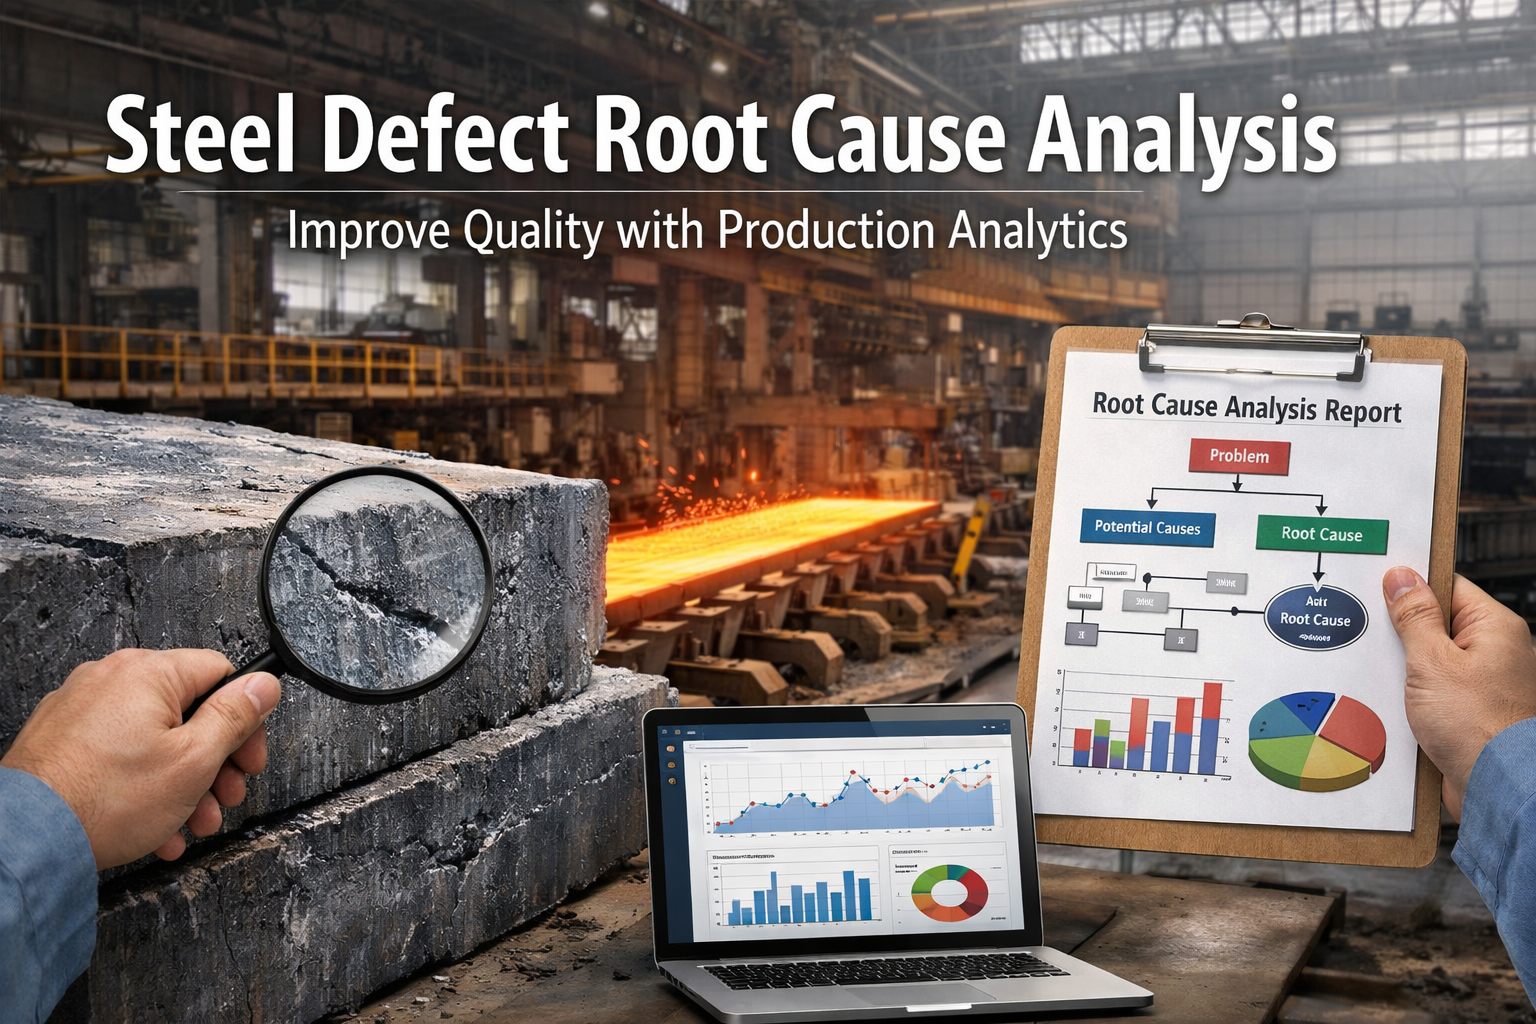
Cross-functional root cause analysis finds the true source of downtime, defects, scrap and speed loss by joining production, quality, maintenance and machine data on one timeline, instead of letting each department investigate alone. Most losses have causes that cross team boundaries, which is why single-team investigations so often end with a fix that does not last. Quality-related costs reach 15 to 20 percent of sales at many manufacturers (ASQ, 2026), and total failure cost is often estimated at around ten times the visible scrap (Fabrico, 2026). iFactory, an on-premise AI platform for smart manufacturing, builds the shared evidence base, and teams can walk a real loss event through all four data sources in a short session.
Manufacturing Analytics · Root Cause
Four Teams, Four Stories, One Loss Event
iFactory AI puts production, quality, maintenance and machine data on one timeline, so the cause is found once and fixed for good.
Production
Quality
Maintenance
Machine
One shared timeline of the loss event
Verified root cause
The definition
What Is Cross-Functional Root Cause Analysis in Manufacturing?
It is a root cause method where every team contributes evidence to one shared record of an event. The aim is a cause that explains all the symptoms, not only the ones one department can see.
Single-team analysis
One data source, one view
Cause fits that team's tools
Problem returns after the fix
Cross-functional analysis
Four data sources, one timeline
Cause explains every symptom
Fix addresses the real driver
The blind spots
Why Does Single-Department Analysis Miss the Cause?
Each team sees one slice. Each slice looks like a different problem.
Production sees
Slow speed and stops, but not the material or wear behind them.
Quality sees
Defects and rejects, but not the machine state at that minute.
Maintenance sees
Repairs and asset history, but not the product effect.
Machine data sees
Signals and states, but not their business meaning.
Plants that track only scrap understate cost, since total failure cost is often estimated near ten times visible scrap (Fabrico, 2026).
Joining the slices is the difference between a guess and a diagnosis. To see this on your own events, ask our team how the four data sources are aligned.
Stop Arguing About Whose Data Is Right
Bring one recurring loss. iFactory AI will line up all four data sources and show what the evidence says.
The evidence matrix
Which Data Explains Which Type of Loss?
Each loss type needs a different mix of sources. The matrix shows where the evidence usually sits.
| Loss Type | Production Data | Quality Data | Maintenance Data | Machine Data |
|---|
| Downtime | Stop times, product | Hold decisions | Work orders, parts | Fault codes, states |
| Defects | Lot, shift, speed | Defect type, location | Wear and repair history | Process parameters |
| Scrap | Units started and made | Reject reasons | Tool and part condition | Startup and drift signals |
| Speed loss | Cycle time versus ideal | Rework rate | Degradation signs | Micro-stop patterns |
A composite scenario
What Does a Joined View Find That Separate Views Miss?
Picture repeated night-shift stops on one line. Each team has a different explanation, and none of them holds up alone.
Separate views
Maintenance: motor tripped, replace motor
Production: operators ran too fast
Quality: no issue found
Result: stops return in two weeks
Joined view
Material lot changed on night shift
Torque rose on that lot
Motor tripped under the higher load
Result: lot spec fixed at the source
Illustrative. The motor was never the root cause, only the place the symptom appeared.
The workflow
How Do You Run a Cross-Functional Root Cause Analysis?
Six steps keep the work evidence-led and shared across teams.
1
Define the loss
State what, where and how much.
2
Gather all four sources
Production, quality, maintenance, machine.
3
Align on a timeline
Put every event on one clock.
4
Test hypotheses
Check each cause against the evidence.
5
Verify with a trial
Prove the cause with a controlled change.
6
Fix and monitor
Act, then watch the loss stay down.
Step five matters most, because a cause that is only plausible is not yet a root cause. To run the six steps with support, plan a structured loss review with our specialists.
The role of AI
How Does AI Speed Up Root Cause Analysis?
AI does the slow part: searching thousands of event combinations for patterns that repeat before each loss.
Finds patterns
Conditions that repeat before each event
Ranks suspects
Likely causes ordered by evidence strength
Shows the trail
Signals and records behind each suggestion
Leaves the decision
Engineers confirm, test and decide
iFactory is delivered on an on-premise NVIDIA server, live in 6–12 weeks, with integration, training and 24×7 remote monitoring in scope. For details, ask support how analysis runs on-premise.
PitfallsWhy Do Cross-Functional Investigations Still Fail?
Joining data is necessary but not enough. Teams also need habits that keep the work honest.
Starting with a favorite cause
List several hypotheses first and let the evidence rank them, so the loudest opinion does not win.
Skipping the timeline
Put every event on one clock before discussing causes, since the order of events is the strongest clue.
Stopping at the first why
Keep asking until the answer is a process, material or design condition that can actually be changed.
No owner for the fix
Name one accountable person and a due date, or the finding stays a slide in a deck.
Never checking the result
Track the loss for weeks after the fix and confirm it stayed down.
A short checklist at the start of each review prevents most of these. For a ready-made version, ask support for a root cause review template.
Key termsWhich Terms Keep the Team Aligned?
Clear words keep a mixed team on the same page. Six terms matter most.
Root cause
The condition that, once removed, prevents the loss from recurring.
Contributing factor
A condition that raises the chance of a loss but does not cause it alone.
Symptom
What a team observes, such as a stop or a reject.
Timeline alignment
Placing events from all systems on one shared clock.
Corrective action
A change that removes the root cause.
Containment
A short-term step that limits damage while the cause is found.
To see these terms applied, review a worked loss event with our team.
Expert review
Running Root Cause Analysis Responsibly
Holds up
Shared evidence and a single timeline are core to good root cause practice, whatever the method used.
Verify
That timestamps match across systems and that stop and defect reasons use agreed codes.
Avoid
Treating a correlation as proof. Test each suspected cause with a controlled change.
Questions
Frequently Asked Questions
What is cross-functional root cause analysis?
It is a method where production, quality, maintenance and machine data are joined on one timeline so a loss is explained by all the evidence together. It avoids fixes that only treat one team's symptom.
See it applied to a real loss event.
Which data sources do we need?
At minimum, production counts and stop times, quality or reject records, maintenance work orders and machine state or process signals. Gaps can be handled but should be flagged.
Ask whether your sources are enough.
How is it different from a 5 Whys exercise?
Can AI find the root cause on its own?
Does our data stay on site?
Find the Cause That Stays Fixed
Book a session to see iFactory AI join your production, quality, maintenance and machine data for faster root cause work.