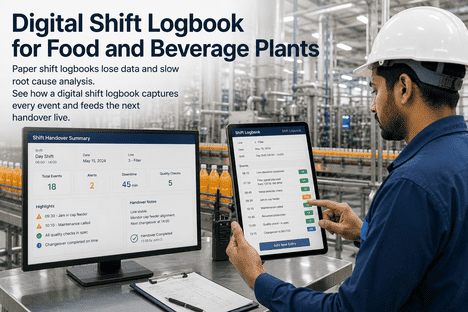
A shift OEE report has one job: decide what gets fixed tomorrow. Everything else is paperwork. Yet most food and beverage plants run it backwards — an operator spends the last twenty minutes of a shift hand-keying numbers into a spreadsheet that's outdated before the next crew clocks in, the incoming supervisor skims a fifteen-minute verbal handover that misses the details, and the report becomes a record nobody acts on. The plants pulling ahead read losses live while the shift is still running, hand over a two-minute structured summary instead of a verbal one, and turn the report into a queue of owned actions. iFactory's shift OEE reporting auto-populates from your PLC, SCADA, and MES — every microstop counted, every loss tagged, every action carried forward — on a turnkey on-premise NVIDIA stack that layers above your existing systems.
iFactory Shift OEE · Food & Beverage
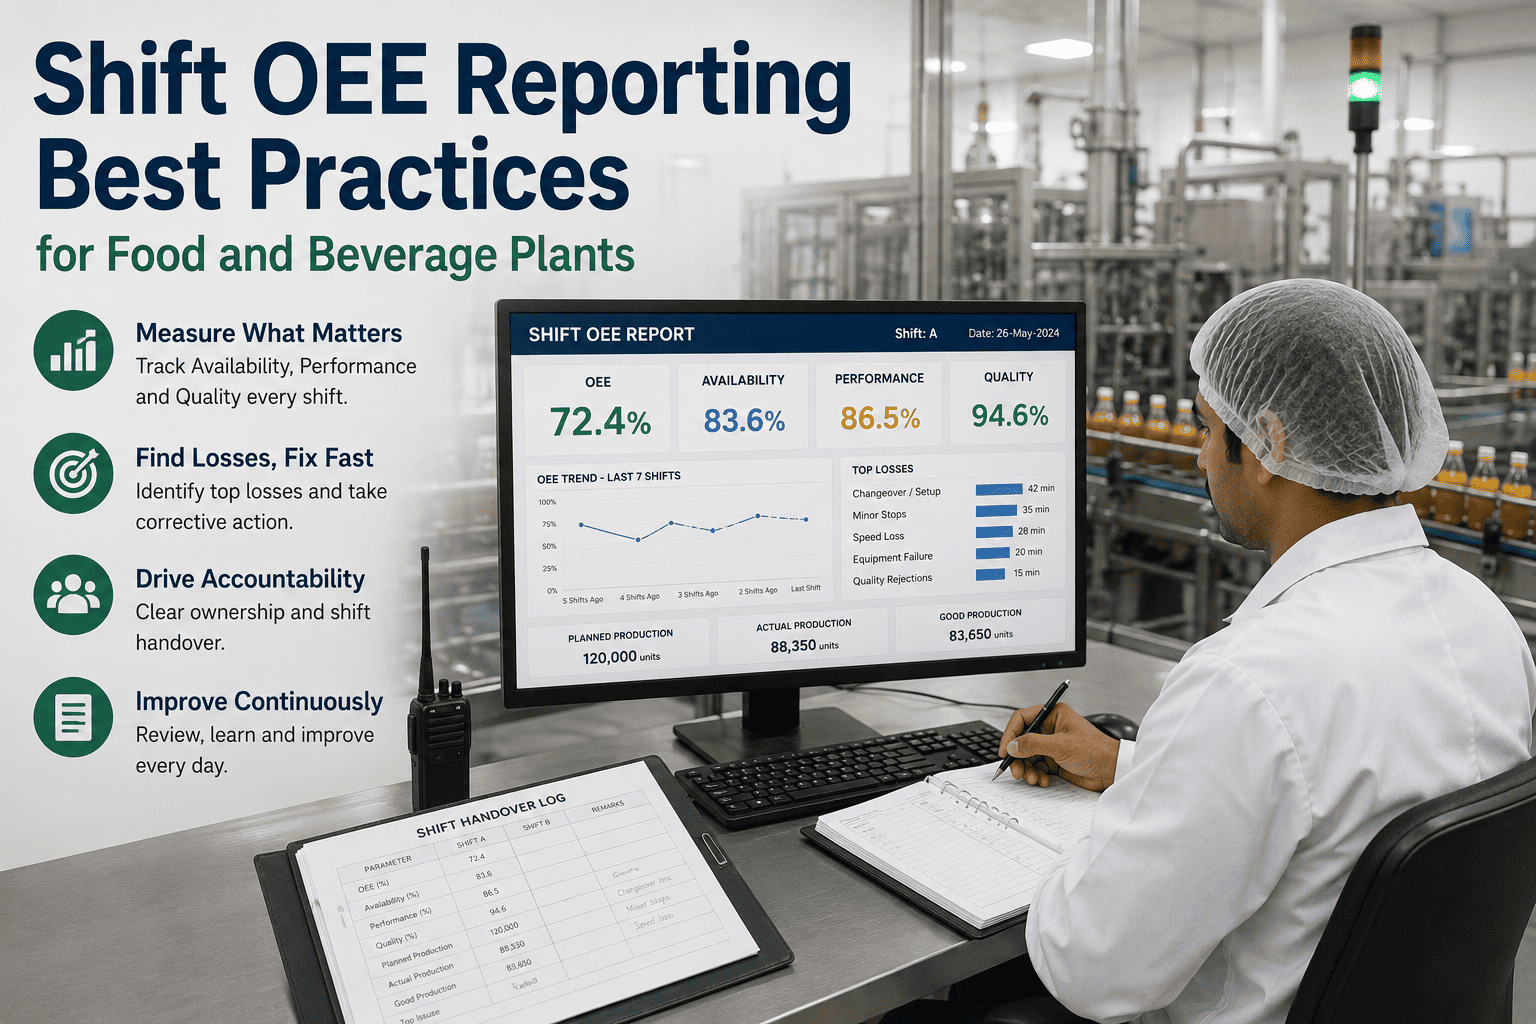
A Shift OEE Report That Drives Action, Not Paperwork.
Auto-populated from live machine data, handed over in two minutes, and built around owned actions — every microstop, changeover overrun, and CIP delay tagged while the shift runs. On a turnkey on-premise NVIDIA stack that sits above your PLC, SCADA, and MES.
2 min
handover vs 15-min verbal
4-7 pts
typical OEE gain once read live
Auto
populated from PLC/SCADA/MES
On-prem
layers above your stack
Why Most Shift Reports Fail
The problem isn't that plants don't measure OEE — it's that the measurement arrives too late and in the wrong shape to act on. A spreadsheet filled in at shift end is a tombstone: it records what happened after nothing can be done about it. Worse, manual entry systematically loses the small losses — the sub-five-minute microstops that operators never log but that quietly add up to the biggest recoverable bucket in a food line. A shift report that drives action has to be live, complete, and pointed at a decision.
The report that dies in a drawer
Hand-keyed at shift end, already stale
Microstops under 5 min never logged
Losses lumped as "downtime," no cause
Verbal handover, details lost
No owner, no follow-up next shift
The report that gets things fixed
Auto-populated live from machine data
Every microstop counted automatically
Each loss tagged to a coded cause
Structured 2-minute digital handover
Top losses become owned actions
Still filling reports by hand? Get a turnkey AI quote and we'll show your line's real microstop count against what the manual log captures.
What Belongs on a Food Plant Shift OEE Report
A good report is short and decision-shaped. Most of it auto-populates from systems you already have; only the human judgment — why a number moved, what the crew decided — needs a person. The structure below is the working set for an F&B line: enough to act, not so much it becomes the chore it replaced.
Auto
Shift OEE & the three factors
Availability, performance, quality for the shift, calculated from machine data — not a hand math exercise.
Auto
Output vs plan
Units produced against target, pulled from MES/ERP, per SKU run on the line this shift.
Auto
Downtime Pareto
Top loss causes ranked — microstops, changeover, CIP, breakdowns — so the biggest bar is obvious.
Auto
Quality & yield
Scrap, rework, first-pass yield, and any holds raised during the shift.
Human
Variance explanation
A short note required only when OEE deviates beyond a set threshold — the judgment a machine can't supply.
Human
Open actions & owners
Carried-over items, what was done, who owns the next step — the part that actually drives tomorrow.
The discipline that keeps it useful: variance notes are required only on real deviation — many systems trigger the manual explanation when shift OEE moves more than about 5% — so operators write where it matters and the rest fills itself in.
The Losses That Hide on a Food Line
Food and beverage lines leak capacity in places a coarse report never shows. The four below are where the hours actually go, and a shift report that tags each one separately is what turns "we had a bad night" into a fix with an owner. Every F&B plant has hours of capacity hidden in exactly these buckets.
Microstops
Sub-five-minute jams, gaps, and small stops — individually trivial, collectively the largest silent loss, and invisible to manual logging.
Changeover overruns
SKU and flavor changes running long. A handover that crosses mid-changeover is where the incoming crew restarts setup from scratch.
CIP & sanitation delays
Clean-in-place cycles overrunning their window, eating production time that never shows up as a "breakdown."
Silent yield loss
Giveaway, off-weight, and scrap that runs within tolerance but bleeds margin shift after shift.
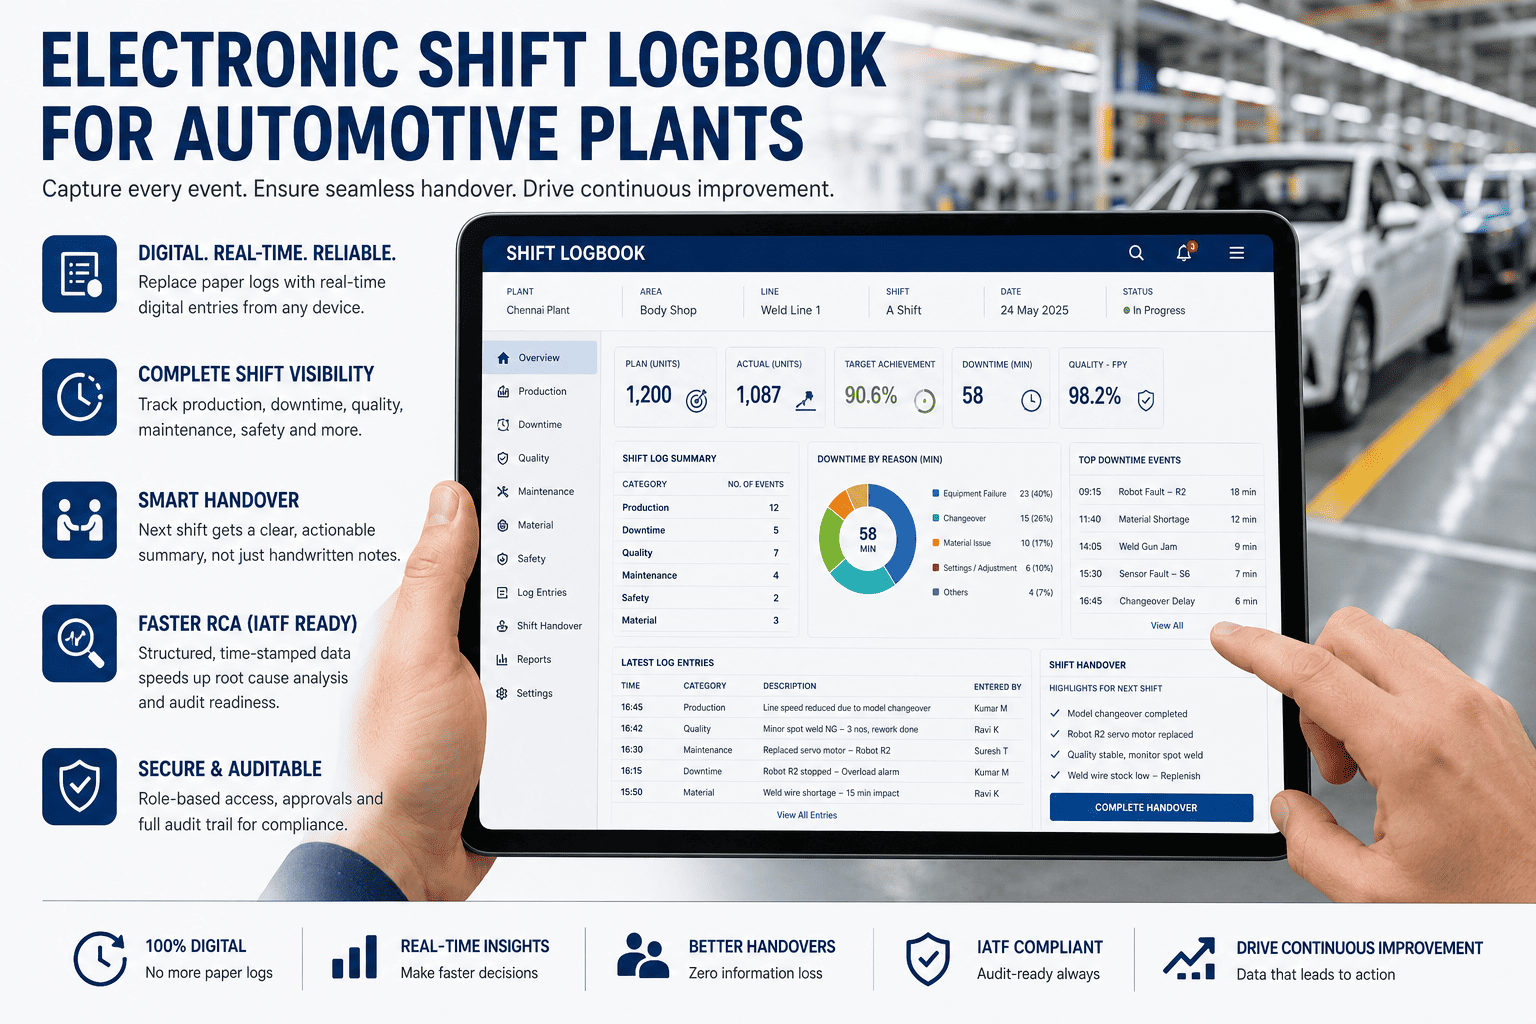
From Report to Action: Short Interval Control
A shift report shouldn't wait for shift end to matter. Short Interval Control runs the loop tighter — short, regular reviews during the shift where the live numbers, open issues, and actions are checked, so problems get caught while there's still time to act on them. The shift report then becomes the close-out of that running loop rather than a fresh data-entry task, and it carries open actions into the next shift instead of dropping them.
1
Read liveOEE, microstops, and losses visible on the floor in real time
2
Review at intervalsshort stand-ups check the numbers and open actions during the shift
3
Assign & acttop losses become actions with an owner, tracked in the system
4
Hand over & carrythe report closes the shift and passes open actions forward
Want the loop instead of the logbook? Start a 6-week pilot and we'll run live SIC and auto-handover on one line.
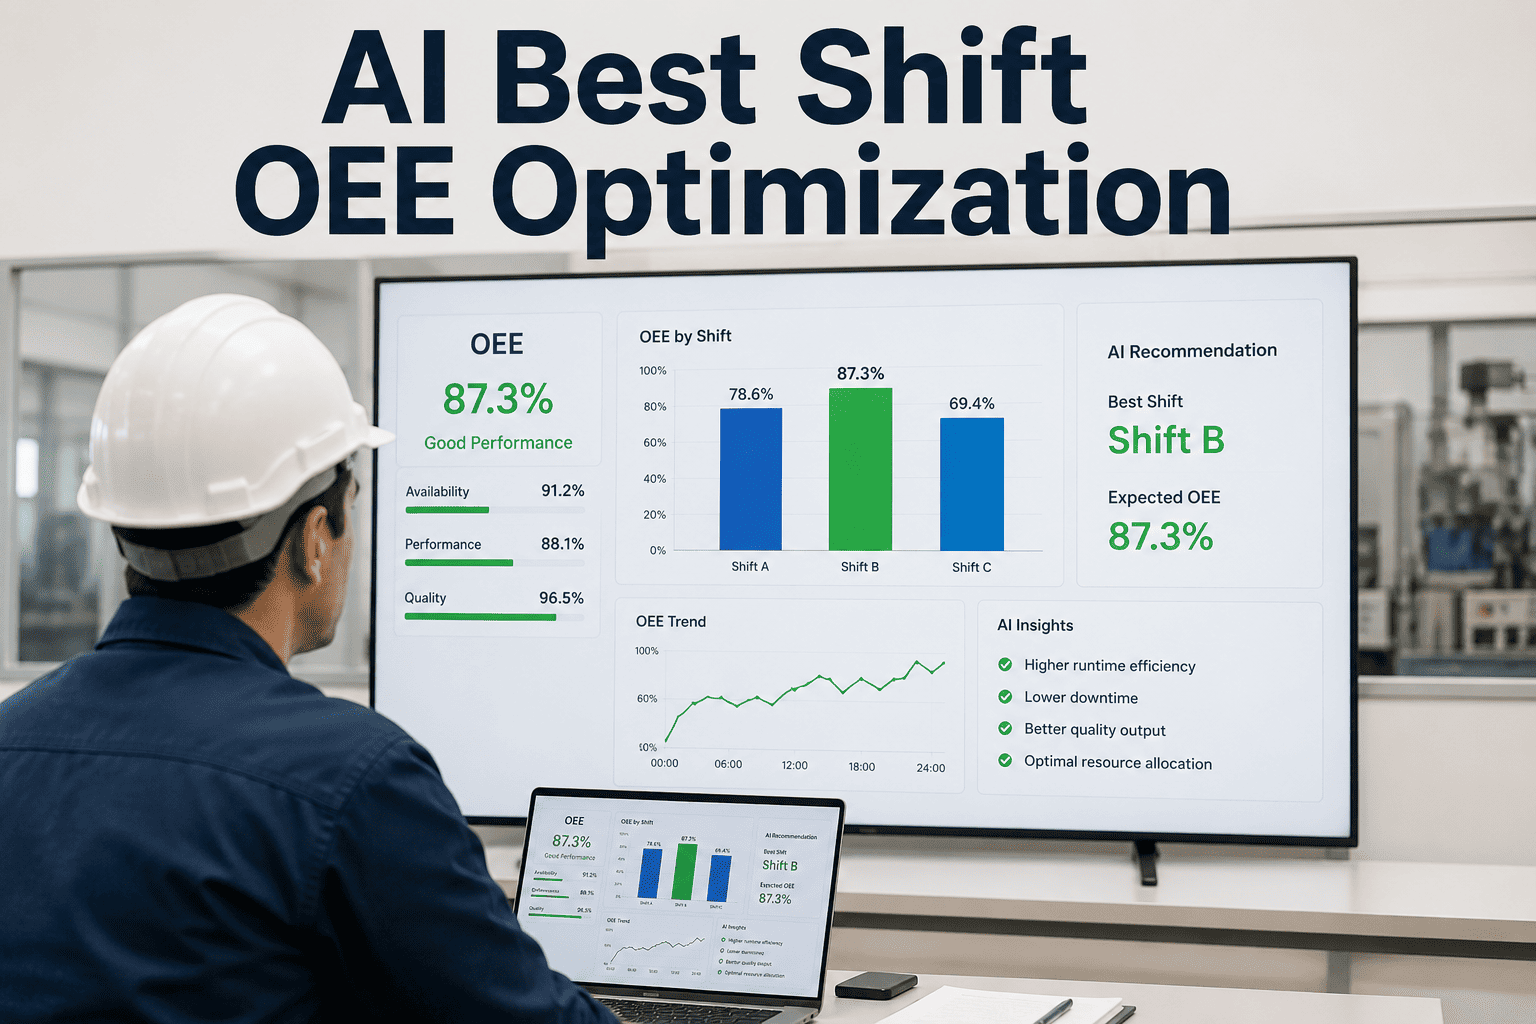
One Loss Code Library, Every Shift and Site
A shift report is only comparable if every shift and plant defines a loss the same way. The most common reporting failure across multi-site groups is each plant calculating OEE and coding downtime differently, so the numbers can't be compared. The platform enforces one loss-code library and one OEE definition, so a microstop on night shift at one plant means the same thing as a microstop on day shift at another — and a group operations director gets a true apples-to-apples view instead of three incompatible spreadsheets.
One definition
same OEE math across every line and shift
One code library
shared loss-tag set, no local dialects
Shift-to-shift
day, evening, night compared fairly
Site rollup
plant KPIs aggregate to a corporate view
Ask the Copilot
The reporting layer answers plain language too — for the shift lead closing out a night or the ops manager comparing crews without exporting anything.
Plant Copilot — Shift OEE
Shift Lead
Close out Line 2 night shift — what's my OEE and what do I flag to days?
Copilot
Line 2 night OEE was 71%, down from your 78% baseline. It's mostly performance: 34 microstops at the filler, clustered after the 02:10 SKU change — about 5 points right there. Availability held; quality was clean at 99%. That's past your 5% variance threshold, so the report needs a one-line note. I've drafted it: "Filler microstops post-changeover, suspected infeed timing." For days, the open action is a filler infeed check at first downtime — owner unassigned, want me to tag the day shift lead?
Shift Lead
Yes. And was night worse than days on this line this week?
Copilot
Tagged to the day lead with the filler action attached. On the same loss-code library: night averaged 73% this week against days at 80%, and the whole gap is microstop frequency — nights run about 3x the day shift's count, all post-changeover. Days aren't doing fewer changeovers; they're recovering from them faster. That's the real difference to close, and it points back to the same filler infeed action.
Turnkey: Hardware, Software, Live in 6-12 Weeks
iFactory ships a pre-configured NVIDIA AI server — racked, software pre-loaded. Rack it, plug in power and Ethernet, and the reporting layer is live inside your firewall. It sits above your existing PLC, SCADA, and MES — reading from them, never replacing them — so there's no rip-and-replace and no production interruption. The engagement covers line integration, loss-code library setup, OEE and handover configuration, operator training, and 24×7 remote monitoring.
Phase 1 · Weeks 1-4
Ship & Connect
Edge server on-prem; PLC, SCADA, and MES connected. Live OEE and microstop tracking on a pilot line.
Phase 2 · Weeks 5-8
Code & Configure
Loss-code library and OEE definition set; shift report and digital handover configured with your thresholds.
Phase 3 · Weeks 9-12
Roll Out & Go Live
SIC reviews, auto-handover, and Pareto live across lines, operator training, 24×7 monitoring at 99.9% uptime.
1000+
clients running iFactory
6-12 wks
to live operation
On-prem
inside your firewall
What the Operations Team Gets
A shift report that fills itself in, a handover that takes two minutes instead of fifteen, microstops finally counted, and one comparable OEE definition across every shift and site — so the report drives the next fix instead of filling a binder.
Auto-filled
No data entry
numbers from machines, notes from people
2-minute
Handover
structured summary, nothing lost verbally
Counted
Microstops
the silent loss finally visible
Comparable
Every shift
one definition, one code library
Frequently Asked Questions
How much of the shift report is automatic?
The numbers are: shift OEE and its three factors, output versus plan, the downtime Pareto, and quality and yield all auto-populate from PLC, SCADA, and MES. People supply only the judgment — a variance note when OEE deviates past your threshold, and the open actions with owners. The outgoing supervisor reviews and confirms in a couple of minutes rather than building it from scratch.
Why do microstops matter so much on a food line?
Individually a microstop is a sub-five-minute jam or gap that feels trivial, so operators rarely log it. Collectively they're usually the single largest recoverable loss on an F&B line, and because they're unlogged in manual reporting, they're invisible. Counting them automatically is often where the first 4 to 7 OEE points come from.
When should a variance explanation be required?
Only on real deviation, so the discipline doesn't become noise. A common rule is to trigger the mandatory note when shift OEE moves more than about 5% from baseline or plan. That keeps operators writing where it matters — explaining the bad night or the unexpected good one — while routine shifts close out without friction.
Does this replace our MES or SCADA?
No. The reporting layer sits above your existing PLC, SCADA, and MES — reading from them and aggregating across them. There's no rip-and-replace, no IT migration, and no production interruption. Your control systems remain the system of record; iFactory makes the shift-level picture visible and actionable on top of them.
Can we compare shifts and plants fairly?
Yes — that's the point of one loss-code library and one OEE definition. The common failure is each shift or plant coding downtime and calculating OEE differently, which makes comparison meaningless. With standardized definitions, day-evening-night and site-to-site comparisons are true apples-to-apples, and plant KPIs roll up to a corporate view.
Auto-Populated. 2-Minute Handover. Action-Driven. On-Prem.
See a Shift Report That Fills Itself In
Bring one line and your current shift report. We'll run live OEE and microstop tracking, auto-populate a digital handover with your variance threshold, tag losses to a shared code library, and show the SIC loop carrying actions forward — then scope the 6-to-12-week turnkey deployment, on-prem, above your existing stack.
4 losses
tagged separately
1000+
clients · 99.9% uptime