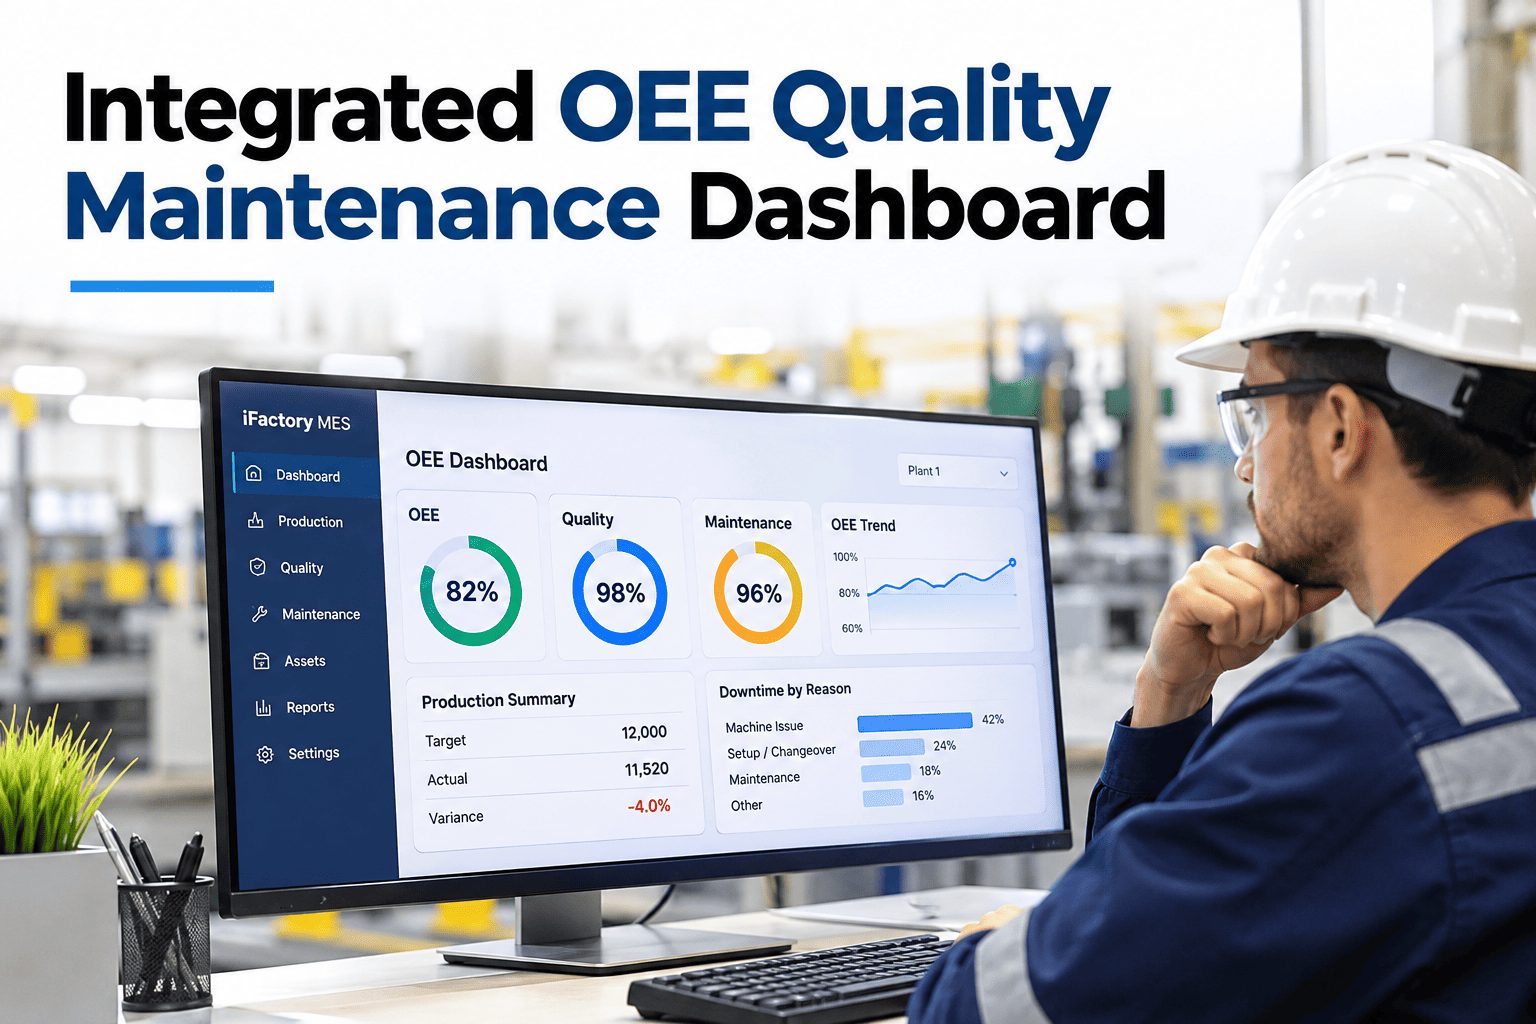
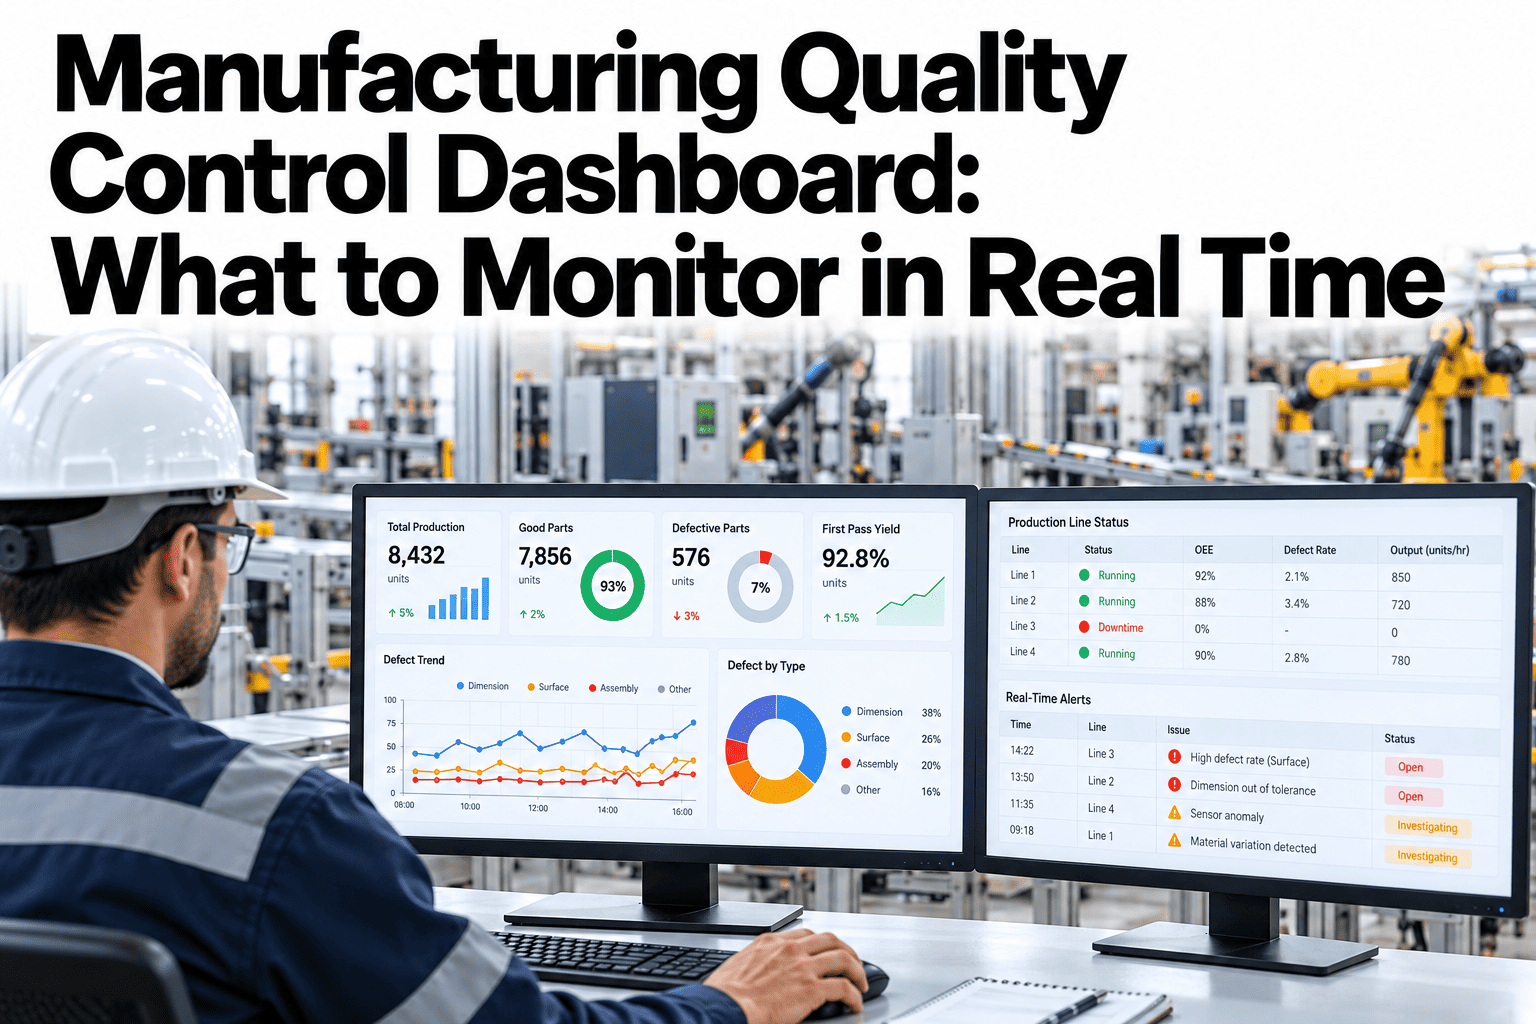
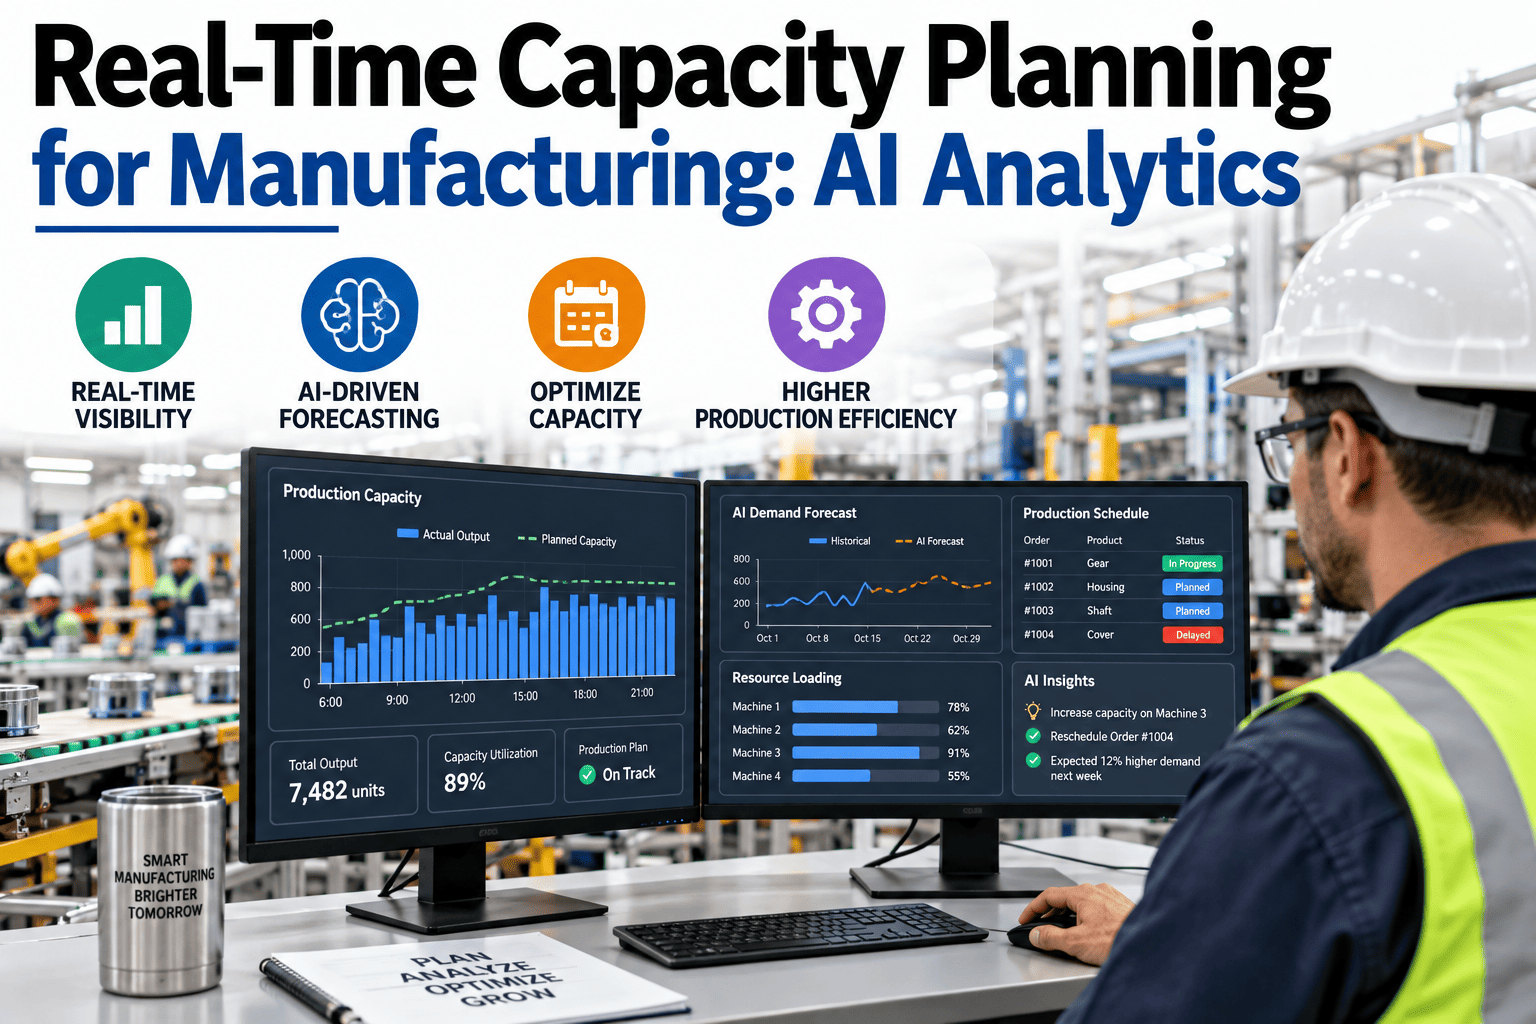
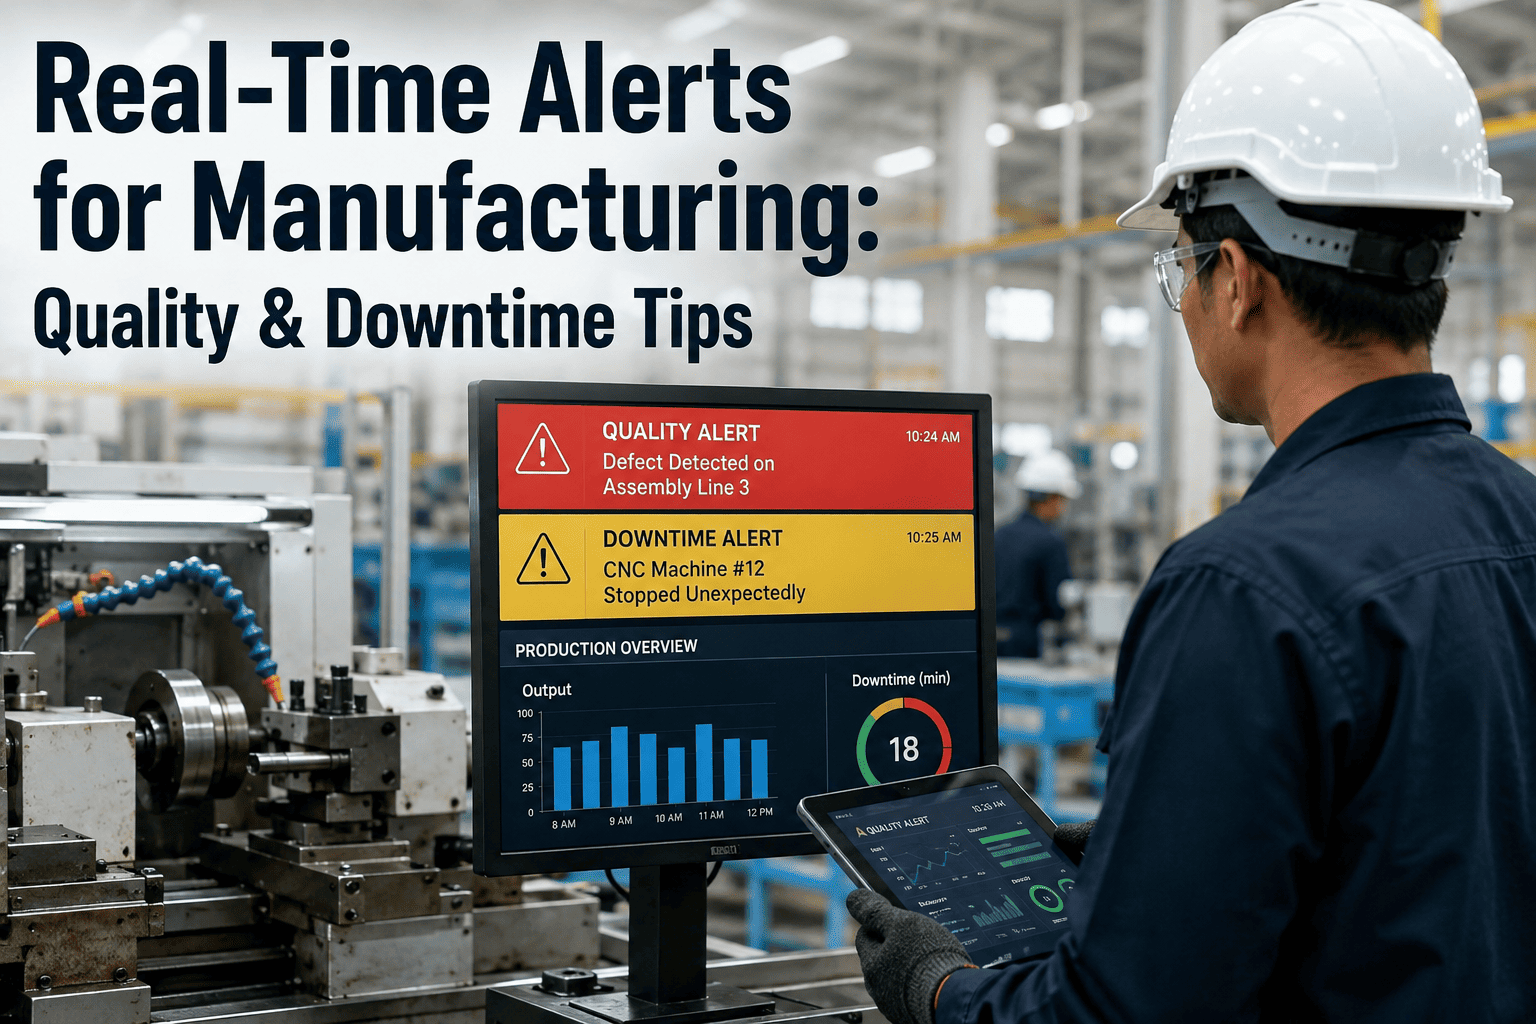
An integrated OEE, quality and maintenance dashboard puts availability, speed, defects, downtime and asset health on one timeline, so teams can see which department-spanning cause is behind a manufacturing loss. Overall equipment effectiveness (OEE) multiplies availability, performance and quality, which means a weak result in any one of them lowers the whole score. The industry median is near 60 percent and world-class is about 85 percent (TeepTrak, 2026), and much of that gap sits where maintenance, quality and production data never meet. iFactory, an on-premise AI platform for smart manufacturing, joins these sources in one view, and teams can see one shift of their own data shown on a single loss timeline in a short session.
Integrated OEE · Quality · Maintenance
OEE Is Three Departments Wearing One Number
iFactory AI joins the data behind each factor, so a loss is traced across teams instead of argued about.
Availability
Owner: maintenance
Breakdowns and setup
×
Performance
Owner: production
Small stops and slow speed
×
Quality
Owner: quality
Scrap and rework
=
OEE
Shared owner
One number, three causes
The definition
What Is an Integrated OEE Quality Maintenance Dashboard?
It is a single view that connects OEE with the maintenance events and quality results that drive it. Instead of three reports from three teams, there is one record of what happened and why.
Separate reports
OEE says availability fell
Maintenance cites a repair
Quality cites a defect spike
Nobody links the three
One integrated view
Loss shown on one timeline
Repair linked to the stop
Defects linked to the wear
Cause agreed by all teams
The benchmark
Where Does Your OEE Sit Against 2026 Benchmarks?
Most plants run well below world-class. The scale shows the three reference points reported for 2026.
Median 60%
Top quartile 75%
World-class 85%
Source: TeepTrak, State of OEE 2026, citing ISO 22400-2.
Moving from 60 to 85 percent raises effective capacity by about 42 percent on the same equipment, as a simple ratio of the two scores.
Before chasing the gap, plants need to see which factor holds the score down. To find that on your lines, ask our team how losses are split across the three factors.
Find Which Factor Is Holding OEE Down
Bring downtime, defect and maintenance records. iFactory AI will show how they line up on one timeline.
One timeline
How Does One Timeline Reveal a Cross-Functional Cause?
Align the four data streams by time and the sequence appears. The illustrative shift below shows a wear alarm, a speed loss, a defect spike and a stop in order.
Read left to right: the alarm came first, the quality and speed effects followed, and the stop ended the sequence.
Seen as separate charts, each event looks like a different problem. To view a sequence on your own shift, review a multi-team loss timeline with our specialists.
The losses
Which Losses Belong to Which OEE Factor?
The six big losses from total productive maintenance (TPM) give a standard map from a loss to its factor.
| Big Loss | OEE Factor | Typical Data Source | Owning Team |
|---|
| Breakdowns | Availability | Downtime log, work orders | Maintenance |
| Setup and adjustments | Availability | Changeover records | Production |
| Small stops | Performance | Machine state signals | Production |
| Reduced speed | Performance | Cycle time versus ideal | Production, maintenance |
| Startup rejects | Quality | Scrap and inspection | Quality, production |
| Production rejects | Quality | Defect and rework records | Quality |
Who sees what
What Should Each Role See on the Dashboard?
Maintenance lead
Downtime causes, asset health and which repairs hit quality.
Production manager
OEE by line and shift, with speed and stop losses.
Quality manager
Yield and defects linked to machine condition.
Plant director
One OEE trend with the top three loss causes.
Everyone reads the same data, framed for their decisions. For a role-based layout, ask support how views are configured per team.
Rollout
How Do You Build an Integrated OEE View?
1
Agree on definitions
Fix what counts as a stop, a reject and planned time.
2
Connect three sources
Machine states, maintenance work orders and quality results.
3
Align by time
Put every event on a shared clock.
4
Pilot on one line
Review losses weekly with all three teams.
5
Scale and track
Extend to other lines and watch OEE and its factors.
iFactory is delivered turnkey on an on-premise NVIDIA server, live in 6–12 weeks, with integration, training and 24×7 remote monitoring in scope.
PitfallsWhat Mistakes Undermine an Integrated OEE View?
The dashboard is only as good as the rules behind it. Six mistakes appear again and again.
Different OEE definitions per line
Fix planned time, ideal cycle time and counting rules once, then apply them everywhere so lines can be compared.
Hiding micro-stops
Record short stops automatically, since manual logs miss most of them and make performance look better than it is.
Counting rework as good output
Count only first-time-good units in the quality factor, or the score hides real waste.
Using OEE to rank people
Use it to find losses, and keep scores out of individual reviews so stops are reported honestly.
Dashboards nobody reviews
Hold a short weekly review with maintenance, quality and production in the same room.
Mixing planned and unplanned stops
Track planned downtime separately so it does not blur the loss picture.
A clean definition sheet solves most of this. To build one for your lines, ask support for an OEE definition checklist.
Key termsWhich Terms Does the Dashboard Rely On?
Eight terms appear on almost every integrated OEE screen.
OEE
Availability times performance times quality.
Availability
Share of planned time the machine actually runs.
Performance
Actual speed compared with ideal speed.
Quality
Share of output that is good the first time.
MTBF
Mean time between failures, a measure of reliability.
MTTR
Mean time to repair, a measure of repair speed.
Micro-stop
A very short stop that often goes unrecorded.
TEEP
Total effective equipment performance, measured against all calendar time.
To see them on a live screen, preview these measures with our specialists.
Expert review
Reading an Integrated OEE View Responsibly
Holds up
OEE as availability times performance times quality is the accepted standard, and linking it to causes is the point of the metric.
Verify
That planned time and ideal cycle time are defined the same way on every line before comparing OEE.
Avoid
Using OEE to rank people. It is a loss-finding tool, and punishing it invites hidden stops.
Questions
Frequently Asked Questions
Why combine OEE with quality and maintenance data?
Because the three OEE factors have causes that sit in different departments. A combined view shows how a maintenance event affects speed and defects, which separate reports hide.
See the combined view on your data.
What is a good OEE target?
World-class is about 85 percent, the top quartile about 75 percent and the median near 60 percent in 2026, though targets vary by process. Set a target per line from your own baseline.
Ask how to set a realistic target.
Which systems feed the dashboard?
Typically PLCs and sensors for machine states, a maintenance system for work orders and a quality system for inspection results. iFactory connects to these through standard protocols.
Review integration options for your stack.
How long does a first version take?
A pilot on one line can run early in the rollout window, since the first view needs only the three core sources. Accuracy improves as definitions settle.
Plan a pilot timeline with our team.
Does the data leave the plant?
No. iFactory runs on-premise on a plant server, so production, maintenance and quality data stay on site.
Ask support about data handling for your network.
Give Every Team the Same Loss Picture
Book a session to see iFactory AI join OEE, quality and maintenance data into one dashboard.