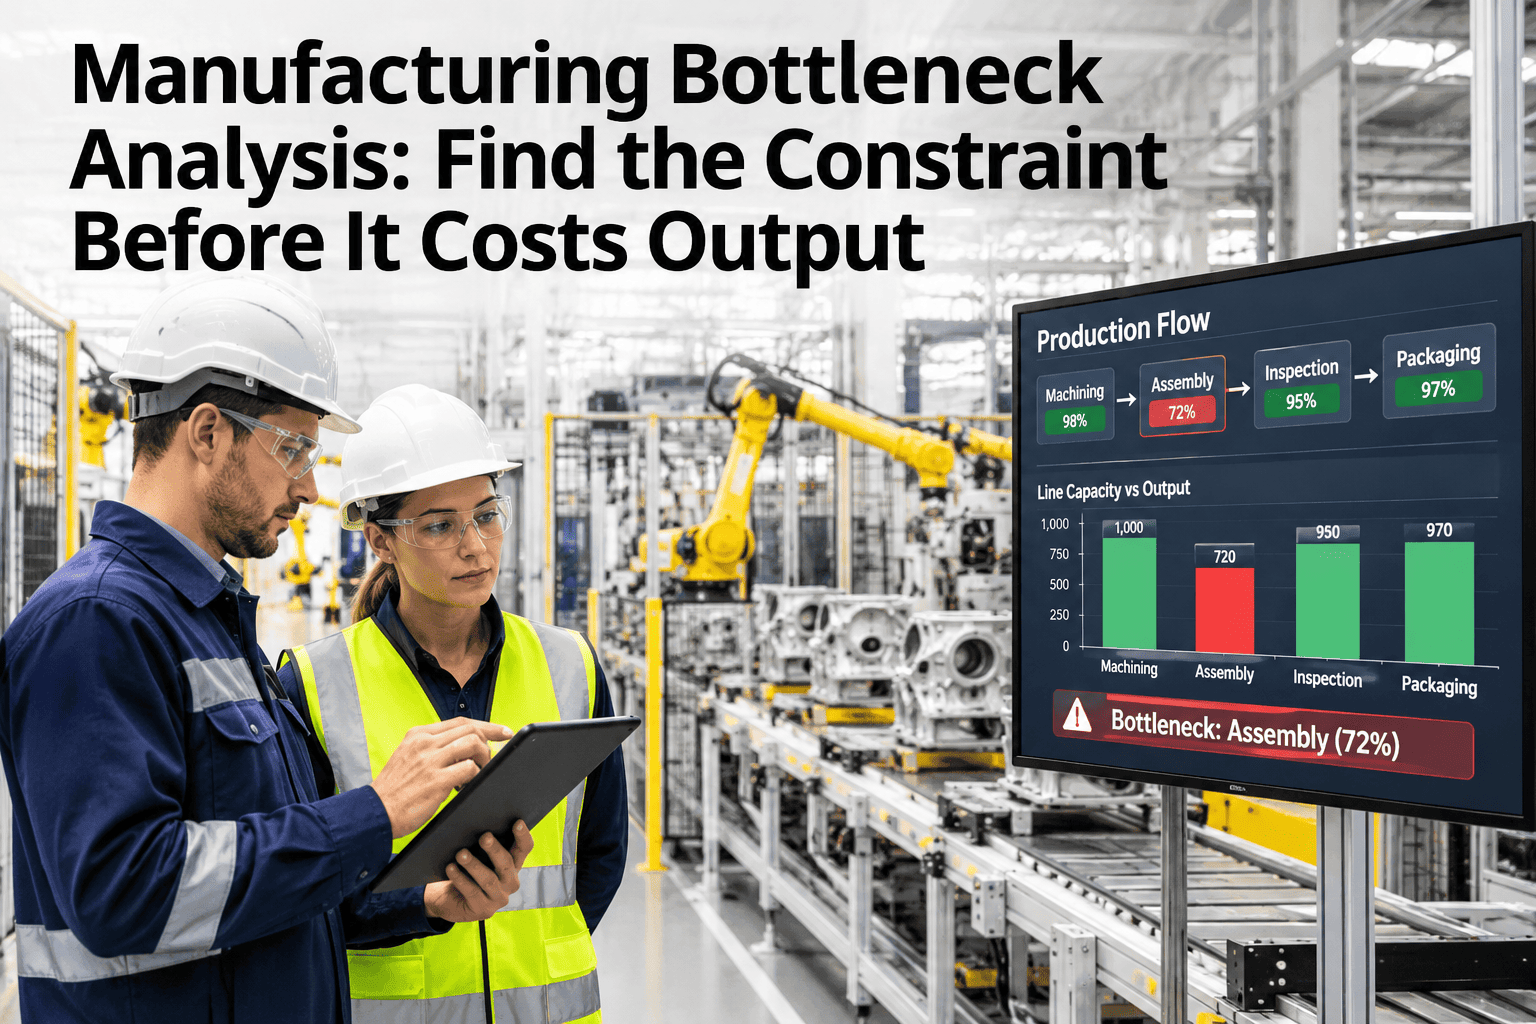
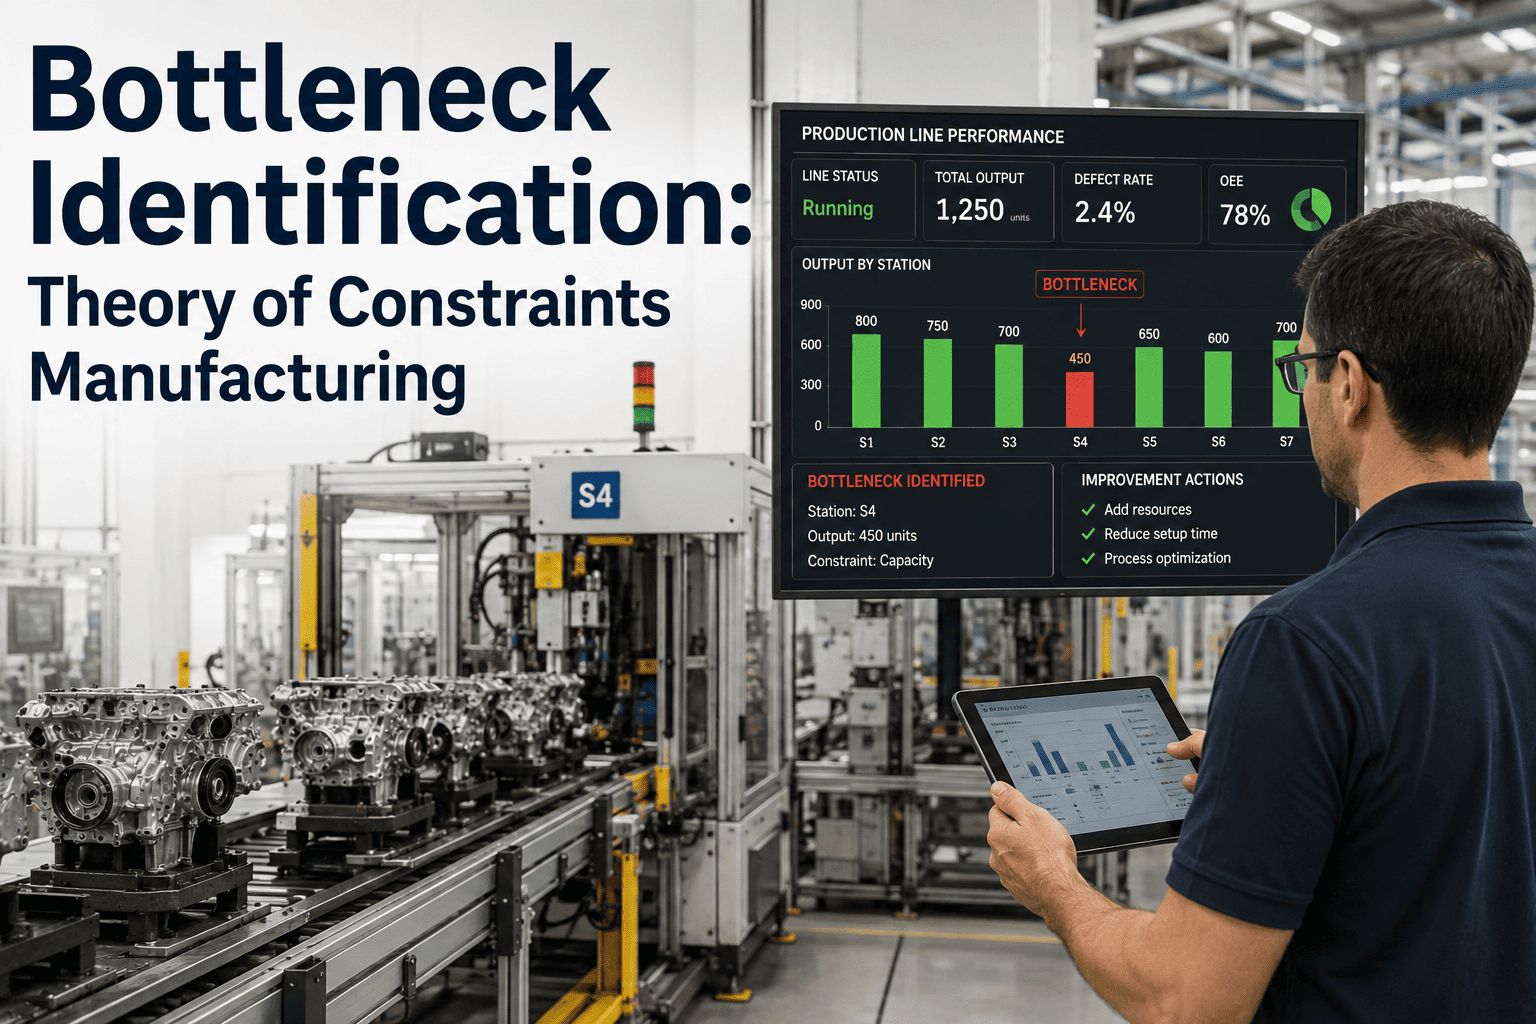
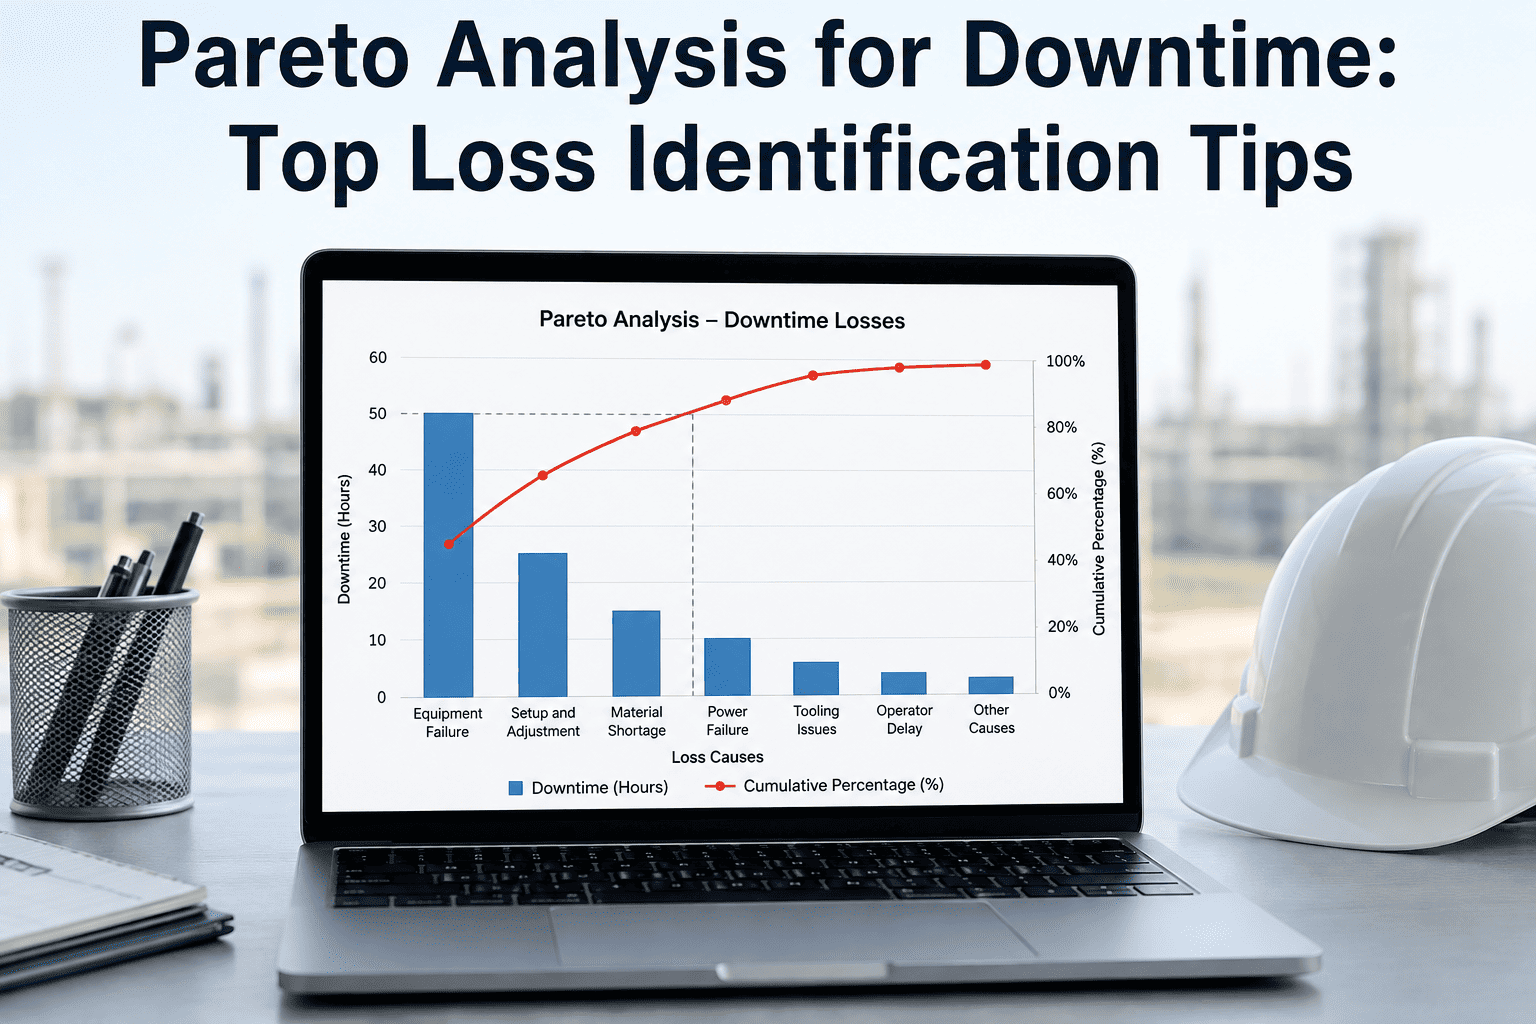
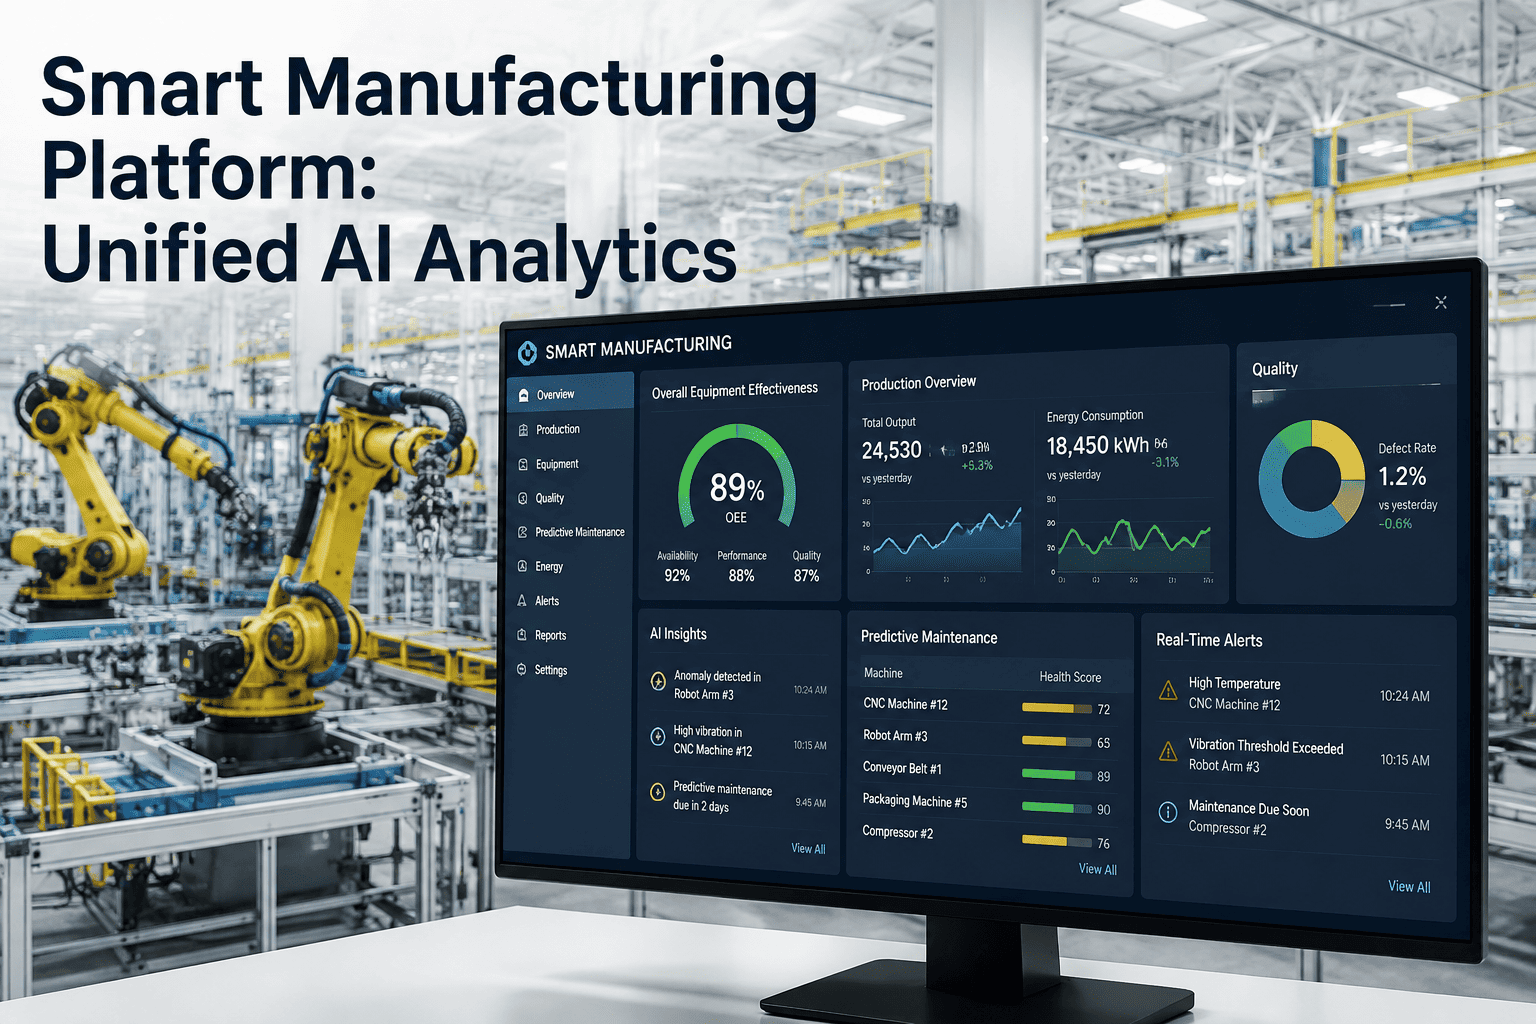
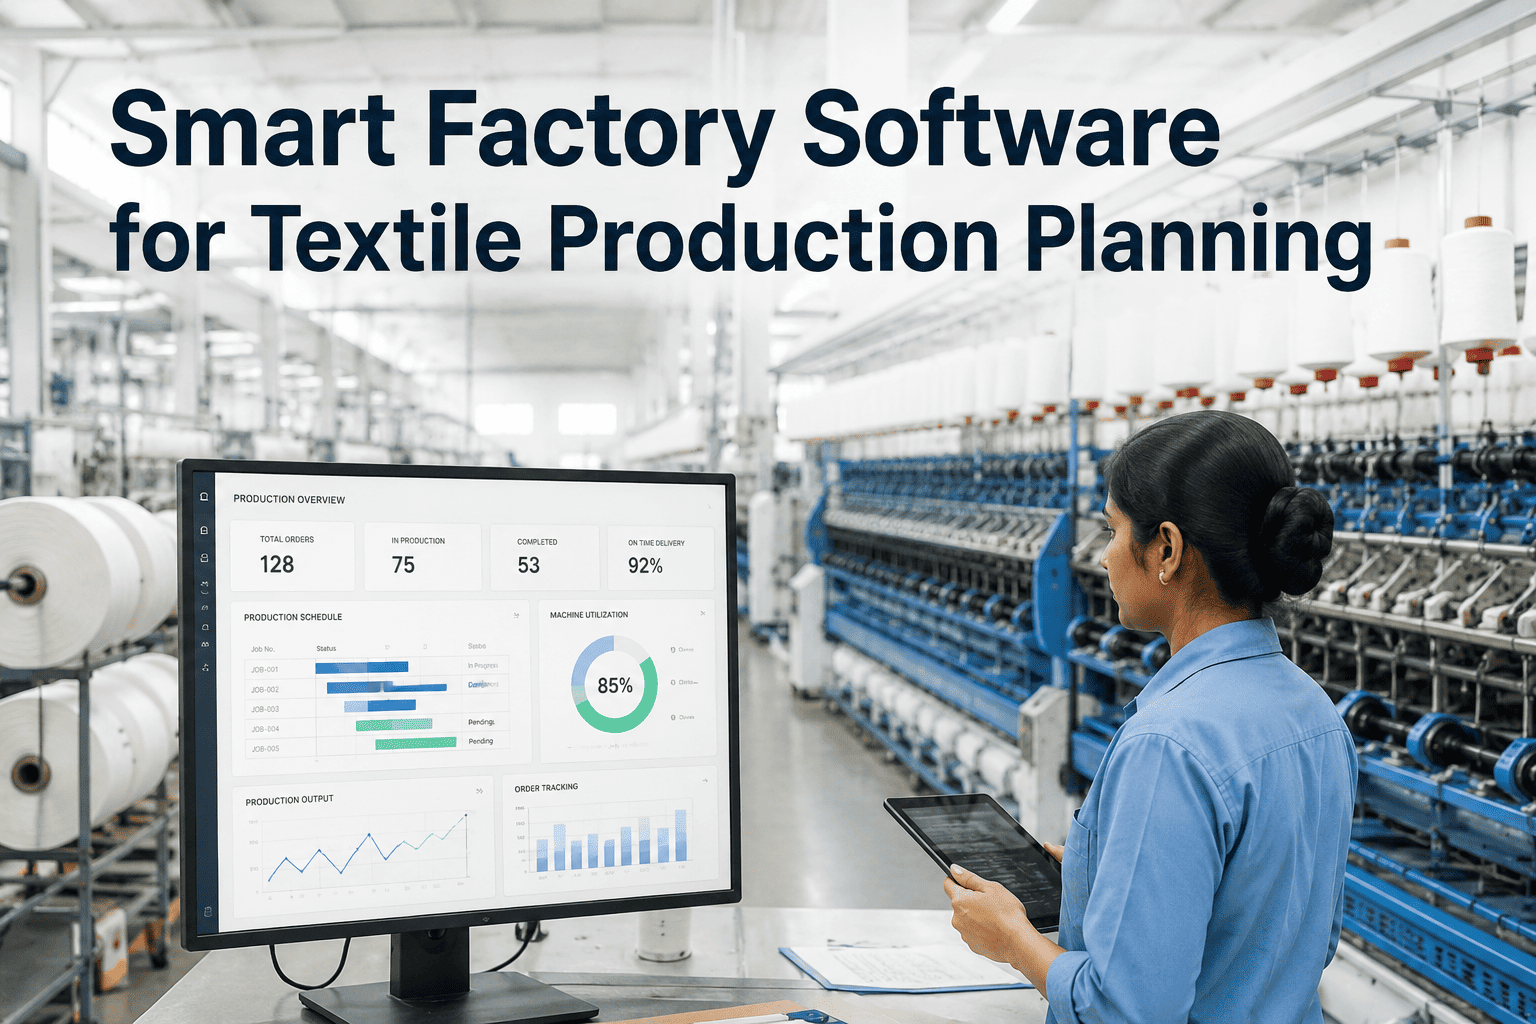
Most plants have a favorite suspect for their constraint — the machine that is the most expensive, the one that jams most often, or the one operators complain about loudest. Capital and attention then follow the loudest opinion, and output often does not improve because the real limit was somewhere else entirely. A proper bottleneck analysis combines OEE, downtime, cycle-time, work-in-process and quality data into one view, so the constraint is found with evidence instead of guessed from the floor. You can run a constraint analysis against your own line data with our team.
Theory of Constraints, 2026
Stop Guessing the Constraint. Calculate It.
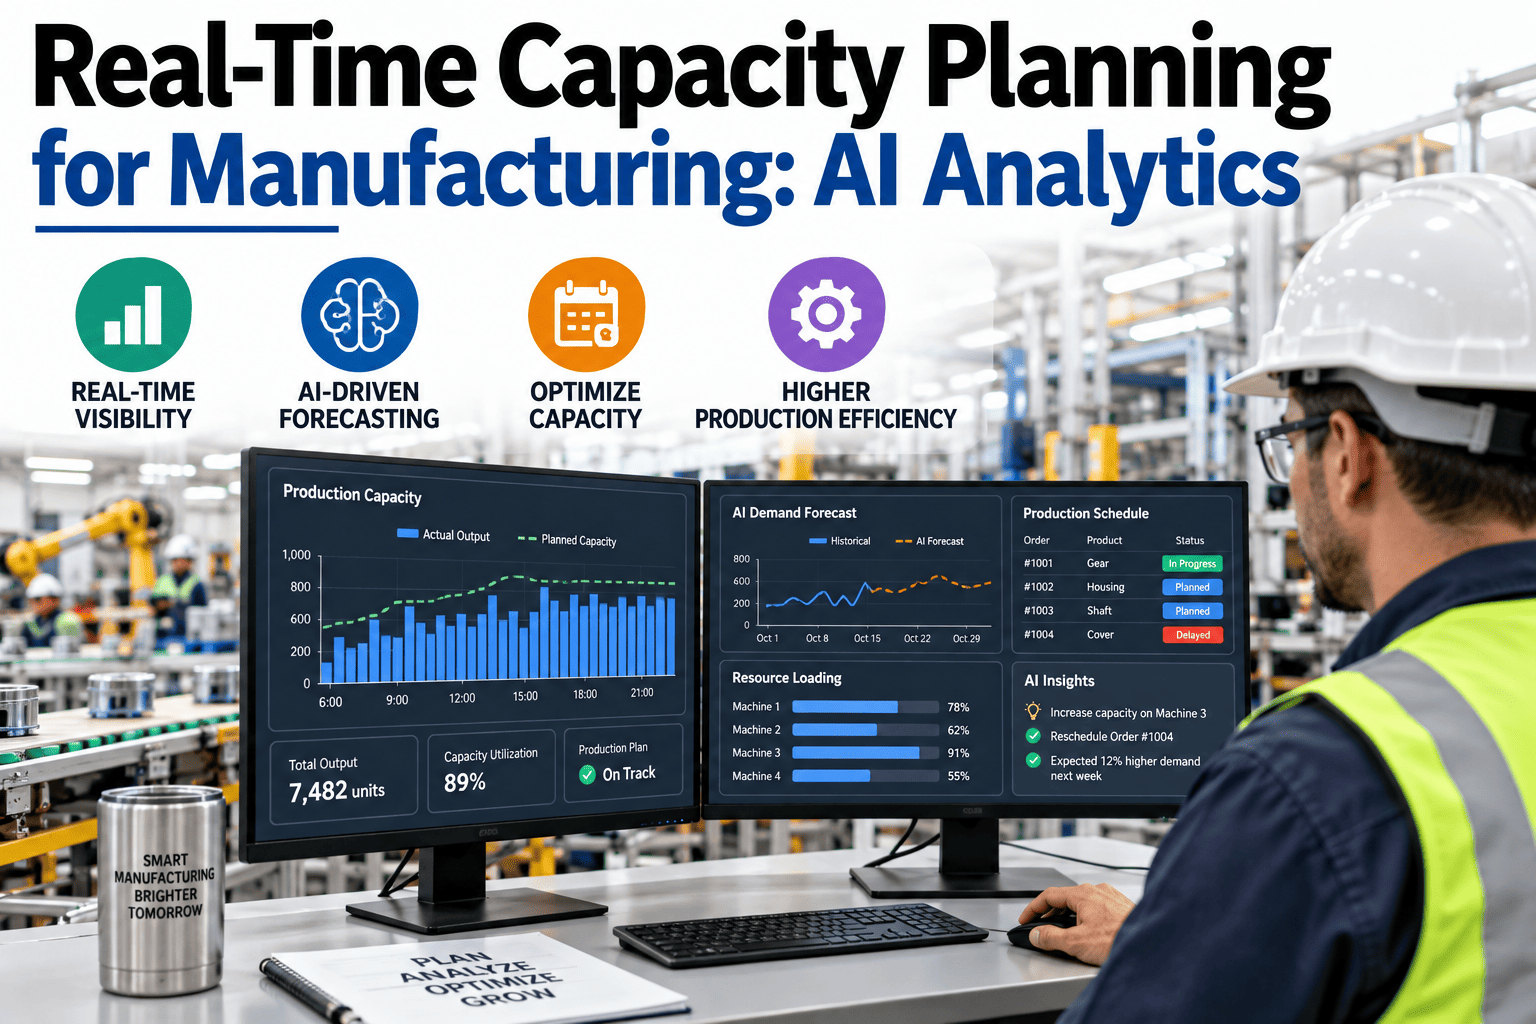
iFactory, an on-premise AI platform for production monitoring and analytics, combines OEE, downtime, cycle-time, WIP and quality data into one constraint analysis, so capital goes to the station actually limiting output.
What it is
What Does a Proper Bottleneck Analysis Actually Involve?
Bottleneck analysis is the disciplined process of identifying which resource genuinely limits a system's total output — the Theory of Constraints principle that a production system can never run faster than its slowest link, correctly measured.
The discipline matters because the intuitive answer is often wrong. A machine that is the most expensive, the most complained-about, or the slowest on paper is not necessarily the one actually setting the pace of the whole line once blocking, starving and quality loss are accounted for.
The five inputs
What Belongs in a Complete Constraint Analysis
OEE by station
Effective output per station, not just rated speed.
Downtime logs
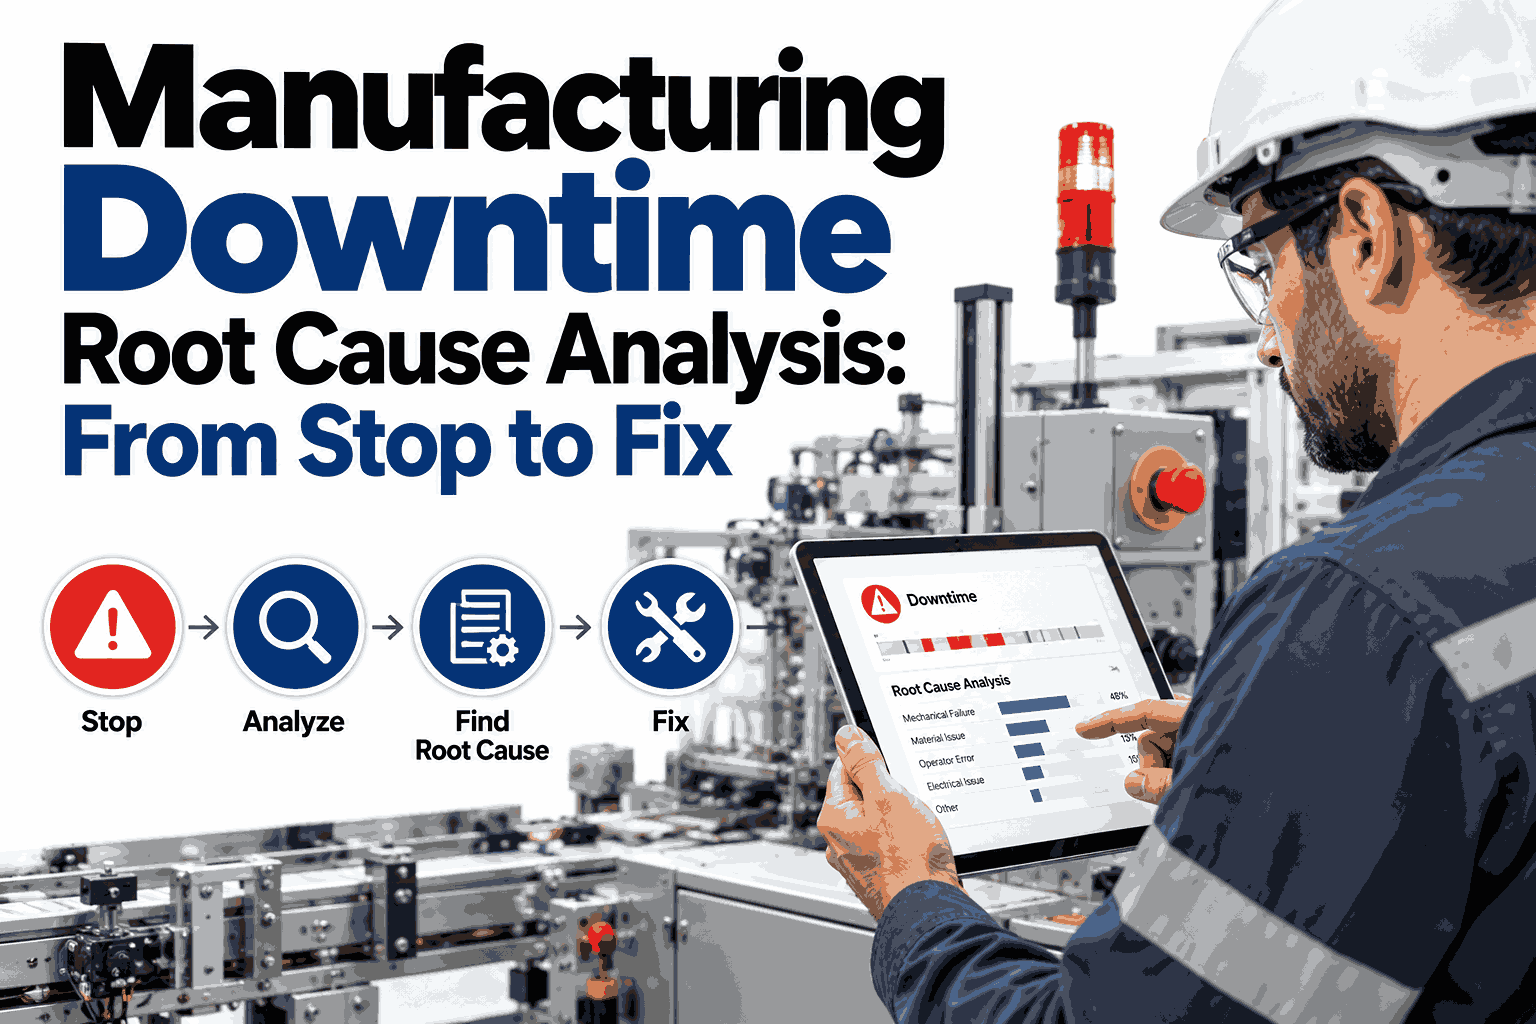
Reason-coded stops that show which station fails most often.
Cycle time
Actual pace against standard, station by station.
WIP levels
Where inventory piles up, revealing blocking and starving.
Quality loss
Rework and scrap that silently reduce a station's effective rate.
Five steps
Goldratt's Five Focusing Steps, Applied to a Plant
1
Identify the constraint — the station that genuinely limits total system throughput, using the five data inputs together.
2
Exploit it — get the most out of the constraint with the resources already available, before spending any capital.
3
Subordinate everything else to it — run every other station at a pace that supports the constraint, not its own maximum speed.
4
Elevate the constraint if needed — only now consider capital investment, once the free improvements are exhausted.
5
Repeat — once the constraint moves, as it will, start the cycle again from step one.
Comparison
The Loudest Opinion vs a Data-Driven Constraint Finding
| Dimension | Loudest Opinion | Data-Driven Analysis |
|---|
| Basis | Which machine is complained about most | Combined OEE, downtime, cycle-time, WIP, quality |
| Capital decision | Follows whoever argues loudest | Follows the evidence of where output is actually lost |
| Risk of being wrong | High — intuition often misses blocking and starving | Lower — the full system is accounted for |
| Outcome if wrong | Capital spent, output unchanged | Capital targeted at the actual limit |
Expert review
What an Operations Director Would Check First
Holds up
Goldratt's Theory of Constraints has over four decades of documented application in manufacturing; the five focusing steps remain sound regardless of which software captures the data.
Watch for
An analysis that jumps straight to step four — buying equipment — without first exploiting and subordinating, which often delivers most of the available gain for free.
Do next
Run the analysis on the line with the largest unexplained output gap first, since that is where the loudest-opinion approach has likely been wrong the longest.
FAQ
What Operations Teams Ask About Bottleneck Analysis
What is the Theory of Constraints in simple terms?
It is the principle that a production system's total output is set by its single most limiting resource, so improving any other station delivers little or no system-wide benefit — only fixing the actual constraint moves total throughput.
See this applied to your line with our team.
Why isn't the slowest machine always the constraint?
A slow machine that runs steadily can process more over a shift than a fast machine with frequent stops, because the fast machine's downtime creates more lost time than its speed saves. Blocking and starving between stations also shift the real limit elsewhere.
What happened in a documented case of finding the real constraint?
One documented case involved a precision parts manufacturer whose delivery delays were traced not to its machining centers, as the team assumed, but to a single manual quality inspection station — protecting that station with a buffer lifted throughput 25% in three months (industry case analysis, 2026).
Ask how a similar analysis would run on your line.
What data is the minimum needed to run a credible analysis?
OEE and downtime by station are the minimum starting point; adding cycle-time, WIP and quality data sharpens the finding significantly, since the constraint often hides in the interaction between these factors rather than in any single one.
Discuss what data you already have with our team.
How often should a constraint analysis be repeated?
Any time a significant change occurs — a new product mix, equipment change, or after acting on a previous finding — since fixing one constraint reliably reveals the next one, and the analysis needs to run again to find it.
Set an analysis cadence for your plant.