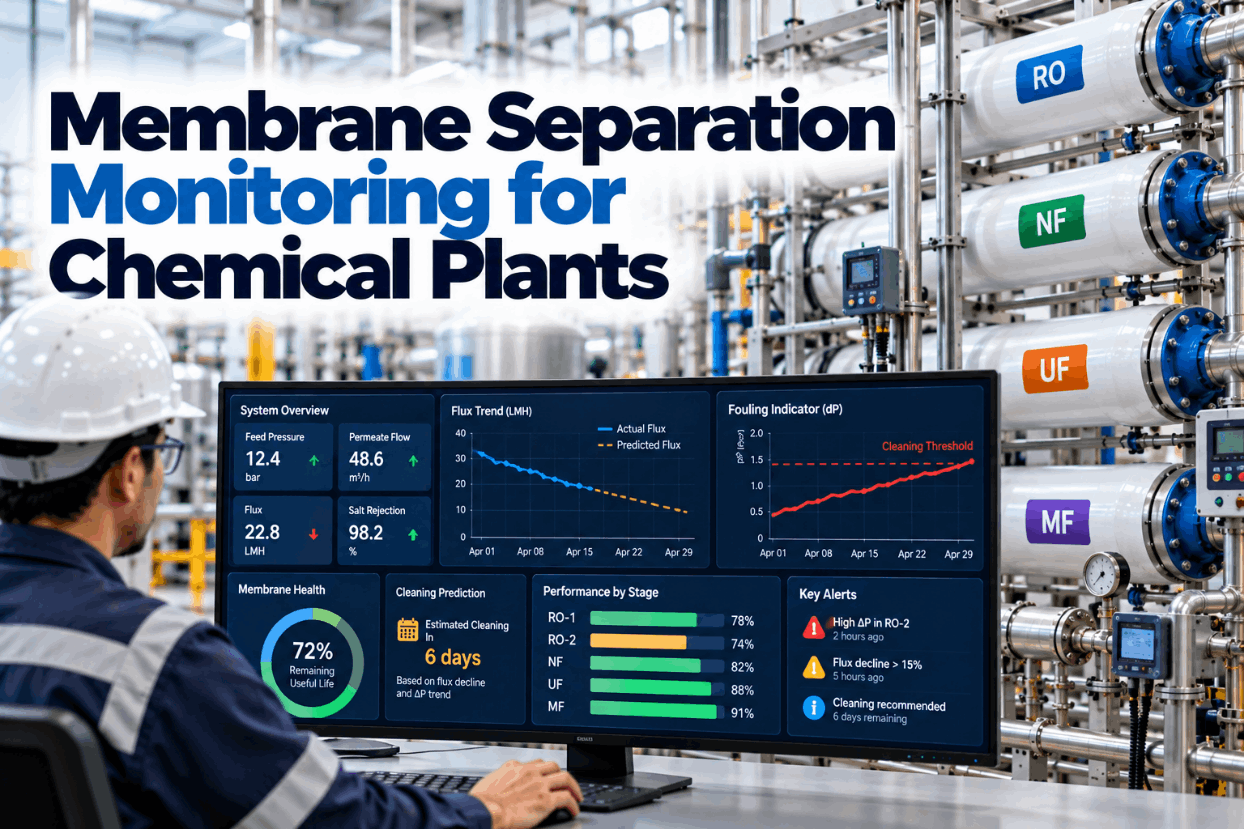
Membranes do a growing share of separation work in chemical plants: reverse osmosis and nanofiltration for process water and product concentration, ultrafiltration and microfiltration for solids and colloids, gas separation membranes for hydrogen and carbon dioxide, and organic solvent nanofiltration for solvent recovery. All of them lose performance the same way. Foulants build up, flux falls, differential pressure rises and the plant cleans either too late, after damage, or too early, wasting chemicals and membrane life. Monitoring that normalizes performance for temperature, pressure and recovery shows the real trend and predicts when cleaning is needed. This guide covers membrane types, fouling mechanisms, normalization, cleaning triggers and how to plan cleaning on condition. To see your membrane data normalized, book a short walkthrough.
Membrane Separation Monitoring for Chemical Plants: Predict Fouling and Clean on Condition
Normalized flow, salt passage and differential pressure tracked for every RO, NF, UF and MF train, so cleaning happens when the membrane needs it and before fouling becomes permanent.
Why Membrane Trains Lose Performance Unnoticed
A membrane system rarely fails suddenly. Performance declines a little each day as foulants accumulate. Operators see raw permeate flow and pressure, but those readings move with feed temperature, feed concentration and recovery, so the real decline is hidden in the noise. By the time the trend is obvious, foulants may have compacted into layers that cleaning no longer fully removes.
Cleaning too late shortens membrane life and lowers capacity. Cleaning too early wastes chemicals, downtime and labor, and each clean itself stresses the membrane. The right answer is to clean on condition, using normalized data that removes the effect of operating changes.
The energy case for membranes is strong, which is why their use keeps growing. Sholl and Lively, writing in Nature in 2016, estimated that thermally driven separations such as distillation account for 10–15% of the world’s energy use. A US Department of Energy report put separation processes at about 22% of in-plant energy use in US industry. Keeping membranes healthy protects that advantage.
Normalized monitoring turns a noisy trend into a clear signal. We can review your membrane data on a call.
Membrane Types Used in Chemical Processes
Each membrane type separates by a different mechanism and faces different fouling risks.
| Type | Separates | Typical chemical plant use | Main fouling risk |
|---|---|---|---|
| Microfiltration (MF) | Particles roughly 0.1–10 µm | Catalyst fines, suspended solids, pretreatment | Particulate and biological |
| Ultrafiltration (UF) | Roughly 0.001–0.1 µm, macromolecules and colloids | Polymer recovery, oily water, RO pretreatment | Colloidal and organic |
| Nanofiltration (NF) | Around 1 nm, divalent ions and small organics | Salt and product separation, softening | Scale and organic |
| Reverse osmosis (RO) | Dissolved salts and small molecules | Process water, condensate polishing, concentration | Scale, biofouling, colloids |
| Organic solvent nanofiltration | Solutes of about 50–2000 g/mol in solvents | Solvent recovery and catalyst recycle | Organic and swelling effects |
| Gas separation | Gases by permeation rate | Hydrogen recovery, carbon dioxide removal | Condensation and contaminants |
Pore size ranges vary between suppliers and overlap at the edges, so these figures are typical rather than exact. What matters for monitoring is that each type has its own signature of decline and its own cleaning chemistry.
Organic solvent nanofiltration shows how large the energy benefit can be. A sustainability assessment published in Green Chemistry compared methanol recovery by distillation and by nanofiltration and found 1,123 GJ for distillation against 2.8 GJ for the membrane route in its case.
Each membrane type needs its own baseline and triggers. Our engineers set them up per train.
Fouling Mechanisms and Their Signatures
DuPont’s FilmTec guidance groups the common foulants into four families. Each leaves a different pattern in the data.
Calcium carbonate, sulfates and silica deposit where concentration is highest, usually the last stage. Flux falls in the tail elements first.
Biofilm grows on spacers and surfaces, raising differential pressure across the lead elements, often faster in warm feed.
Fine particles collect on the lead elements, lowering flux there and raising feed-side pressure.
Adsorbed organics reduce flux across many elements and can be hard to remove fully.
Oxidants or pH outside limits damage the membrane, raising salt passage rather than lowering flux.
Leaking interconnectors raise salt passage in one vessel, visible in per-vessel conductivity.
The pattern tells the cleaning team what to use. DuPont guidance recommends an acid clean at low pH for calcium carbonate scale and a high-pH clean for biofouling, with organic and colloidal fouling usually needing an alkaline clean first. Using the wrong sequence can make some foulants harder to remove.
Stage-by-stage data makes the diagnosis much easier. A rise in differential pressure on the first stage with steady last-stage flux points to biological or colloidal fouling; a loss of flux in the last stage with steady first-stage pressure points to scale.
Matching the clean to the foulant saves chemicals and membrane life. See the diagnosis in a demo.
Why Normalized Data Is Essential
Raw permeate flow changes with temperature, feed pressure and feed concentration. A cold morning can look like fouling; a warm afternoon can hide it. Normalization removes these effects so only real changes in the membrane remain.
Recovery after cleaning is the long-term health measure. If each clean returns the train to a slightly lower baseline, irreversible fouling or damage is accumulating, and the plant can plan membrane replacement instead of being surprised by it.
Normalization is calculated automatically from existing instruments. We set it up during every rollout.
When to Clean: Triggers and Prediction
DuPont FilmTec guidance recommends cleaning reverse osmosis and nanofiltration elements when any of three conditions is reached, measured against the normalized baseline.
Illustrative. Prediction turns a trigger into a scheduled task that fits production and chemical availability.
Predicting the date matters as much as the trigger itself. A cleaning planned four days ahead can be fitted into a low-demand period, with chemicals and people ready. A cleaning forced by a sudden alarm often happens at the worst time.
Cleaning chemistry has limits too. DuPont gives a cleaning pH range of 1–13 at 25–35 °C, narrowing to 1–12 at 45 °C. Staying inside those limits protects the membrane while still removing foulants.
Prediction works best with a few months of history per train. Ask our team what data is needed.
Planning Cleaning on Condition
Condition-based cleaning follows a simple cycle that keeps every train within its limits.
Flow, salt passage and differential pressure corrected every hour.
Values compared with the post-cleaning baseline.
Trend extrapolated to the next trigger date.
Stage and vessel data used to identify the likely foulant.
Chemistry, sequence and timing chosen for that foulant.
New baseline recorded and compared with the original.
Pretreatment often explains fouling. Rising silt density index on RO feed, failing cartridge filters or changes in upstream chemistry show up in membrane trends days later. Linking pretreatment data to membrane health lets operators fix the cause instead of cleaning more often.
Linking pretreatment and membrane data is where many plants find their quickest gains. Discuss it with our specialists.
Calendar Cleaning Versus Condition-Based Cleaning
Many plants still clean membranes on a fixed calendar. The comparison shows why condition-based cleaning is better.
- Same interval regardless of fouling
- Clean trains cleaned anyway
- Fouled trains wait for their date
- Raw data hides real decline
- One chemistry for all foulants
- Membrane life hard to predict
- Cleaning when normalized triggers approach
- Healthy trains left running
- Fouling caught before it compacts
- Normalized data shows the true trend
- Chemistry matched to the foulant
- Replacement planned from recovery trends
Condition-based cleaning usually means fewer cleans on some trains and earlier cleans on others. The total number may not change much, but each clean is better timed and better targeted, which is what protects membrane life.
Plants often find one or two trains drive most of the cleaning work. See how they are found in a session.
Membrane Monitoring Checklist
Use this checklist to set up condition-based membrane management.
Most plants already have the instruments. Turning them into normalized trends is the first step of a membrane review.
What Condition-Based Membrane Management Is Worth
The value of better membrane monitoring comes from several directions.
Membrane life is often quoted as several years; one life-cycle assessment cites an average of five to eight years for RO elements. Extending life by even part of a year across a large installation, or avoiding an early replacement caused by irreversible fouling, is a significant saving.
A review of a few months of train data usually shows which trains are costing most. Book one with our advisors.
How iFactory Delivers Membrane Health Monitoring
Flow, salt passage and differential pressure corrected hourly.
Days to the next cleaning trigger for each train.
Stage and vessel patterns matched to likely causes.
Chemistry and sequence suggested per foulant.
Baselines after each clean show long-term health.
Upstream changes connected to membrane trends.
It runs on premises and reads your existing instruments through the DCS or historian. Share a few months of train data and we will show your normalized trends in a working session.
See Your Membrane Trains on a Normalized Basis
Share flow, pressure, conductivity and temperature data for your trains. We normalize it, show the real decline and predict the next cleaning date for each one.
Normalized permeate flow is down 11% from the post-cleaning baseline while temperature and feed pressure are steady. Differential pressure is rising on the lead elements.
A Cleaning Planned Instead of Forced
This exchange shows how a membrane engineer might use iFactory.
iFactory ships as a pre-configured NVIDIA AI server, racked and ready with the membrane health and fouling prediction models loaded. Rack it, plug in power and Ethernet, and the AI is live on your network. Our scope covers data connections across membrane trains, pretreatment and utilities, DCS, PLC/SCADA, historian, LIMS and CMMS integration, cabling and network setup, operator and engineer training, and 24×7 remote monitoring. Recommendations run in advisory mode first, and nothing writes to your control system without your management of change approval.
Server installed, DCS and historian links live, historical process, lab and maintenance data loaded.
Models calibrated on your own unit data, then run in advisory mode on one unit with your process engineers reviewing every recommendation.
Rollout to the agreed units under your management of change, operator and engineer training, and 24×7 remote monitoring in place.
Software, server and integration come as one package. For pricing on your site, contact our sales team.
Frequently Asked Questions
DuPont FilmTec guidance recommends cleaning when normalized permeate flow falls 10%, normalized salt passage rises 5–10% or normalized differential pressure rises 10–15% from the baseline.
Mineral scale, biological growth, colloidal particles and organic compounds are the main families. Chemical damage and leaking seals cause similar symptoms in salt passage.
Because raw flow and pressure change with temperature, feed pressure and concentration. Normalization removes those effects so only real membrane decline remains.
Microfiltration, ultrafiltration, nanofiltration and reverse osmosis for liquids, organic solvent nanofiltration for solvent recovery and gas separation membranes for hydrogen and carbon dioxide.
They separate without boiling. In one Green Chemistry assessment, methanol recovery took 1,123 GJ by distillation against 2.8 GJ by organic solvent nanofiltration.
Membrane trains can typically be monitored within a 6–12 week rollout, using existing instruments. Plan it with our engineers.
Clean Membranes When They Need It, Not on a Calendar
iFactory normalizes every train, predicts cleaning dates, matches chemistry to the foulant and tracks recovery, protecting flux, chemicals and membrane life together.
Illustrative. A common supplier trigger is a 10% fall in normalized permeate flow, so trains near 90% are queued for cleaning.