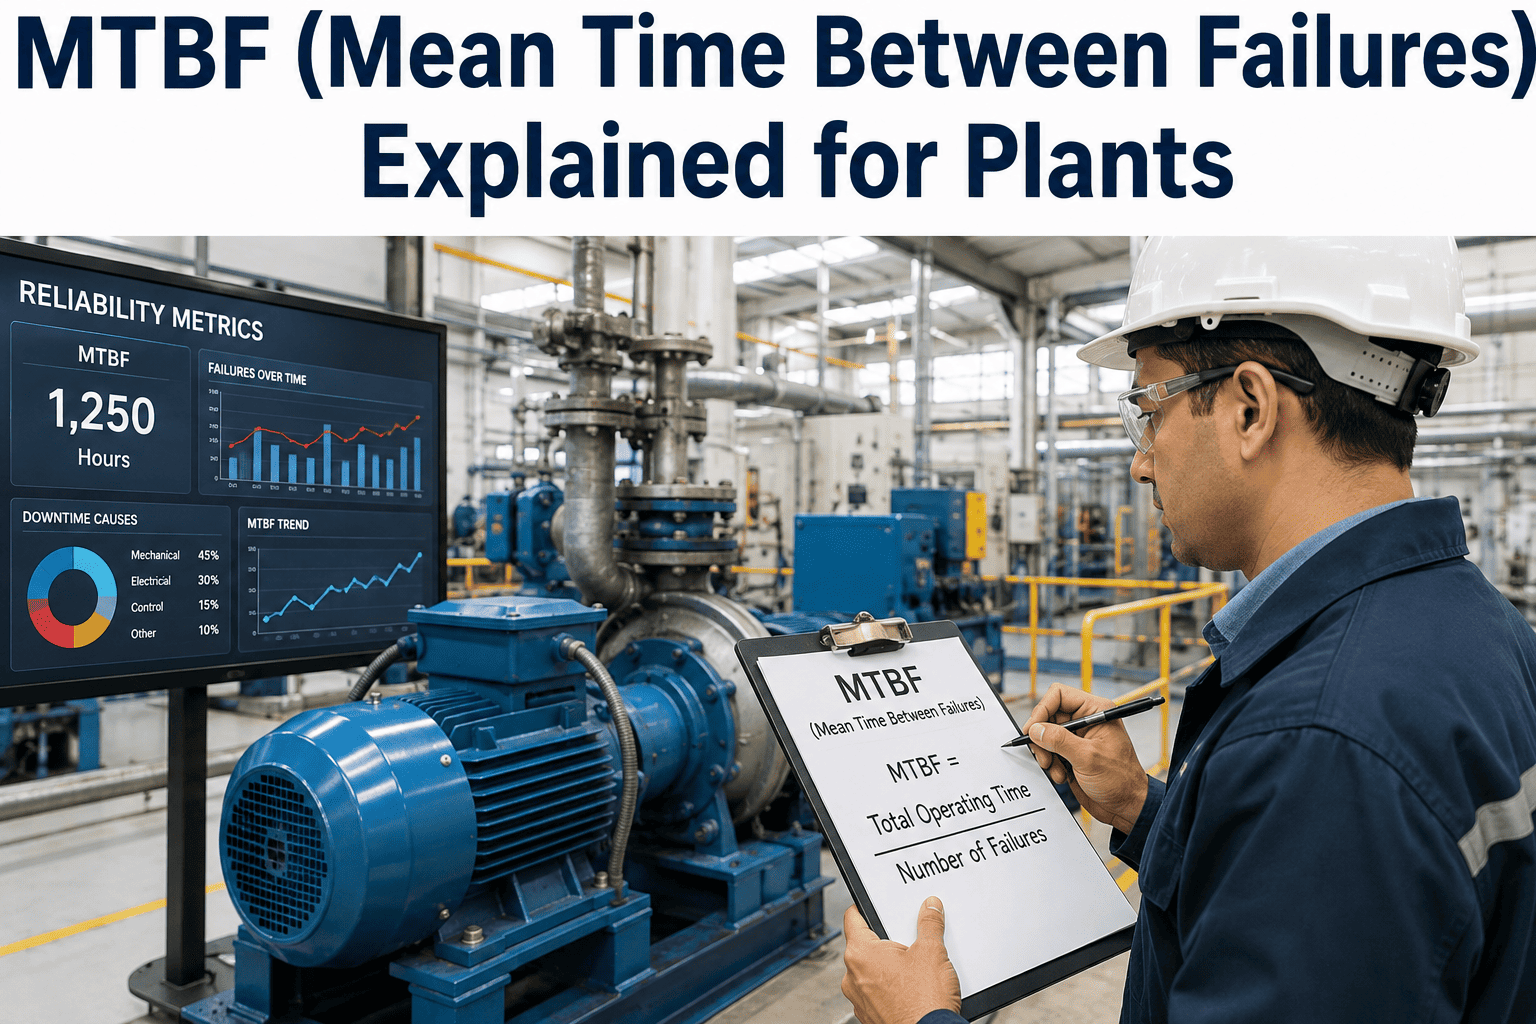
A number that gets quoted often and understood correctly far less often is MTBF, and the gap between the two usually shows up the first time someone tries to use it to predict when a specific machine will actually fail. MTBF is an average across a population of failures, not a countdown timer on any individual asset, and treating it like a prediction for one specific pump or motor is where most of the confusion — and some genuinely bad maintenance decisions — actually start. A demo can show how MTBF is tracked correctly alongside real failure mode data.
Manufacturing Glossary
MTBF: Mean Time Between Failures, Used Correctly
A plain-language explainer covering what MTBF really measures, common misuses, worked examples from real plants, and how AI-native systems track it well.
What MTBF Actually Measures
Mean Time Between Failures is the average operating time an asset — or more accurately, a population of similar assets — runs between one failure and the next. It's calculated from repairable equipment specifically, which is an important distinction: MTBF describes how often something breaks and gets fixed again, as opposed to a one-time-use component's expected lifespan before permanent failure, which is a different statistic entirely. The confusion between the two is common enough that it's worth stating plainly upfront, since applying MTBF logic to a component that only fails once leads to a fundamentally wrong interpretation of the number.
A Worked Example From a Real Plant Floor
Take a fleet of ten identical pumps running continuously across a quarter — roughly 2,160 hours of operation per pump if the quarter is treated as running 24 hours a day, giving 21,600 total operating hours across the fleet. If that fleet experiences six failures across the quarter, the calculation divides total operating hours by the number of failures: 21,600 divided by 6 gives an MTBF of 3,600 hours, or 150 days. That number describes the fleet's average failure frequency — it does not mean any individual pump is guaranteed to run exactly 3,600 hours before failing. One pump in that fleet might fail at 800 hours while another runs 6,000 hours without incident, and both outcomes are entirely consistent with a fleet average of 3,600.
This is the single most common misunderstanding of MTBF in practice: treating the average as a schedule. A maintenance planner who reads an MTBF of 3,600 hours and assumes a specific pump will fail right around that mark is applying population-level statistics to an individual asset, which is a category error the number was never designed to support. MTBF is genuinely useful for fleet-level planning — sizing a spares inventory, comparing one pump model's reliability against another, or estimating overall maintenance labor demand across a quarter — but it is a poor tool for predicting the specific failure timing of one specific machine.
MTBF vs a True Reliability Curve
What MTBF Tells You
Average failure frequency across a population of similar assets
A single number useful for fleet-level spares and labor planning
Assumes a roughly constant failure rate over the measured period
What a Reliability Curve Tells You
How failure probability actually changes over an asset's life stage
Distinguishes early-life failures, stable operation, and wear-out
Better suited to predicting when a specific asset is entering higher risk
Why Failure Rate Isn't Actually Constant Over Time
MTBF's formula implicitly treats failure rate as roughly constant across the measurement period, which is a reasonable simplifying assumption for equipment in its stable operating life, but it breaks down at both ends of a typical asset's lifespan. Early in life, equipment often experiences a higher failure rate from manufacturing defects, installation issues, and infant mortality failures that show up quickly and then taper off. Late in life, wear-out failures begin rising again as components age past their design life. A single MTBF number calculated across an asset's entire history blends all three of these phases together, which can understate the actual risk an aging asset currently carries if most of the historical failure data came from its earlier, more stable years.
Fleet
MTBF is a population average, not a prediction for any single asset
3
distinct failure-rate phases most equipment moves through: early life, stable operation, and wear-out
Repairable
equipment is what MTBF applies to — not one-time-use components with a fixed lifespan
Get Past the Fleet Average
See Failure Risk for Each Individual Asset, Not Just the Fleet
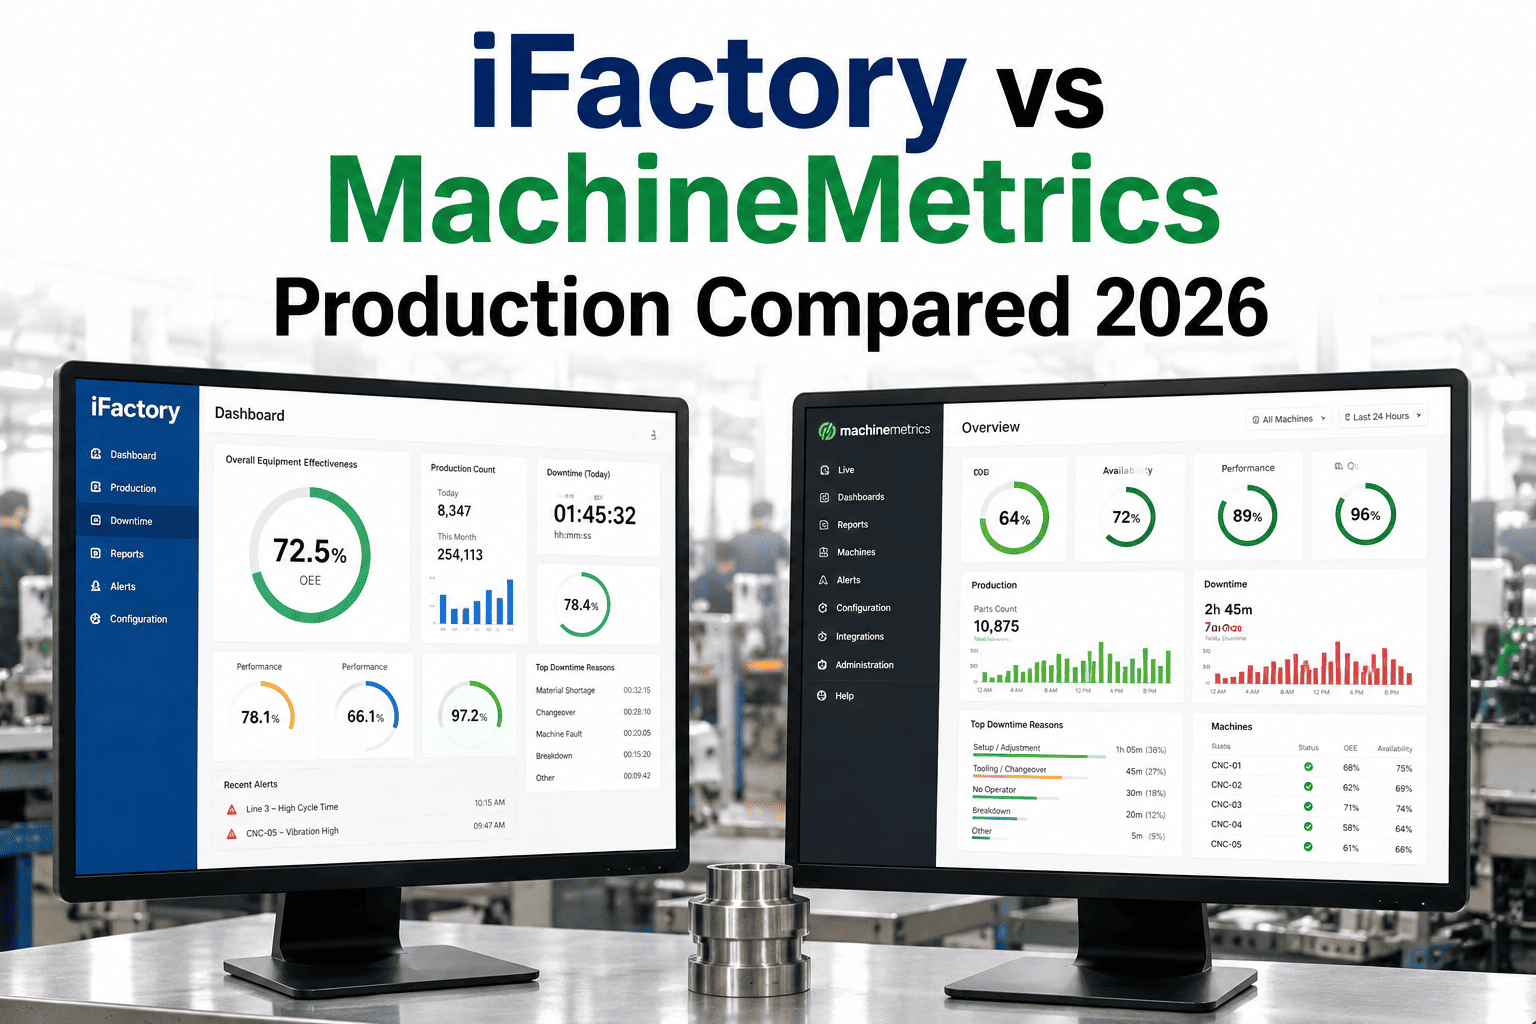
iFactory tracks failure history per asset and blends it with condition data, so you're not relying on a single fleet-wide MTBF number to plan maintenance.
Using MTBF Correctly in Practice
1
Use MTBF for fleet-level and model-level comparisons — deciding which pump model to standardize on, or how many spare motors a plant should stock.
2
Avoid using a single MTBF figure to schedule preventive maintenance on one specific asset, since individual failure timing varies widely around the average.
3
Track failure history per individual asset alongside the fleet average, so an asset trending toward more frequent failures than its peers gets flagged specifically.
4
Combine MTBF with condition monitoring data where possible, since real-time condition trends are a far better predictor of an individual asset's near-term failure risk than a historical average alone.
Frequently Asked Questions
What's the difference between MTBF and MTTF?
MTBF applies specifically to repairable equipment and measures the average time between failures across a repair cycle, while MTTF, or Mean Time To Failure, applies to non-repairable components and measures the average time until a single, permanent failure occurs. A bearing that gets replaced rather than repaired is better described by MTTF, while the pump housing it sits inside, which gets serviced and returned to operation repeatedly, is better described by MTBF.
Can MTBF be used to schedule preventive maintenance dates?
It can inform a general maintenance interval at the fleet level, but using it to schedule an individual asset's maintenance date assumes that asset will behave like the fleet average, which frequently isn't true. A more reliable approach combines the fleet MTBF as a general guideline with individual asset condition data and failure history to time maintenance on that specific unit.
Support can help set up asset-specific tracking alongside fleet-level MTBF.
Does a higher MTBF always mean a more reliable asset?
Generally yes, in relative terms, but the comparison only holds when the operating conditions and duty cycles being compared are similar. An asset running under a much lighter duty cycle will naturally show a higher MTBF than an identical asset running under heavy continuous load, so comparing MTBF across assets with very different operating conditions can be misleading without adjusting for that difference.
How much operating history is needed to calculate a meaningful MTBF?
A calculation based on only one or two failures across a short operating period is statistically fragile and can shift dramatically with the next single event, so a meaningful MTBF generally needs enough operating hours and failure events accumulated to smooth out that kind of noise. Fleet-level calculations across multiple identical assets reach a stable, useful number faster than tracking a single asset in isolation.
Why does MTBF sometimes look better than a plant's actual downtime experience would suggest?
This often happens when operating time is measured against calendar time rather than true running hours, inflating the denominator and making the failure rate look lower than it actually is relative to how hard the asset is really being used. It can also happen when the historical data blends an asset's earlier, more stable operating years with its current, more failure-prone wear-out phase into one averaged number.
A demo can show how running-hour-based tracking corrects for this.
Track Reliability the Right Way
Combine Fleet MTBF With Real Per-Asset Condition Data
See how iFactory blends historical failure data with live condition monitoring for a far more accurate picture than MTBF alone.