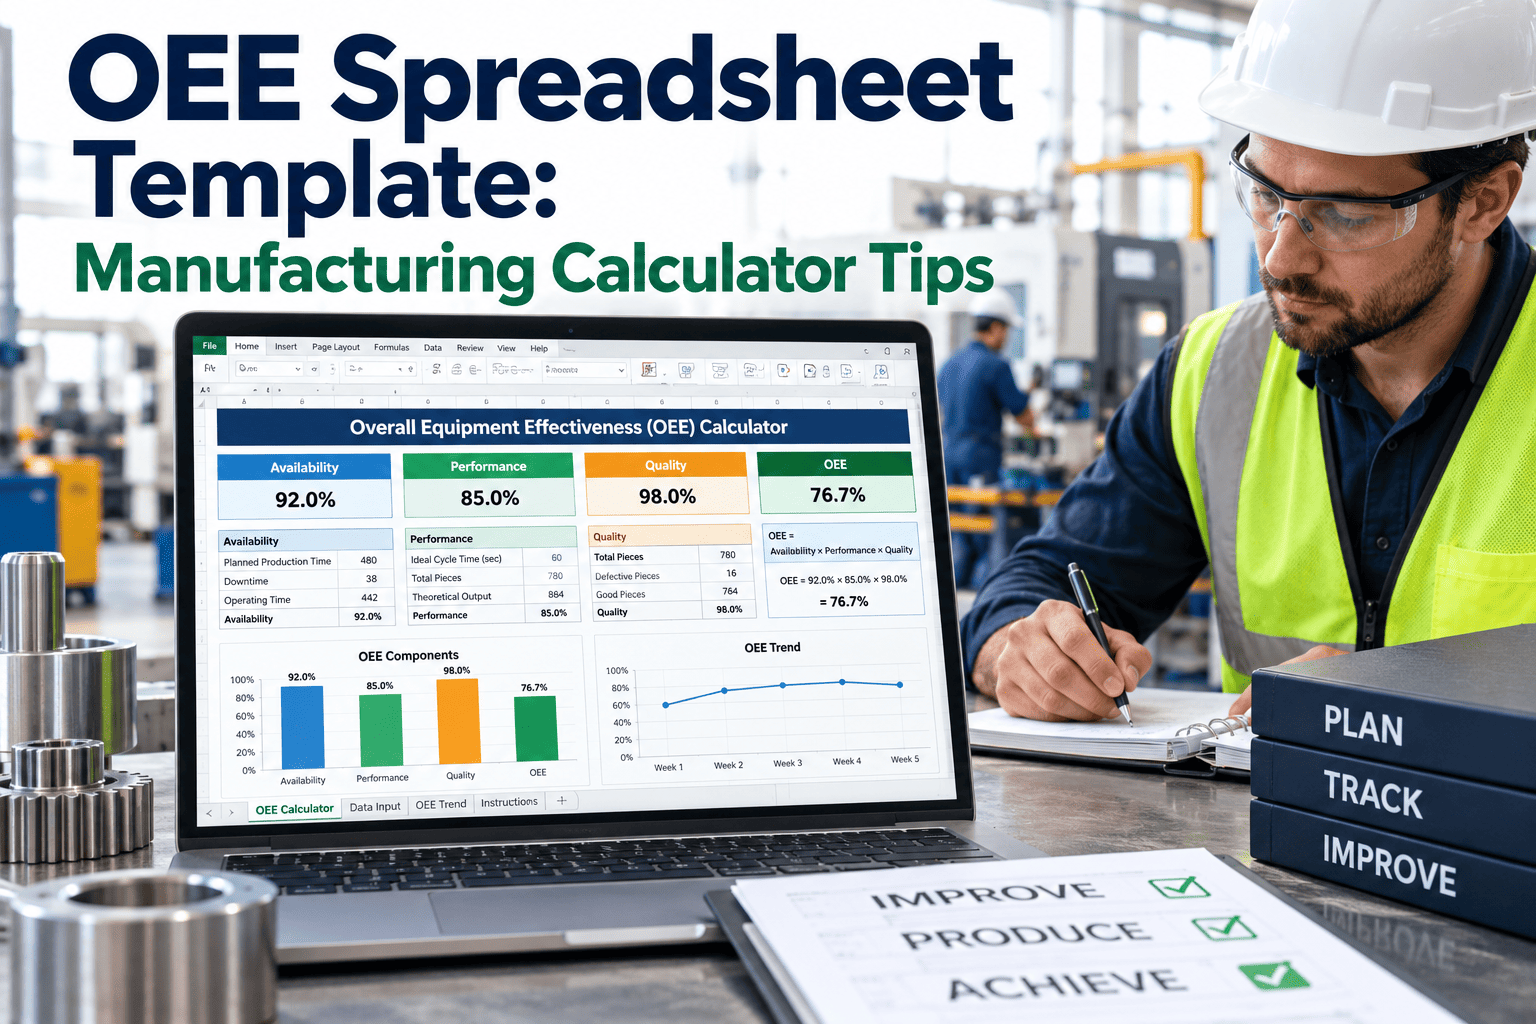
An OEE spreadsheet starts out simple enough: a few columns for downtime, a formula for performance, a formula for quality, multiplied together into a single score everyone can glance at. It rarely stays simple for long. Someone edits a formula on one line and forgets to copy it down the rest of the sheet, a shift supervisor enters downtime in minutes while another enters it in hours, and within a few months the "OEE tracker" has three slightly different versions floating around with three slightly different numbers for the same shift. None of this is anyone's fault exactly — it's just what happens when a calculation that needs to be consistent across every line, every shift, and every day depends on manual entry and formulas nobody's fully audited in a year. See what a reliable, always-current OEE number looks like without the spreadsheet maintenance.
Every Spreadsheet OEE Tracker Eventually Becomes Three Different Trackers
Manual entry and copied formulas drift apart faster than anyone notices. A reliable OEE number needs the same formula, the same inputs, and the same update frequency every single time.
the typical number of slightly different spreadsheet versions floating around a plant within a year of starting manual OEE tracking
common delay between when a downtime event happens and when it actually gets entered into the tracking sheet
the number of real-time alerts a spreadsheet can send when performance drops mid-shift
The Three Numbers Behind Every OEE Score
OEE is only ever as reliable as the three inputs multiplied together to produce it, and a spreadsheet's biggest risk is one of these three quietly drifting out of sync with reality.
Availability
87%
Performance
91%
Quality
96%
OEE
76%
Check Whether Your Spreadsheet Numbers Actually Agree
iFactory reviews your current OEE tracking method to show exactly where manual entry and formula drift are producing inconsistent numbers across your lines.
Where Spreadsheet OEE Tracking Breaks Down
The same three failure points show up in almost every manually maintained OEE spreadsheet, usually well before anyone notices the numbers have drifted.
Manual Data Entry Lag
Downtime and reject counts get entered at the end of a shift rather than as they happen, which means the score reflects yesterday's problems instead of today's developing ones.
Formula Drift Across Versions
A formula edited on one tab, one line, or one copy of the file quietly diverges from the original, and nobody notices until two people compare numbers for the same shift and get different answers.
No Real-Time Visibility
A spreadsheet updates when someone opens it and types in numbers, which means a performance dip mid-shift goes completely unnoticed until the end-of-day review, if it gets noticed at all.
Tracking Method Compared
Each tracking method trades off setup cost against how current and how consistent the resulting OEE number actually is.
Building a Formula You Can Actually Trust
Whether OEE stays in a spreadsheet or moves to a connected system, the same three steps determine whether the resulting number is trustworthy.
Standardize the formula and inputs
Every line and shift needs to define downtime, ideal cycle time, and reject criteria identically, since even a well-built formula produces meaningless comparisons if the inputs feeding it aren't consistent.
Automate data capture where possible
Pulling downtime and count data directly from equipment or PLC signals removes the lag and transcription error that manual entry introduces, even as a partial step before a full system replaces the spreadsheet.
Layer in trend visibility
A single end-of-day score tells you what happened; a continuously updating trend tells you what's happening right now, which is the difference between reacting to yesterday's loss and catching today's.
What Changes When OEE Stops Living in a Spreadsheet
Figures reflect typical outcomes within the first quarter after moving from manual spreadsheet tracking to continuous, automated OEE calculation.
An Operations Manager's View on Ditching the Spreadsheet
We had two supervisors reporting different OEE numbers for the same shift for almost a month before anyone figured out one of them was still using a copy of the sheet from before we updated the ideal cycle time formula. Once tracking moved off spreadsheets entirely, that entire category of argument just disappeared, because there was only one number and everyone was looking at the same one.
The Bottom Line on OEE Spreadsheet Tracking
A spreadsheet is a reasonable place to start tracking OEE, but it rarely stays reliable for long once multiple people, shifts, and lines depend on it staying consistent. Manual entry lag, formula drift, and the total absence of real-time visibility are built into the format itself, not a result of anyone doing it wrong. Moving the same three-part calculation onto a connected, automated system doesn't change what OEE measures — it just makes the number something everyone can actually trust.
Frequently Asked Questions
What's the actual formula behind an OEE calculation?
OEE multiplies three factors together: Availability, the ratio of actual run time to planned production time; Performance, the ratio of actual output rate to the ideal or design rate; and Quality, the ratio of good units produced to total units produced. All three need to be measured consistently for the resulting percentage to mean anything when compared across lines or over time. Book a review to see how your current calculation compares to a standardized formula.
Is a spreadsheet ever good enough for OEE tracking?
A spreadsheet can work reasonably well for a single line with a dedicated person maintaining it carefully, but it tends to break down as more lines, shifts, and people get involved, since consistency depends entirely on everyone entering data the same way and nobody accidentally editing a formula. Scale is usually what exposes the cracks, not the initial setup.
How do I know if my current OEE numbers are actually reliable?
A useful test is comparing the same shift's OEE calculated by two different people or two different sheet versions — if the numbers don't match exactly, there's a definitional or formula inconsistency somewhere in the process that needs to be resolved before the OEE trend can be trusted for decision-making.
What data actually needs to be automated first if I can't replace everything at once?
Downtime capture typically offers the fastest return, since it's usually the most manually entered and most delayed piece of the calculation, whereas quality and count data often already exist in some digital form through inspection or counting equipment that just needs to be connected rather than re-entered by hand.
Can an automated OEE system still produce the same downloadable reports my team is used to?
Yes — most connected systems can still export the same shift, daily, or weekly report formats a team already relies on, while adding the real-time view and consistency guarantees a spreadsheet can't provide, so the transition doesn't have to mean giving up familiar reporting formats. Talk to a specialist about matching your current reporting needs during a transition.
Get One OEE Number Everyone Actually Trusts
Book a 30-minute assessment. iFactory reviews your current OEE tracking and shows exactly what a consistent, automated calculation would look like.