Pharma plants almost universally report OEE in the 70-80% range. When the same lines are instrumented with direct sensors and measured in parallel to the official report, the real OEE sits at 52-62% for blister packaging and 48-58% for cartoning. The gap isn't operator failure — it's structural. Micro-stops go unlogged, speed losses go unmeasured, changeover gets categorized as planned. Real-time production monitoring closes that gap and surfaces losses while there's still time to act on them — and does it without disturbing 21 CFR Part 11 or EU Annex 11, because it layers on top of the DCS, SCADA, and MES you already validated. An iFactory live dashboard reads the historian and OPC tags you already own, and computes the KPIs the existing stack doesn't.
iFactory Production Execution for Pharma
Real-Time Production Monitoring in Pharma Manufacturing
Live monitoring exposes losses while there's still time to act — without disturbing the DCS, SCADA, or MES you already validated. Here is what it surfaces, how it layers on the existing stack, and why it ships ALCOA+ compliant on day one.
~35%
pharma industry-average OEE
1.75×
uplift from digitized plants
ALCOA+
compliance, built in
Layered
above DCS, SCADA, MES
The Honest Gap Between Reported and Measured
The most cited number in pharma manufacturing is the one most quietly overstated. SCW.AI's benchmark analysis puts industry-average OEE just above 35%; TeepTrak's 2026 study across 120+ packaging lines shows reported OEE in the 70-80% band collapsing to measured 52-62% the moment direct-sensor capture is run alongside the existing report. The same study showed digitized plants run 1.75× the OEE of average ones — which means the loss isn't in equipment, it's in visibility. Real-time monitoring is how that visibility gets restored.
Where Live Monitoring Sits in the Pharma Stack
The most common reason live monitoring stalls in a pharma plant isn't technical — it's validation anxiety. The existing stack is GMP-validated end to end, and touching any layer of it means revalidation. The fix is not to touch any of it. Live monitoring belongs above the validated stack, reading from it through OPC and historian connectors, never writing back into the control path. That way the dashboard ships without disturbing a single qualified loop.
Layer 5
iFactory Live Dashboard
Real-time OEE, batch progress, deviation alerts, yield drift, downtime classification. Reads from historian and OPC. Audit-trailed, ALCOA+ from day one.
Electronic batch records, batch genealogy, recipe execution, line clearance, eLogbooks. Werum PAS-X, Honeywell TrackWise, Emerson Syncade, and equivalents.
Process control loops, HMI screens, alarm management, historian. Honeywell Experion, Emerson DeltaV, Siemens PCS 7, Aveva InTouch, Rockwell PlantPAx.
Local automation logic, sequencing, interlocks, batch phase execution. Allen-Bradley, Siemens S7, Schneider Modicon, and equivalents on the floor.
Layer 1
Field Instruments
Sensors, transmitters, actuators, valves, PAT probes — NIR, Raman, FTIR, conductivity, pH, temperature, vibration. The source of the raw data.
Four Live Signals Most Pharma Plants Aren't Watching
Pharma teams almost always have the data; what's missing is the live view. These four signals are inside every historian we've ever connected to — and almost none of them are on a screen anyone watches in real time.
Signal 1
Live OEE by Loss Category
Availability, performance, and quality broken into the six big losses, in real time. Micro-stops, speed losses, and unreported changeover — the gaps between reported and measured OEE land here.
Signal 2
Batch Progress & Phase Drift
Every batch as a live timeline against its golden run. A granulation step running 12% long, a coating cycle drifting cool, an unexplained hold — visible the moment they start, not in tomorrow's deviation review.
Signal 3
Yield & Right-First-Time Drift
Yield against target and RFT against history, by product and line. Drift shows up over days, not a single batch — which is why a live dashboard catches it and an end-of-quarter report doesn't.
Signal 4
Deviation & Hold Status
Open deviations, batches on QA hold, investigations in progress, line clearance status — surfaced on one screen so the floor knows exactly which units are blocked and why.
Want these four signals stood up on your historian tags? Talk to our pharma team and we'll show what's already in your data — and what's missing.
Batch in Motion — Four Lines, One Screen
Live monitoring is most powerful when an operator can see every active batch on one screen and tell at a glance which one needs attention. The view below is the kind of thing the dashboard puts in front of a control-room operator at any moment: four parallel batches, current stage, progress against the golden run, and status.
BX-2026-0419
Compound XR 200 mg · Line 2
Running
BX-2026-0420
Tablet AX 50 mg · Line 4
Phase Drift
BX-2026-0421
Capsule BL 10 mg · Line 1
QA Hold
BX-2026-0422
Compound CR 100 mg · Line 3
Released
Built for ALCOA+ From Day One
Live monitoring in pharma earns the right to exist by being audit-defensible from the first record it captures. The nine ALCOA+ principles aren't a feature list — they're the floor every electronic record has to meet under 21 CFR Part 11 and EU Annex 11. iFactory writes every datum to that standard automatically, so the dashboard is inspection-ready, not inspection-vulnerable.
A
Attributable
Every record tied to a unique user ID
L
Legible
Readable now and decades later
C
Contemporaneous
Recorded at the moment of the event
O
Original
First capture, never a retyped copy
A
Accurate
Matches the physical event exactly
C
Complete
All data, including reruns and edits
C
Consistent
Same format, sequence, and time base
E
Enduring
Survives the retention period intact
A
Available
Retrievable for audit at any time
This matters in numbers. Between 2017 and 2022, the FDA issued more than 160 warning letters to pharmaceutical manufacturers citing data-integrity deficiencies — missing audit trails, shared logins, retroactively edited records, incomplete electronic data. A monitoring layer that fails any of the nine ALCOA+ letters becomes a 483 observation; one that satisfies all nine becomes the evidence packet your auditor wants to see.
Curious how the dashboard's audit trail maps to your last Form 483? Book a demo and we'll walk through it field by field.
Excel + Paper vs Live Dashboard
The same OEE data, the same batch records, the same deviations — the value comes from when the operator sees them. End-of-shift Excel is the postmortem; a live dashboard is the decision aid. The list below is the same line at the same plant, run two different ways.
Shift report + paper logbook
The Postmortem
OEE calculated in Excel hours after the shift ended
Micro-stops under 5 minutes never logged
Changeover recorded as a single "planned" block
Deviations found in next-morning review
Audit trail reconstructed manually before inspections
Live iFactory dashboard
The Decision Aid
OEE live by loss category, broken down by line and product
Micro-stops captured at sub-second precision
Changeover measured first qualified unit to first qualified unit
Deviations flagged as the parameter drifts, not after
Audit trail written ALCOA+ from the first record forward
Standing It Up in Thirty Days
A real-time monitoring layer doesn't need a multi-quarter program. Pharma deployments follow the same four steps, and almost always run on the historian tags you already have.
1
Connect, Don't Touch
Read-only OPC and historian connectors from the DCS, SCADA, and MES. No changes inside the validated stack, no revalidation. Connection patterns are pre-qualified for the major platforms.
2
Map Tags to KPIs
Existing tags become live OEE, batch progress, deviation status, yield drift. We use the tags you already record, with no new sensors for the first cut — the gap is in the calculation and the screen, not the data.
3
Validate the Layer Itself
IQ, OQ, and PQ scripts on the monitoring layer only — much narrower than a full MES qualification. The connectors are read-only, the audit trail is ALCOA+, and the documentation pack ships with the deployment.
4
Route Signals to the Floor
Live dashboard in the control room, mobile alerts for the area supervisor, shift report generated automatically from the same data. The first dashboard typically pays for the program inside one quarter.
Want the thirty-day plan against your plant's stack? Talk to a specialist and we'll scope the connectors, the tags, and the validation package.
Frequently Asked Questions
Does the dashboard require revalidating our MES or DCS?
No. Live monitoring sits above the validated stack and reads from it through OPC and historian connectors — never writing back into the control path. The validated layers are untouched. Only the monitoring layer itself is qualified, which is a much narrower scope than a full MES or DCS revalidation.
How is this different from what our MES already provides?
MES handles electronic batch records and execution; it isn't built to surface live OEE losses, micro-stops, or cross-line yield drift on a single screen. The monitoring layer reads MES data and adds the calculations and visualizations the MES doesn't natively compute. It augments MES rather than replacing it.
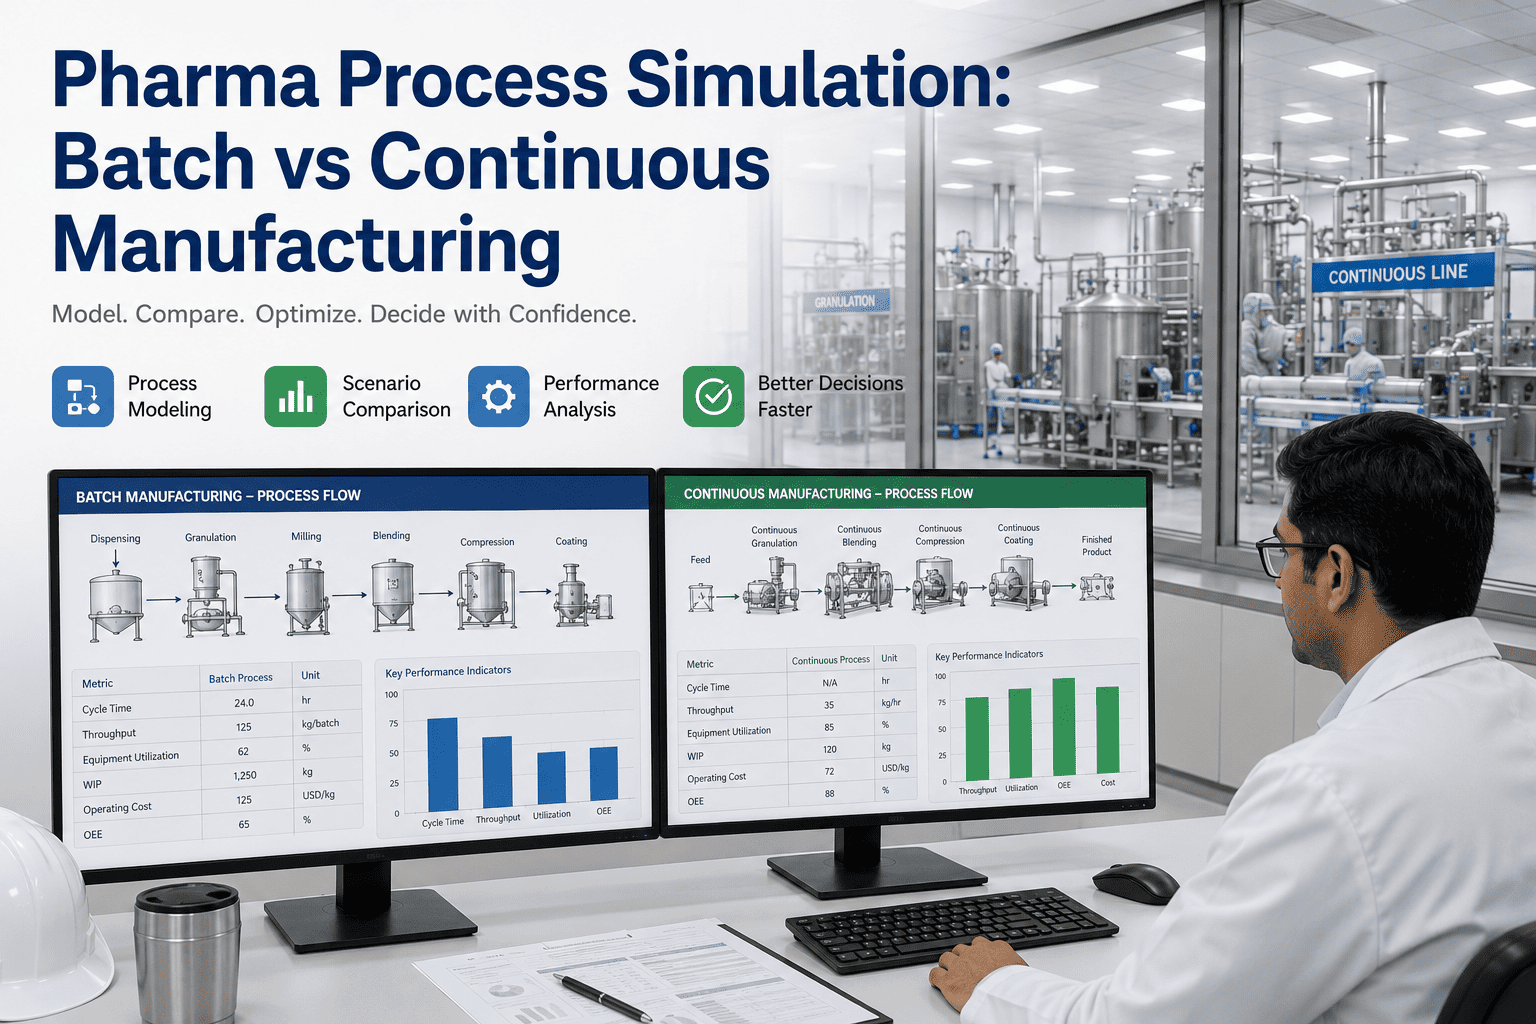
How big is the gap between reported and measured OEE, really?
Larger than most plants expect. Direct-sensor benchmarks across 120+ pharma packaging lines show reported OEE in the 70-80% band collapsing to a measured 52-62% on blister lines and 48-58% on cartoning when the measurement is run in parallel. Micro-stops, speed losses, and miscategorized changeover account for most of the delta.
Is the audit trail truly 21 CFR Part 11 and EU Annex 11 ready?
Yes. Every record is attributable to a unique user ID, timestamped contemporaneously, captured originally with no edit-in-place, and held for the retention period in a system that is auditable end to end. ALCOA+ is the design baseline, not an add-on — which matters because data-integrity findings made up a substantial share of FDA drug GMP warning letters in recent fiscal years.
Where should we start if we've never run a live monitoring layer before?
Pick the highest-volume packaging or compression line — the one where one percentage point of OEE has a clear dollar value. Connect read-only to its historian and MES, stand up live OEE by loss category, and run it for a month against your existing report. The gap will tell you everything you need to know about where to expand next.
Don't just report it. See it.
See Your Lines Live, Without Touching the Validated Stack
Bring one line — packaging, compression, or coating — where reported OEE feels higher than reality. We'll stand up a read-only monitoring layer above your existing DCS, SCADA, and MES, surface the four live signals on one screen, and run it for thirty days alongside your current report. The gap will tell you what real-time monitoring is worth on your floor.
30
days, first dashboard live
Read
only, never writes back
ALCOA+
from the first record
Existing
tags, no new sensors