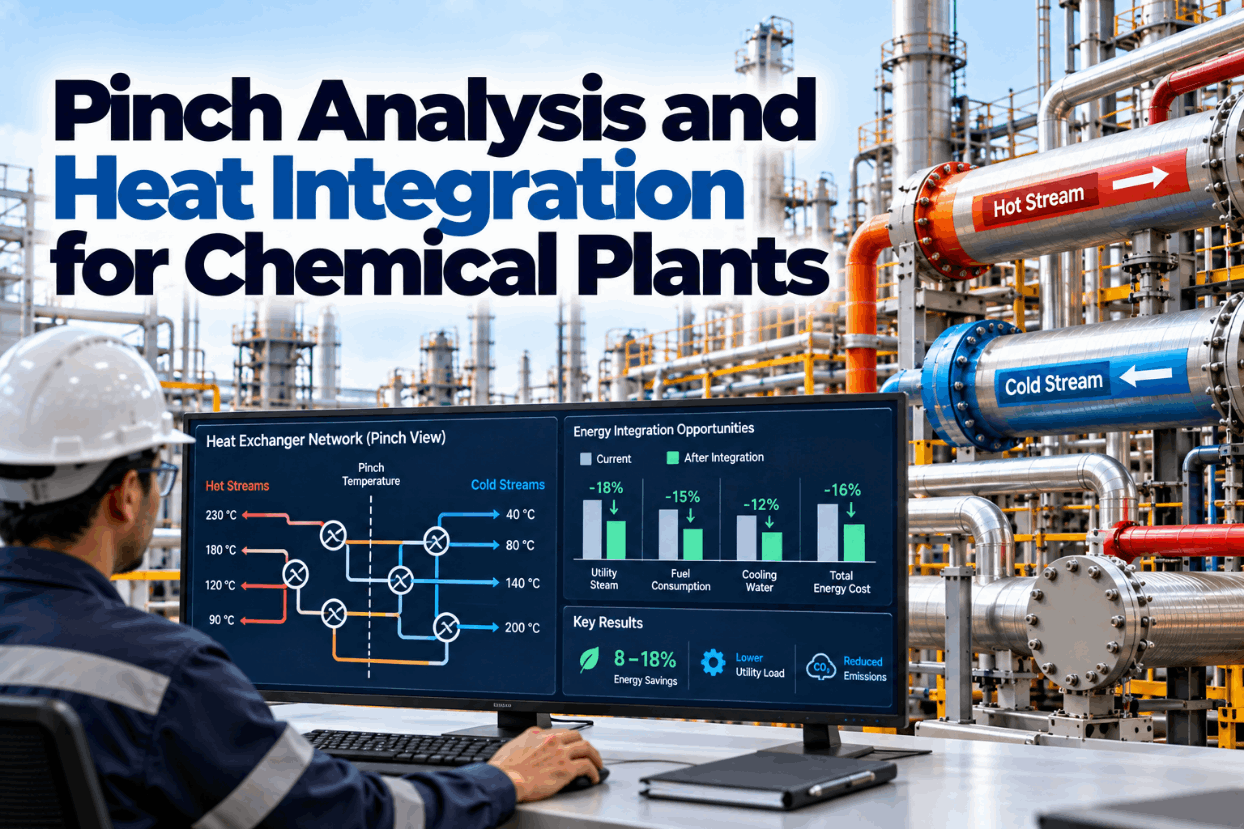
Most chemical plants had a pinch study at some point, usually during design or a major revamp. The report set energy targets, named the exchangers that moved heat the wrong way and listed projects. Then the plant kept running and the numbers moved: feeds changed, rates went up, exchangers fouled and new streams were tied in. The heat network drifted away from the targets the study set, and nobody re-ran the analysis because it took weeks of data extraction. Continuous pinch analysis fixes that by recalculating composite curves and targets from live historian data, so the gap between actual utility use and the minimum is visible every day. This guide explains the method, the rules, the choice of minimum approach temperature, how retrofits are found and what savings sources actually support. To see your own composite curves built from plant data, book a short walkthrough.
Pinch Analysis and Heat Integration for Chemical Plants: Keep Your Heat Network on Target
Composite curves, energy targets and cross-pinch exchangers recalculated from live plant data, so steam and cooling water use stays close to the minimum your process allows.
Why Heat Networks Drift Away From Their Targets
A chemical plant’s heat exchanger network is designed around a set of stream temperatures and flows. A pinch study at design time finds the minimum hot and cold utility the process needs and arranges exchangers to approach it. From the first day of operation, reality starts to move. Throughput rises above design, feed composition changes, catalysts age, exchangers foul and new streams are tied in during debottlenecking. Each change shifts the composite curves, and the network that was close to its target slowly falls behind.
The cost lands in utilities. Process heating is the largest end use of energy in chemical manufacturing: US Department of Energy analysis of the chemicals sector puts process heating at 58% of end-use energy. When a network drifts, the plant burns more fuel in fired heaters, raises more steam and pumps more cooling water than the process requires.
Natural Resources Canada, which has run pinch programs with industry for decades, reports that process integration typically finds energy savings of 10–30%, sometimes more, with payback of one to three years. The difficulty is not the method. It is that the analysis is done once, on a snapshot of data, and then left on a shelf while the plant changes.
Continuous targeting keeps the study alive. We can review your heat network data on a call.
The Core Ideas of Pinch Analysis
Pinch analysis is a thermodynamic method for setting energy targets before designing or changing a heat network. Its main tools are simple to describe.
The power of the method is that targets come first. Engineers know the best achievable utility use before they look at individual exchangers, so they can measure every network against it.
The same targets work as a daily performance measure once they are calculated from live data. See how that looks in a demo.
The Three Rules That Protect Energy Targets
Linnhoff March, whose engineers developed much of the method, summarizes pinch design in three rules. Breaking any of them adds energy above the target.
Heat moved from the region above the pinch to the region below it must be replaced by extra hot utility above and removed by extra cold utility below.
The region above the pinch is a heat sink. Cooling it with cooling water or air throws away heat the process needs, which then has to be supplied by steam or fuel.
The region below the pinch is a heat source. Heating it with steam adds heat that must be removed again by cooling utilities.
In an existing plant, the task is to identify exchangers, heaters and coolers that break these rules and estimate the penalty each one carries.
The largest violations with the cheapest fixes come first, such as re-piping one exchanger or moving a cooler.
The rules sound obvious, but existing networks break them all the time. A cooler added during a revamp to solve a temperature problem may sit above the pinch. A steam heater installed for start-up may stay in service below it. Each looks harmless on its own, and together they can add many megawatts.
Our engineers can screen your network for rule violations from historian data.
Choosing the Minimum Approach Temperature
The minimum approach temperature sets the balance between energy and capital. A smaller value recovers more heat but needs more exchanger area. A larger value saves area but leaves more utility use.
| Process type | Typical minimum approach | Why |
|---|---|---|
| Chemical processes | 10–20 °C | Moderate fouling, liquid and gas streams |
| Petrochemical processes | 10–20 °C | Similar to chemical processes |
| Oil refining | 20–40 °C | Fouling-prone heavy streams and large duties |
| Fouling-prone systems | 30–40 °C | Larger margins to allow for duty loss |
| Low-temperature and refrigeration | 3–5 °C | Refrigeration energy is expensive, so tight approaches pay |
These ranges come from Linnhoff March’s introduction to pinch technology and the Natural Resources Canada pinch guide. They are starting points, not rules. The right value for a given plant depends on energy prices, exchanger costs and how quickly streams foul.
Energy prices change the answer. When fuel and steam become more expensive, the economic minimum approach moves lower and projects that were not worth doing become attractive. A continuous model makes it easy to re-run targets at new prices and see which projects cross the payback line.
Re-running targets at current energy prices is often the fastest way to refresh an old study. We do it as part of every rollout.
Measuring the Gap Between Actual and Target
Once targets are calculated from live data, the gap between actual and minimum utility use becomes a daily performance measure.
Illustrative. Breaking the gap into causes shows which part is a design issue, which is an operating issue and which is maintenance.
This breakdown is what turns pinch from a design study into an operating tool. A design issue, such as a cross-pinch exchanger, goes on the project list. An operating issue, such as a cooler running when it could be bypassed, can be fixed this week. A fouling issue goes to maintenance as a cleaning priority with an energy value attached.
Targets move with the process. When throughput rises or feed changes, the minimum utility changes too. Comparing actual use against a target calculated for today’s conditions avoids blaming operators for energy that the process genuinely needs.
Most plants find the gap is larger than they expect. Ask our team to estimate yours.
Finding Retrofit Projects in an Existing Network
Retrofitting an existing network is different from designing a new one. Natural Resources Canada notes that the largest gains come in new designs, because retrofits usually need capital. The task is to find the projects with the best return.
Stream temperatures, flows and heat capacities from the historian and lab, checked for consistency.
Composite curves, pinch temperature and minimum utilities at current conditions and prices.
Exchangers, heaters and coolers that transfer heat across the pinch.
Re-piping, added area, new matches and utility level changes.
Energy saving, capital cost, payback and operability for each option.
Measured saving after implementation, against the target.
Published results vary by sector. NRCan’s pinch guide reports purchased fuel savings of 15–35% for chemicals, 15–25% for petrochemicals and 10–25% for oil refining. IPIECA’s energy efficiency compendium gives 8–25% of purchased heating fuel for refining, and cites a crude preheat train study that achieved 8% total energy savings once payback was taken into account.
Those ranges are what studies identify across a whole site, not a promise for any one network. The right number for a plant comes from its own targets and the projects that pay back at its own energy prices.
Option screening is faster when targets are already current. Discuss your network with our specialists.
One-Off Studies Versus Continuous Targeting
A traditional pinch study is a project. Continuous targeting is a routine.
- Weeks of manual data extraction
- Snapshot of one operating case
- Targets go stale as the plant changes
- Fouling effects invisible between studies
- Projects ranked once, then forgotten
- Savings rarely verified after the fact
- Data pulled from historian automatically
- Targets recalculated for current conditions
- Gap to target tracked daily
- Fouling penalties valued in energy terms
- Project list refreshed as prices change
- Savings measured against live targets
Continuous targeting does not replace engineering judgment. Retrofit options still need process, mechanical and safety review. What it changes is that the energy picture is always current, so the engineering effort goes where the gap is largest.
It also links energy to maintenance. When fouling on a preheat exchanger adds a measurable amount of steam or fuel, cleaning can be scheduled on energy value rather than on a fixed interval or a temperature alarm.
That link between fouling and energy is often the first saving plants capture. See it in a session.
Heat Integration Checklist
Use this checklist to move from a one-off study to continuous heat integration.
Most plants already have the data in their historian. Getting it into a usable stream list is the first step of a heat review.
What Continuous Heat Integration Is Worth
The value comes from closing the gap between actual and target utility use and keeping it closed.
NRCan’s figures, 10–30% typical and 15–35% for chemicals, show the scale of what process integration can find. A plant that has already done a study may find a smaller remaining gap, but the operating savings from fouling and utility management usually remain, because they reappear as soon as attention moves elsewhere.
A first estimate of your gap to target can be made from a few weeks of historian data. Book one with our advisors.
How iFactory Delivers Continuous Pinch Analysis
Temperatures and flows mapped from historian tags.
Minimum hot and cold utility at today’s conditions.
Cross-pinch exchangers, misplaced heaters and coolers.
Lost exchanger duty valued in steam and fuel.
Options ranked by saving, capital and payback.
Measured results against live targets.
Everything runs on premises next to your historian. Share a stream list or a month of data and we will build your composite curves in a working session.
See How Far Your Network Sits From Its Target
Share a month of historian data for one process area. We build the composite curves, set targets at today’s conditions and show where the gap comes from.
E-104 moves 1.4 MW from a stream below the pinch into a stream above it. Every megawatt crossing the pinch is paid twice: once in extra steam, once in extra cooling water.
A Cross-Pinch Exchanger Found in Daily Data
This exchange shows how an energy engineer might use iFactory.
iFactory ships as a pre-configured NVIDIA AI server, racked and ready with the heat integration and energy targeting models loaded. Rack it, plug in power and Ethernet, and the AI is live on your network. Our scope covers data connections across process units, utilities and the control room, DCS, PLC/SCADA, historian, LIMS and CMMS integration, cabling and network setup, operator and engineer training, and 24×7 remote monitoring. Recommendations run in advisory mode first, and nothing writes to your control system without your management of change approval.
Server installed, DCS and historian links live, historical process, lab and maintenance data loaded.
Models calibrated on your own unit data, then run in advisory mode on one unit with your process engineers reviewing every recommendation.
Rollout to the agreed units under your management of change, operator and engineer training, and 24×7 remote monitoring in place.
Software, server and integration come as one package. For pricing on your site, contact our sales team.
Frequently Asked Questions
A thermodynamic method that combines all hot and cold process streams into composite curves to find the minimum hot and cold utility a process needs, and the pinch point that divides it into a heat sink and a heat source.
Natural Resources Canada reports typical savings of 10–30% from process integration, with 15–35% of purchased fuel for chemical plants. IPIECA gives 8–25% of heating fuel for refining. Results depend on the plant and on capital available for retrofits.
No heat transfer across the pinch, no external cooling above the pinch and no external heating below it. Breaking any of them raises utility use above the target.
Linnhoff March and NRCan give 10–20 °C as typical for chemical and petrochemical processes, 20–40 °C for refining and 3–5 °C for refrigeration systems. The right value depends on energy prices, exchanger cost and fouling.
Because plants change. Feed, throughput, fouling and new tie-ins move the composite curves, so targets calculated from live data show the real gap and its causes every day.
A first process area can typically be running within a 6–12 week rollout, starting with stream extraction from your historian. Plan it with our engineers.
Keep Your Heat Network Close to Its Minimum
iFactory recalculates pinch targets from live data, explains the gap in megawatts and ranks the fixes, so steam and fuel savings are found once and kept.
Illustrative. The gap between actual and target is the energy the network could save before any new equipment is sized.