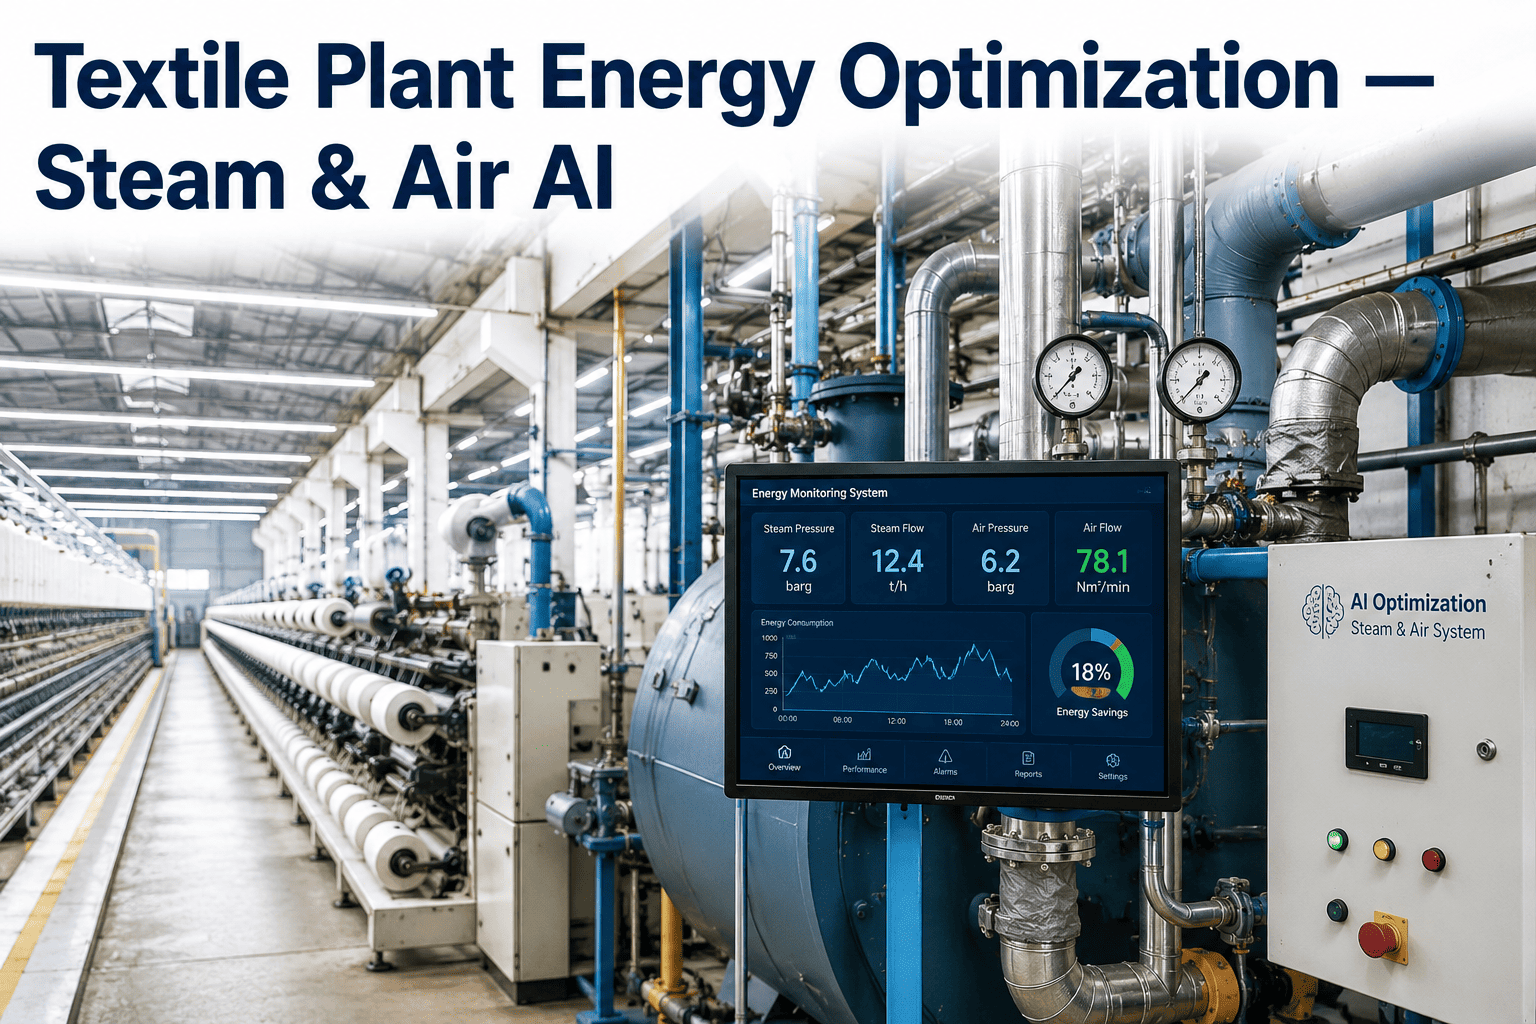
Energy is the second largest cost line in most textile plants after raw material, yet it is often the least actively managed — steam boilers run at fixed set points regardless of load, compressed air leaks go unrepaired for months, and stenter dryers operate on manual damper settings set once and never revisited. A mid-size composite mill running spinning, weaving, and dyeing can spend fifteen to twenty-five percent more on energy than it needs to simply because nobody is watching steam pressure, air leak rates, or dryer zone temperatures in real time. Utility bills arrive monthly, long after the waste has already happened, which means most textile plants are managing energy a full billing cycle behind reality. iFactory AI's energy optimization platform gives plant engineers continuous visibility into boiler efficiency, compressed air network health, and stenter dryer performance, with AI-generated recommendations that typically cut energy costs by fifteen to twenty-five percent without capital equipment changes. Book a Demo to see a savings estimate built from your plant's utility profile.
Cut Textile Plant Energy Costs 15-25% Without Capital Equipment Changes
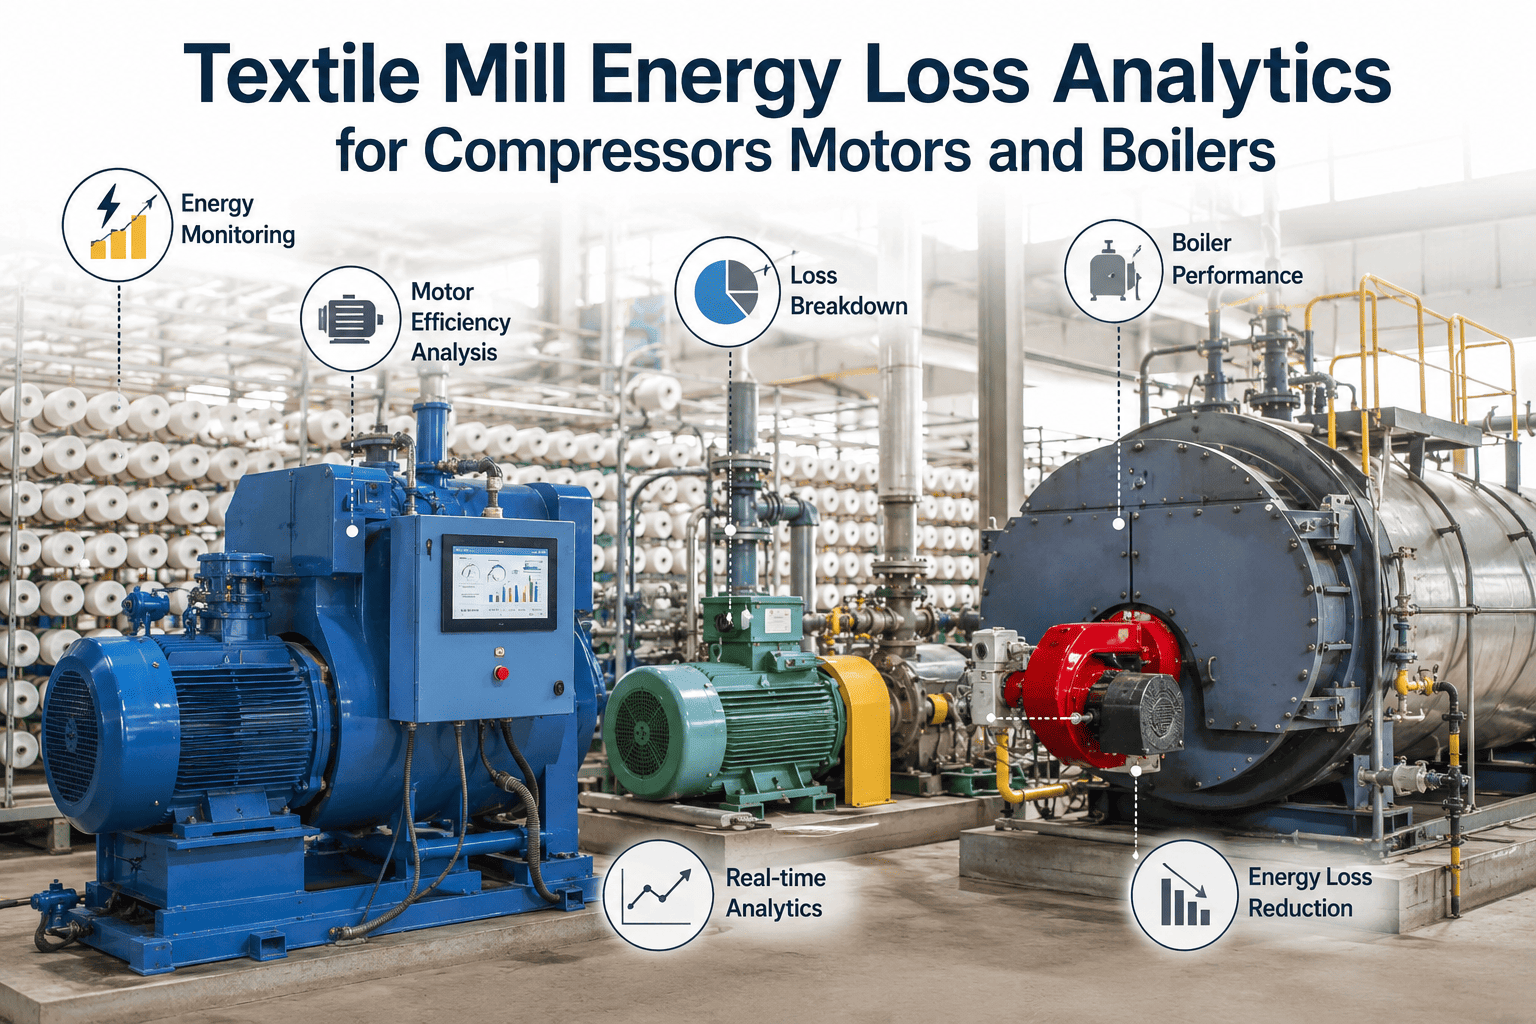
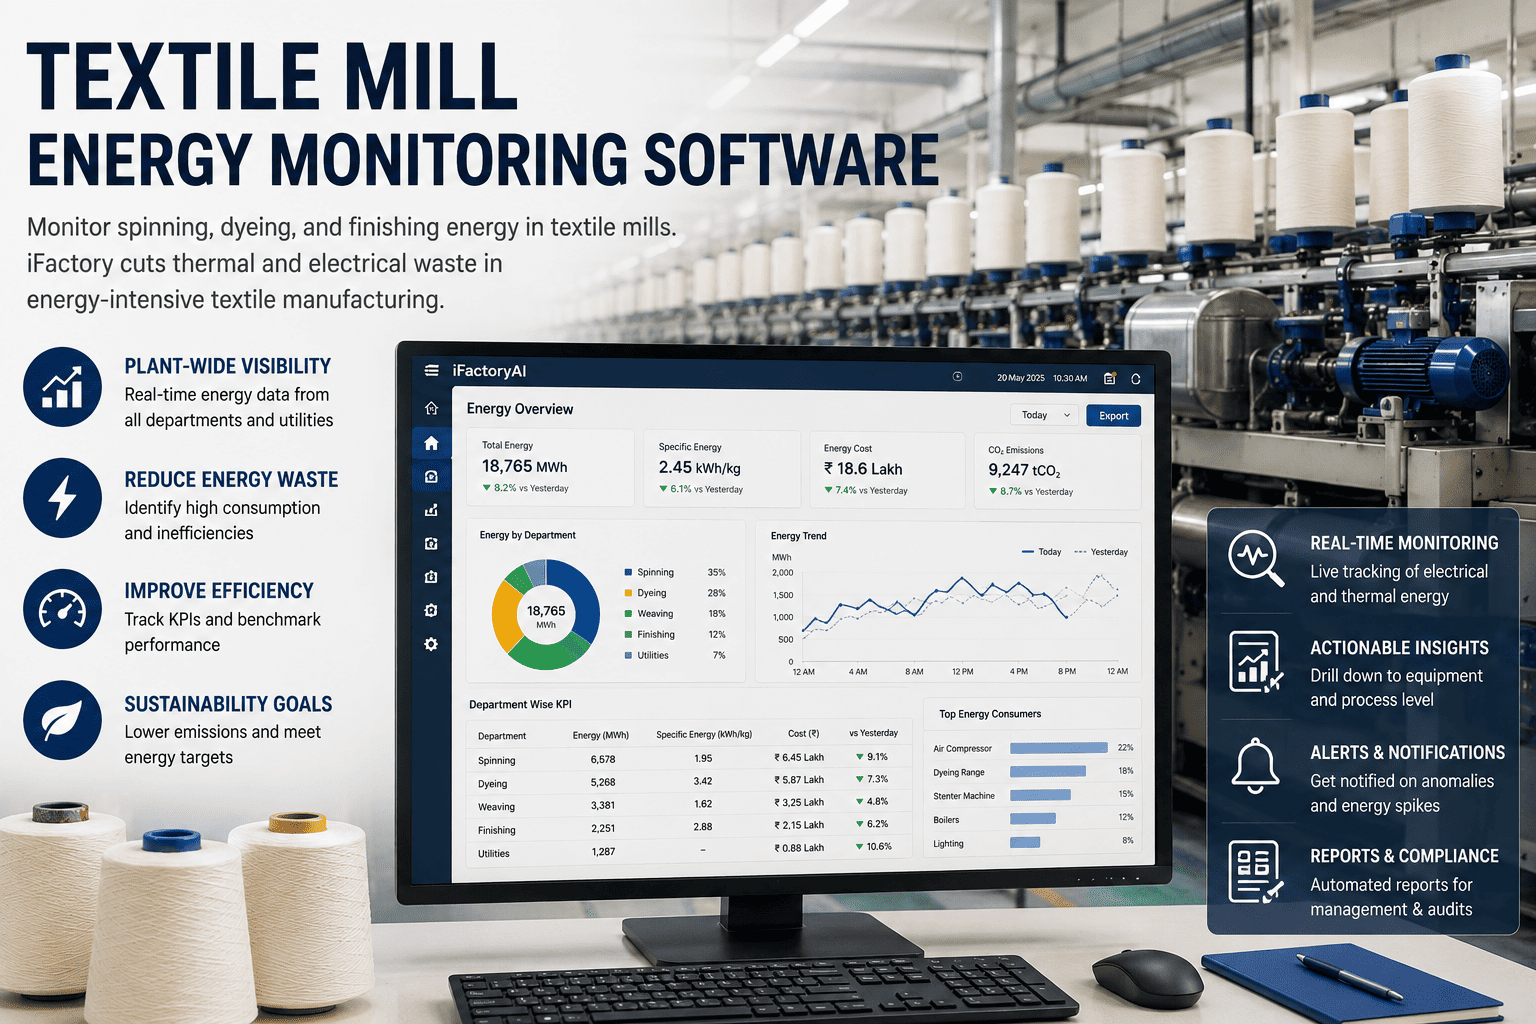
iFactory AI continuously monitors steam boiler efficiency, compressed air network leakage, and stenter dryer energy consumption, converting utility waste that used to show up only on the monthly bill into real-time, actionable alerts.
The Three Biggest Energy Leaks in Textile Manufacturing
Textile energy waste is rarely one dramatic failure — it is dozens of small, chronic inefficiencies compounding across steam generation, compressed air distribution, and thermal drying that together account for the majority of a plant's avoidable energy spend. Each of these three systems degrades quietly over time, and without continuous monitoring, plant engineers only discover the scale of the loss when a utility audit or energy consultant finally measures it directly.
Steam, Compressed Air, and Thermal Drying — Where AI Delivers Savings
The three systems below represent the largest share of controllable energy cost in a typical textile plant. iFactory AI applies a distinct monitoring and optimization model to each, because the failure patterns and savings mechanisms in steam generation are fundamentally different from those in compressed air distribution or stenter drying.
-
1
Steam Boiler Efficiency Optimization
Boiler combustion efficiency, blowdown frequency, and steam trap condition are monitored continuously, with AI flagging efficiency drift caused by fouling, incorrect air-fuel ratios, or failed steam traps before they show up as a spike on the monthly fuel bill.
-
2
Compressed Air Network Leak Detection
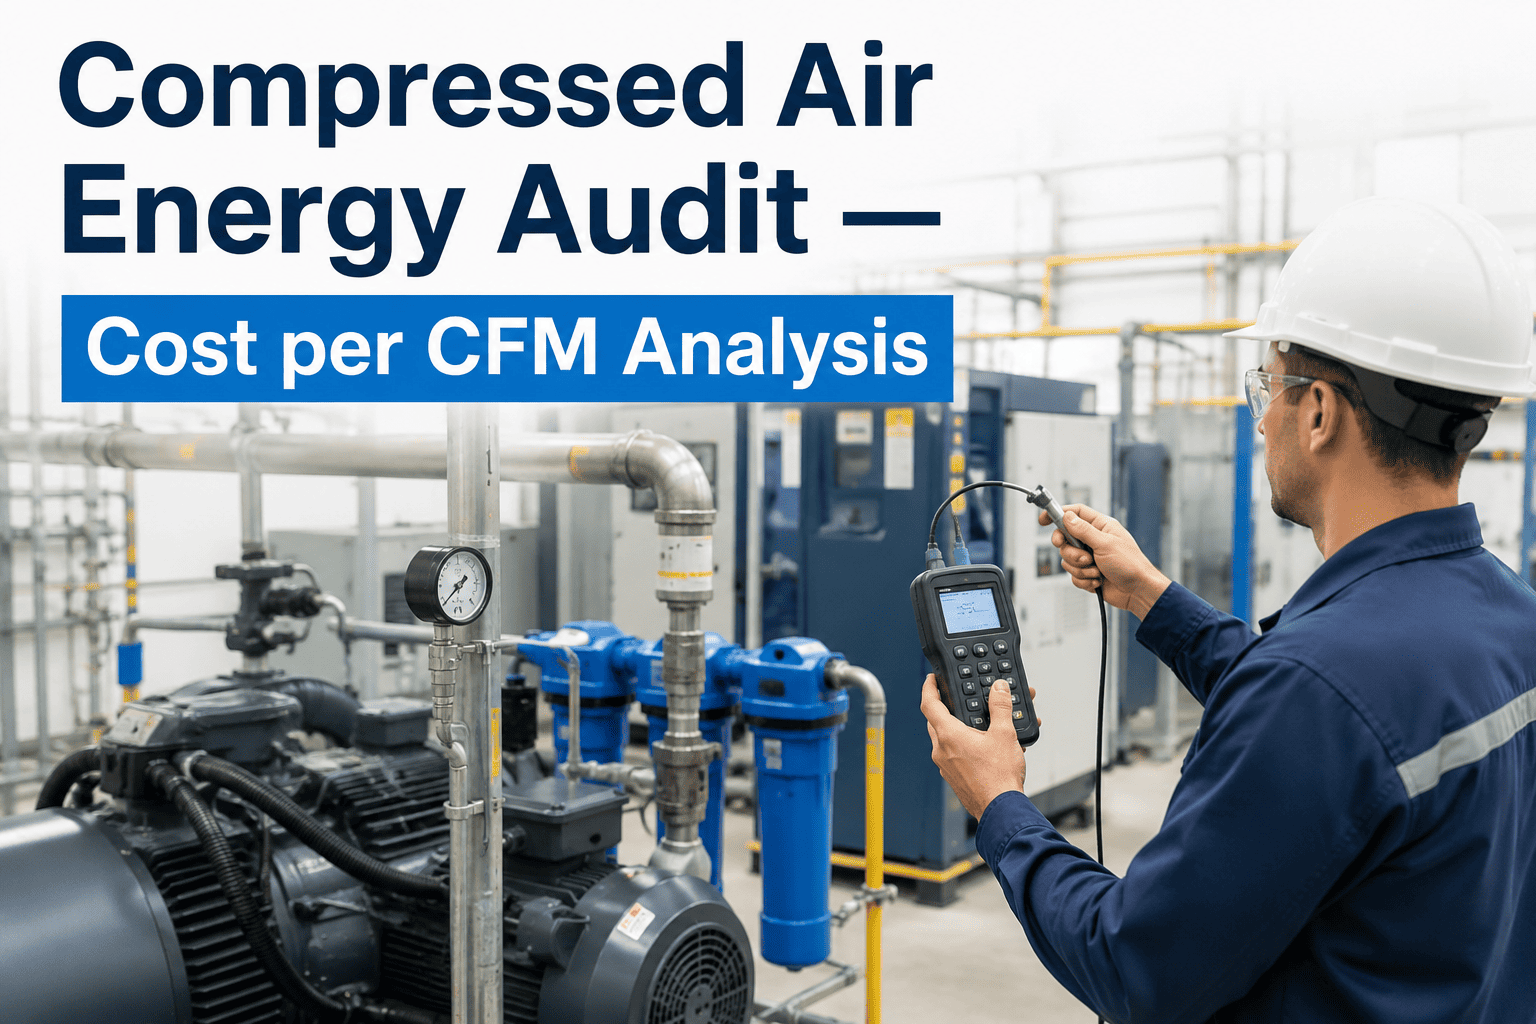
Ultrasonic and pressure-based leak detection sensors feed a continuously updated leak map of the compressed air network, prioritizing repair work by the estimated annual cost of each individual leak rather than treating the whole network the same.
-
3
Stenter Dryer Zone Optimization
Zone-by-zone temperature, exhaust damper position, and fabric speed are correlated against moisture content targets, with AI recommending damper and burner adjustments that maintain finish quality while cutting thermal energy per meter of fabric processed.
-
4
Power Factor and Motor Load Correction
Reactive power penalties and motor loading inefficiencies across spinning and weaving sheds are tracked continuously, identifying oversized or underloaded motors that quietly inflate the electricity bill month after month.
Manual Energy Audits vs. Continuous AI Monitoring
Traditional energy management in textile plants relies on periodic audits — often annual, sometimes only when a consultant is engaged — which means waste accumulates for months before anyone measures it. Continuous monitoring changes that timeline from months to hours.
- Energy waste measured once a year, if at all, by an outside consultant
- Compressed air leaks identified only during scheduled leak-hunting exercises
- Boiler efficiency assessed from monthly fuel-to-steam ratio calculations
- Savings opportunities documented in a report that is rarely fully implemented
- Steam, air, and dryer performance tracked continuously, every operating hour
- Leaks identified and cost-ranked automatically as they develop, not once a year
- Boiler efficiency drift flagged within hours of deviation from baseline
- Recommendations delivered as prioritized action items, tracked to completion
Measured Energy Savings by System
The table below shows representative savings ranges reported by textile plants after deploying continuous AI monitoring across steam, compressed air, and thermal drying systems. Results depend on baseline equipment condition and prior monitoring maturity.
| System | Typical Baseline Waste | Savings with AI Monitoring | Primary Value Driver |
|---|---|---|---|
| Steam Generation | 8-15% excess fuel use | 8-12% fuel reduction | Combustion efficiency and steam trap monitoring |
| Compressed Air | 20-30% leakage | 15-22% air cost reduction | Continuous leak detection and repair prioritization |
| Stenter Drying | 10-18% excess thermal use | 10-15% thermal reduction | Zone-level temperature and damper optimization |
| Power Factor | Reactive power penalties | Penalty elimination | Automated correction and motor load balancing |
What Plant Engineers Say About Continuous Energy Monitoring
We had run an energy audit two years earlier and implemented most of the recommendations, so we assumed we were close to optimal. Once we had continuous monitoring on our compressed air network, we found four leaks that had developed since that audit, one of them large enough that fixing it alone paid for a meaningful share of the platform in the first quarter. The bigger shift was cultural — our maintenance team now treats a leak alert the way they treat a machine breakdown alert, instead of waiting for the next scheduled leak-hunting walk.
Turn Monthly Utility Bills Into Real-Time Savings Opportunities
iFactory AI monitors steam, compressed air, stenter drying, and power factor continuously, so waste is caught the day it starts, not the month it shows up on your bill.
Textile Energy Optimization — Frequently Asked Questions
How much can a textile plant realistically save with AI energy monitoring?
Most textile plants achieve fifteen to twenty-five percent reductions in overall energy cost within the first year of deploying continuous AI monitoring across steam boilers, compressed air networks, and stenter dryers. The exact figure depends on how much waste already existed in the baseline — plants that have never run a leak detection program or continuous boiler monitoring typically see savings toward the higher end of that range.
Does this require replacing our boilers, compressors, or dryers?
No capital equipment replacement is required to achieve the majority of the savings. The platform connects to existing boiler controls, compressed air distribution, and stenter dryer instrumentation, and the savings come primarily from correcting operating inefficiencies, repairing leaks, and optimizing set points rather than installing new machinery. Contact Support to confirm compatibility with your existing equipment.
How does AI detect compressed air leaks before they become expensive?
Ultrasonic and pressure-based sensors distributed across the compressed air network continuously monitor for the acoustic and pressure-drop signatures characteristic of leaks, building a live leak map that ranks each detected leak by estimated annual energy cost. This allows maintenance teams to prioritize repair work on the highest-cost leaks first rather than working through the network in an arbitrary order during periodic leak-hunting exercises.
Will optimizing stenter dryer settings affect fabric finish quality?
AI recommendations for stenter zone temperature and damper adjustments are generated against your existing moisture content and finish quality targets, not independently of them. The system is designed to find the thermal energy reduction achievable while holding finish quality constant, and any recommended adjustment can be reviewed by the operations team before being applied on the line.
How quickly does the platform pay for itself?
Textile plants typically see payback within six months of deployment, driven primarily by compressed air leak repair savings and steam boiler efficiency gains, both of which begin delivering measurable cost reduction within the first few weeks of monitoring going live. Book a Demo to get a payback estimate built from your plant's specific utility profile and equipment inventory.