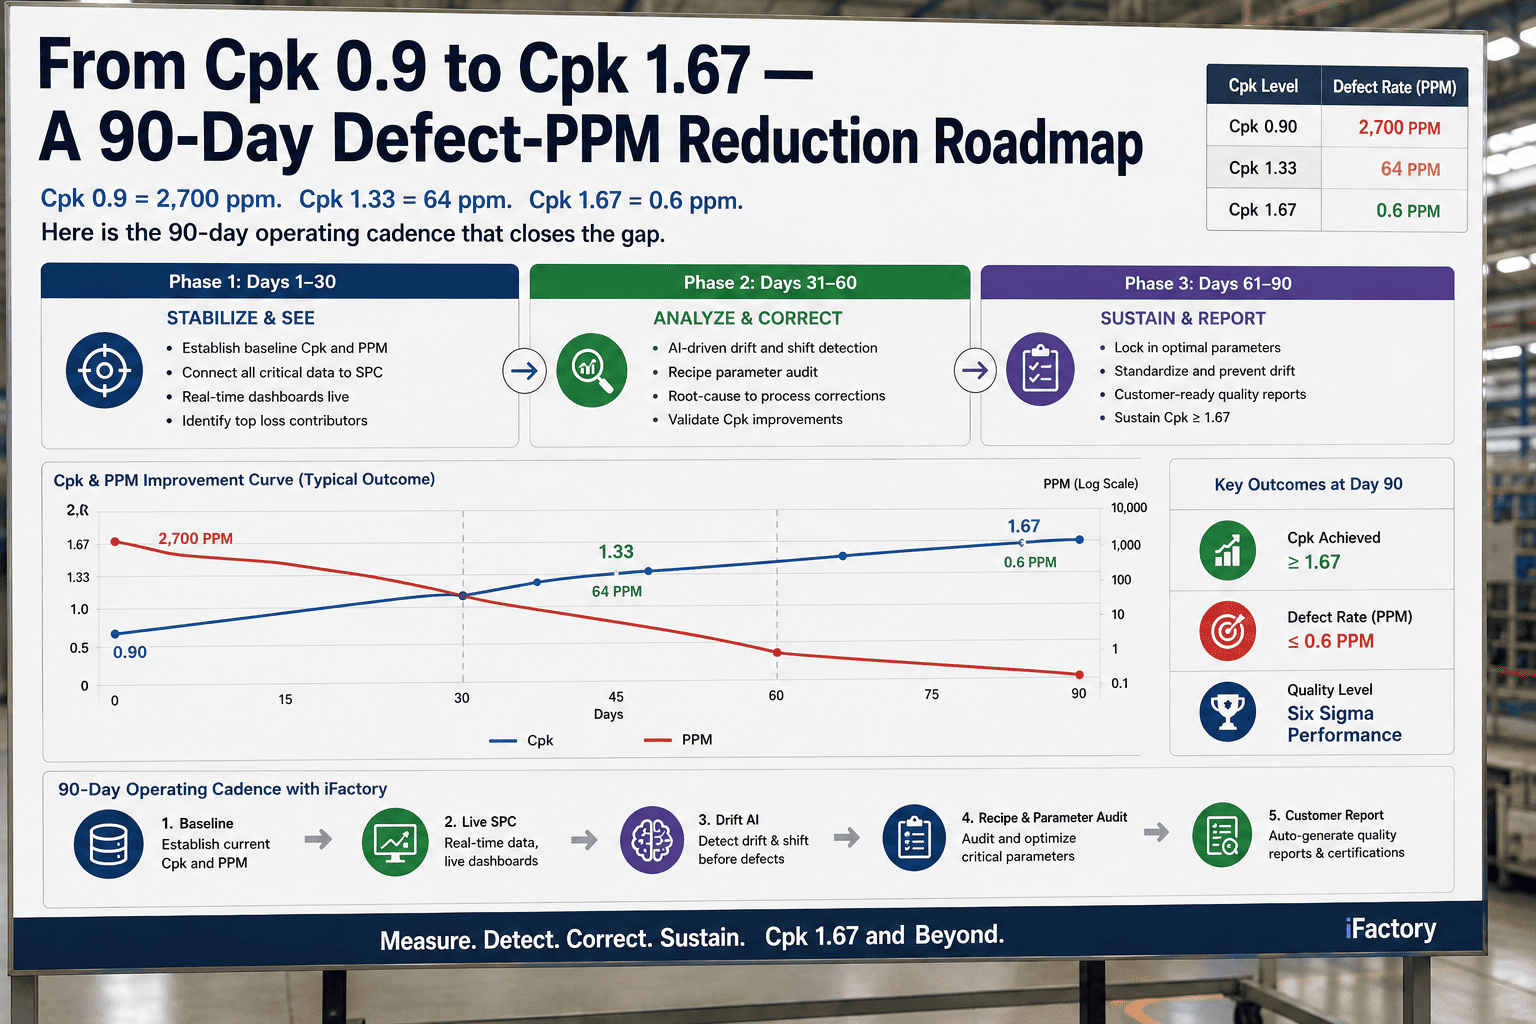
The math of process capability is brutally exponential: at Cpk 0.9 you ship roughly 6,900 defective parts per million; cross 1.0 and it\'s still 2,700; reach 1.33 — the IATF 16949 floor for significant characteristics — and you\'re at 64 ppm; hold 1.67, the safety-critical bar, and defects all but vanish at 0.6 ppm. Half a point of Cpk is a ten-thousand-fold reduction in escapes. Yet most capability programs stall, because Cpk gets reviewed monthly, drift goes unwatched between reviews, and recipes creep one well-meaning tweak at a time. iFactory\'s 90-day Cpk uplift cadence is the operating rhythm that closes the gap: baseline, live SPC, drift AI, recipe parameter audit, and a customer-ready capability report — each phase with owners, day ranges, and exit criteria.
iFactory 90-Day Cpk Uplift Cadence
From Cpk 0.9 to 1.67: a 90-Day Roadmap, Not a Wish
Five phases on one operating cadence — baseline honestly, chart live, catch drift with AI, audit the recipe creep, and ship the customer report — with the ppm math doing the motivating.
~6,900
ppm shipped at Cpk 0.9
64
ppm at Cpk 1.33 — the IATF floor
0.6
ppm at Cpk 1.67 — safety-critical grade
90 days
one cadence, five phases, exit criteria
PPM Is Exponential in Cpk — That\'s the Whole Business Case
Capability indices look like small decimal differences; defect rates don\'t. Each step down this ladder is the same process with less variation and better centering — and orders of magnitude fewer escapes, claims, and sorting bills.
Cpk 1.33
Capable · IATF significant
Cpk 1.67
World-class · safety-critical
Bar lengths compressed for display — the real scale is four orders of magnitude. One caveat the table hides: these figures assume a centered process. A Cpk 1.67 process that drifts 1.5 sigma off center ships ~3.4 ppm — which is why drift, not capability snapshots, is what the cadence hunts.
Why Capability Programs Stall at 1.1
Almost no plant lacks the ambition; what they lack is the rhythm. Cpk computed monthly is a photograph of a moving target, and the gap between reviews is where the gains leak out.
Cpk as a Monthly Photo
A month-end index averages over the very shifts and drifts you need to see — the number looks stable while the process wanders.
Drift Between Reviews
Centering decays continuously — tool wear, material lots, seasons — and uncorrected drift converts good Cpk into bad ppm silently.
Recipe Creep
Eighteen well-meaning parameter tweaks later, nobody can say what the golden recipe was — or which tweak bought variation.
Unverified Kaizens
Improvements get celebrated on launch, not measured on capability — some help, some hurt, and the index can\'t say which.
What was your headline Cpk doing between the last two monthly reviews? Book a demo and look at it live.
The 90 Days, Phase by Phase
The cadence runs five overlapping phases on one timeline. Each has an owner, a day range, and an exit criterion — because a roadmap without exit criteria is a poster.
Phase 1 · Days 0-15
Baseline, Honestly
Measure the real starting Cpk per characteristic from raw data — not the flattering month-end average. Exit: a signed baseline per critical characteristic, gauge capability confirmed.
Phase 2 · Days 10-45
Live SPC On
Every critical characteristic onto live control charts with run rules — variation\'s special causes surfaced and killed one by one. Exit: stable, in-control processes with rolling Cpk on the floor\'s screens.
Phase 3 · Days 30-65
Drift AI Armed
AI models learn each characteristic\'s healthy behavior and flag centering drift before run rules would — the 1.5-sigma killer caught in hours. Exit: drift alerts live with response owners assigned.
Phase 4 · Days 45-80
Recipe Parameter Audit
Every recipe version diffed against the golden state; creep reversed, each parameter justified by capability data, change control locked. Exit: one approved recipe per product, deviations alarmed.
Phase 5 · Days 75-90
The Customer Report
Capability evidence assembled per characteristic — before and after, charts, ppm translation — in the format your customer\'s SQE expects. Exit: a report you\'d be glad to be audited on, generated from the same live data, repeatable every quarter without a single spreadsheet.
Want this cadence mapped onto your worst characteristic? Talk to our CI team with its last 90 days of data.
The Weekly Rhythm Inside the Roadmap
Ninety days is the arc; the week is the heartbeat. The cadence ships with a standing rhythm so capability stops being a monthly agenda item and becomes how the plant runs.
| Cadence | Who | What Happens | Output |
|---|
| Per shift | Line lead | Rolling Cpk and open run-rule hits reviewed at handover | Actions assigned before the next shift inherits the drift |
| Daily | CI lead | Drift-AI alerts triaged; top variation source named | One countermeasure in motion per line, every day |
| Weekly | CI + quality + maintenance | Capability pareto in ppm terms; kaizens verified on the index | Improvements kept or killed on evidence |
| Day 45 & 90 | Plant leadership | Phase exit reviews against criteria; targets re-baselined | The roadmap stays a contract, not a poster |
Run on One Platform, Inside Your Firewall
The cadence isn\'t a consulting binder — it\'s an operating mode of the platform. Baseline, live SPC, drift AI, recipe control, and the customer report all run from the same on-prem system reading your lines.
One Data Spine
Baseline, charts, drift models, and the final report compute from the same live data — no phase hands a spreadsheet to the next.
Drift AI Beyond Run Rules
Models trained per characteristic flag centering decay and variance growth earlier than Western Electric rules alone — hours instead of days.
Recipe Versions, Diffed
Every parameter change is versioned and linked to its capability consequence — creep becomes visible, reversible, and governable.
On-Prem, Read-Only
Pre-configured edge server inside your firewall, inbound-only integration — process data stays in the plant.
What 90 Days Returns
The cadence\'s outputs are concrete: a defensible baseline, in-control processes, drift caught in hours, a governed recipe, and a customer report that writes itself — with the ppm ladder quantifying every step gained.
100x
Fewer escapes per step
order-of-magnitude ppm drops at each Cpk milestone on the ladder
Hours
To catch drift
the 1.5-sigma slide flagged by AI before it converts Cpk into claims
1 recipe
Per product, governed
creep audited out, every parameter justified by capability evidence
Quarterly
Customer report, repeatable
SQE-ready capability evidence from live data — zero spreadsheets
What would 64 ppm instead of 2,700 be worth on your highest-volume part? Talk to our CI team and price the ladder.
Frequently Asked Questions
Is 0.9 to 1.67 in 90 days realistic?
For a single characteristic with real special-cause variation to remove — often yes; killing special causes and correcting centering deliver the early, large gains, and recipe governance locks them in. For processes already stable at 1.2 with pure common-cause variation, 90 days produces the verified roadmap and the first steps, with remaining gains needing process or tooling changes the data will now justify precisely. The cadence is honest about which case you\'re in by Day 15.
Why does drift matter if our Cpk is measured at 1.67?
Because the ppm table assumes a centered process. A 1.67-capable process drifting 1.5 sigma off center ships around 3.4 ppm instead of 0.6 — and bigger drifts do far worse. Snapshots can\'t see the slide; the drift-AI phase exists to catch centering decay in hours, which is the difference between a tweak and a containment.
What does the drift AI add over standard SPC run rules?
Run rules detect defined patterns after enough points accumulate. The drift models learn each characteristic\'s healthy behavior — its noise, its rhythms by shift and lot — and flag departures from that baseline earlier and with fewer false alarms, including slow centering decay that run rules are weakest on. The two run together; the AI is the early-warning layer, the rules are the standard.
How does the recipe parameter audit work in practice?
Every recipe version on the line is collected and diffed against the approved golden state, and each divergence is tested against capability data: did this tweak help, hurt, or do nothing? Unjustified changes are reversed, justified ones are formally adopted, and from then on any deviation from the approved recipe raises an alarm — creep ends because it becomes visible.
What does deployment involve, and where does the data live?
The platform runs on a pre-configured edge server on-premise, inside your firewall, reading gauges, PLCs, and quality systems inbound-only with no external egress. The 90-day cadence typically starts within the first deployment weeks — Phase 1 baselining begins as soon as data flows. Bring your worst characteristic\'s history to a demo and we\'ll baseline it live.
Baseline. Chart. Catch the Drift. Govern the Recipe. Prove It.
Start Your 90-Day Cpk Uplift
Bring your worst characteristic\'s last 90 days and your customer\'s Cpk requirement. We\'ll compute the honest baseline live, show the drift AI on your own data, map the five phases with exit criteria onto your calendar — and generate the Day-90 customer report format on day one. On-prem, inside your firewall.
5 phases
with exit criteria
0.6 ppm
the 1.67 destination
On-prem
inside your firewall