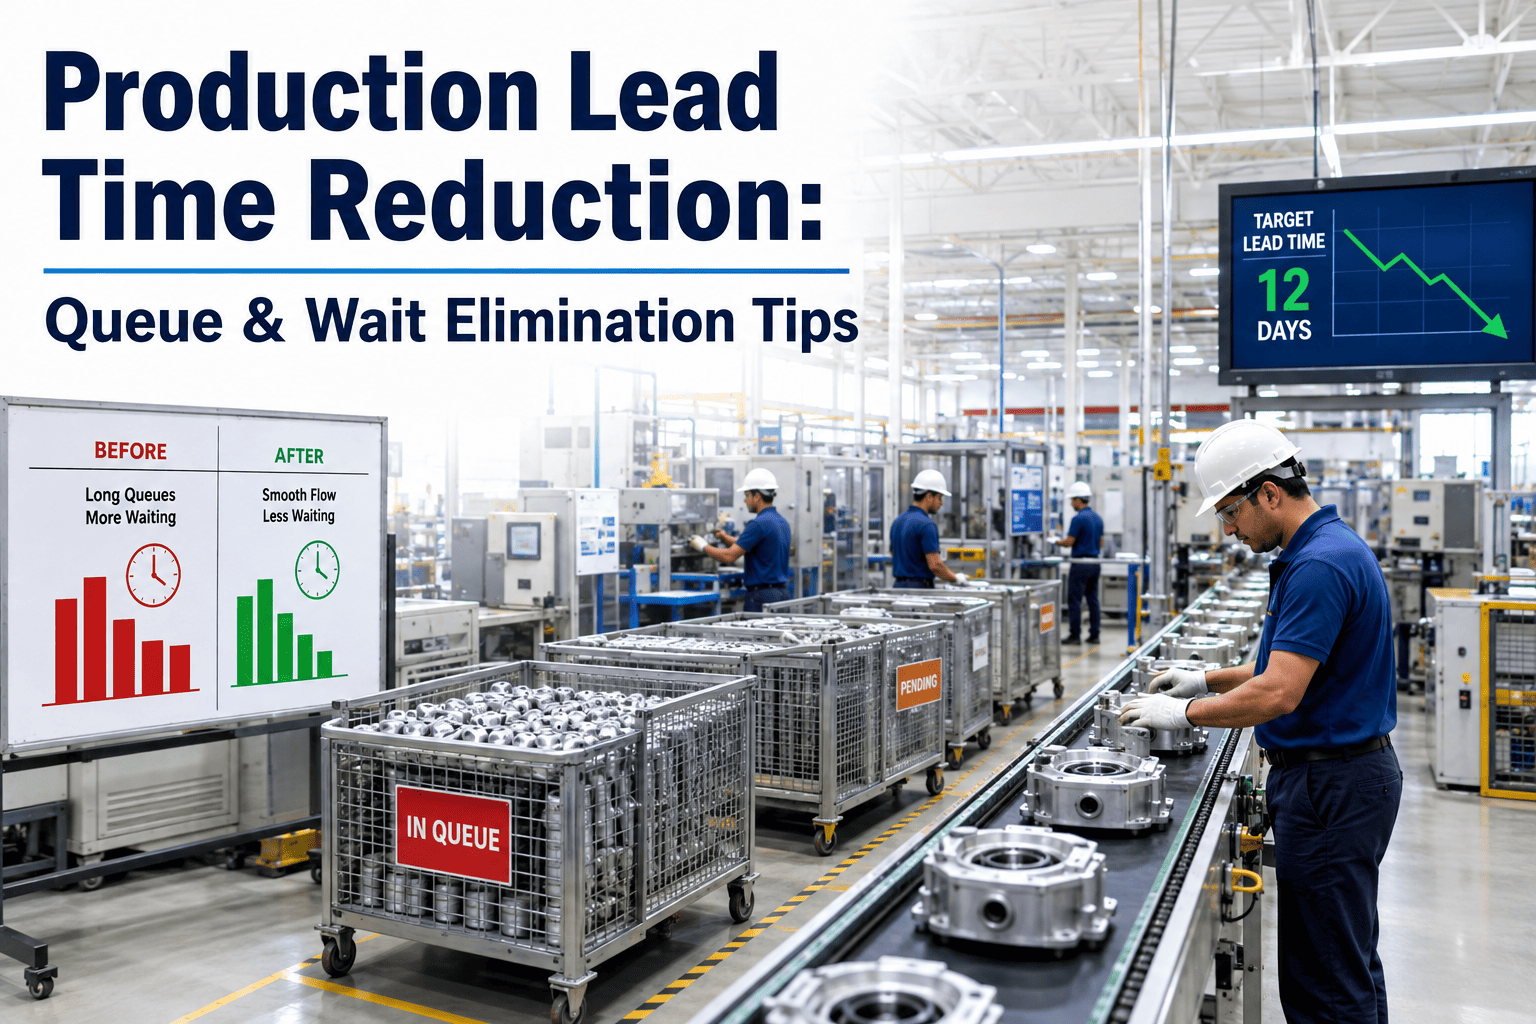
Track a single part through your plant with a stopwatch and you will likely find it spends far more time sitting in a queue waiting for the next station than it does actually being processed, which is the uncomfortable truth behind most manufacturing lead times. Value-added processing time is often a fraction of total lead time, with the rest consumed by queue waits, batch accumulation, and handoffs between departments that nobody has ever mapped end to end. iFactory's AI identifies exactly where that hidden wait time accumulates and quantifies what closing each gap is worth, and you can book a demo to see your own value stream mapped this way.
Your Part Spends More Time Waiting Than It Does Actually Being Made
iFactory's AI traces every part through your process to show exactly where queue time accumulates, then quantifies the throughput and lead time gain available from closing each specific gap.
Queue Time Is the Single Largest Component of Most Manufacturing Lead Times
This pattern holds across discrete manufacturing regardless of industry, because queue accumulation is structural rather than accidental. The figures below reflect what value stream mapping studies typically reveal once a plant actually measures where time goes.
Four Structural Reasons Queue Time Accumulates Between Stations
Understanding why queues form is the precondition for eliminating them, since each cause requires a different fix rather than a single blanket solution applied everywhere.
Batch Size Mismatch
Upstream stations processing in larger batches than downstream stations can consume creates a natural accumulation point where parts sit waiting for the rest of the batch.
Uneven Cycle Times
A faster upstream station feeding a slower downstream one builds a queue by definition, and the imbalance often goes unaddressed because each station looks efficient on its own.
Scheduling Sequence Gaps
Jobs scheduled without visibility into downstream station availability arrive to find the next station still occupied, creating avoidable wait time baked into the plan itself.
Handoff and Transport Delay
Material sitting in a staging area waiting for a scheduled transport run, rather than moving as soon as it is ready, adds wait time that has nothing to do with actual processing capacity.
Find Out Exactly Where Your Lead Time Is Actually Going
iFactory's AI traces real part movement through your process and quantifies the specific dollar and day impact of each queue point. Book a demo and map your own highest-volume value stream.
From Timestamp Data to a Quantified Queue Elimination Plan
iFactory builds a live value stream map from data your MES and tracking systems already generate, rather than requiring a manual time study conducted with a stopwatch and clipboard.
Automated Timestamp Capture
Station entry and exit timestamps are pulled from MES, barcode scans, or RFID data to reconstruct actual part movement through the process automatically.
Queue Point Identification
The AI calculates queue time at every station transition and ranks each queue point by total accumulated wait time across the analyzed period.
Root Cause Classification
Each significant queue is classified against known causes, batch mismatch, cycle time imbalance, scheduling gap, or transport delay, with a quantified reduction opportunity.
Prioritized Action Plan
Queue elimination opportunities are ranked by lead time impact and implementation effort, giving operations leaders a clear starting point rather than a list of everything at once.
Manual Value Stream Mapping vs AI-Automated Lead Time Analysis
The comparison below reflects the practical difference between a traditional manual value stream mapping exercise and continuous, AI-driven lead time analysis.
| Factor | Manual Value Stream Mapping | iFactory AI Lead Time Analysis |
|---|---|---|
| Time to Complete | 6 to 10 weeks for a full process | Days, using existing timestamp data |
| Data Basis | Sample observation over a limited window | Full historical dataset across all orders |
| Update Frequency | Static snapshot, rarely repeated | Continuously refreshed as new data arrives |
| Root Cause Detail | General observation-based categorization | Quantified classification per queue point |
Lead Time Outcomes From AI-Driven Queue Elimination Programs
These figures reflect measured outcomes at facilities that used iFactory's AI lead time analysis to prioritize and execute queue elimination initiatives over a minimum six-month period.
Running Your First Queue Elimination Cycle
iFactory's approach focuses on the single highest-impact queue point first, building a credible case for further investment before expanding across the full process.
Connect Timestamp Data
MES, barcode, or RFID timestamp data across the target value stream is connected to build the automated lead time map.
Rank Queue Points
The AI ranks every identified queue point by total accumulated wait time and estimated reduction opportunity.
Address the Top Queue Point
The highest-impact queue is addressed first, whether through batch sizing, scheduling logic, or transport frequency changes.
Expand to the Full Process
Results from the first cycle build the case to extend queue elimination efforts across the remaining value stream.
Frequently Asked Questions About Lead Time and Queue Reduction
Stop Guessing Where Your Lead Time Is Going
iFactory's AI maps your real value stream, ranks every queue point by impact, and gives your team a prioritized plan to shorten lead time without new capital. Book a demo and see it applied to your own process.