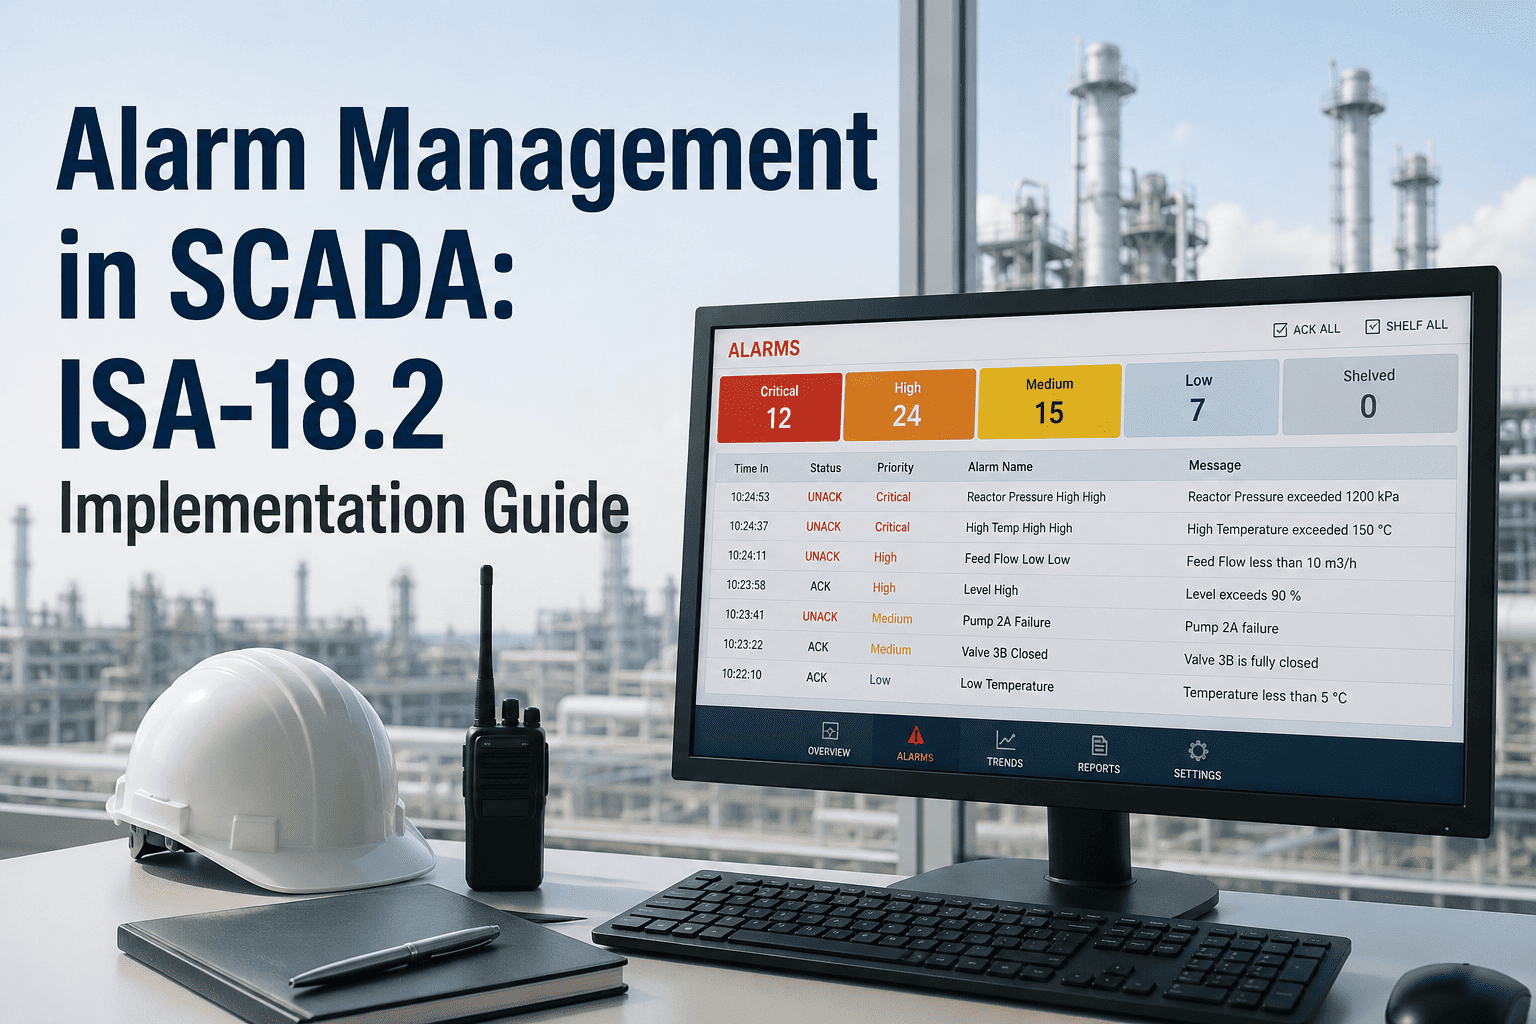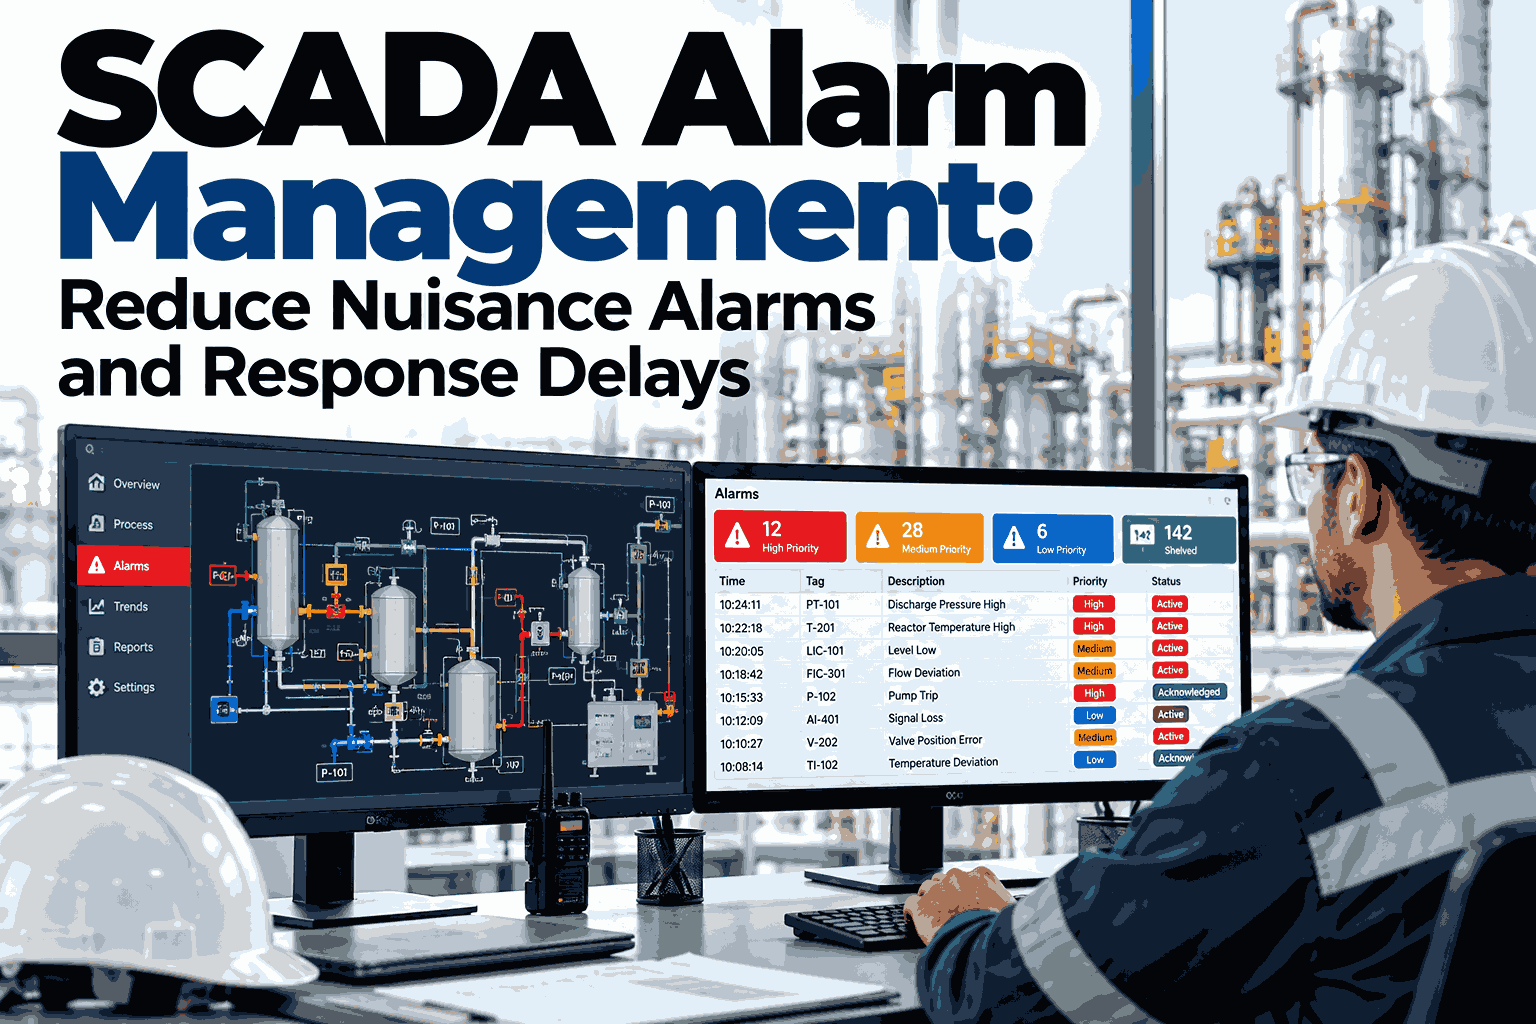
Most SCADA operators don't have an alarm problem, they have a noise problem. When hundreds of alerts scroll past every shift, the one alarm that signals a real process upset looks identical to the fifty that don't. Response delays follow, and so do missed excursions, quality escapes and unplanned stops. This checklist walks manufacturing teams through the steps that actually reduce nuisance alarms, from baselining to rationalization and ongoing governance, and you can see it applied to your own alarm log in a short working session.
SCADA ALARM MANAGEMENT CHECKLIST
Cut Nuisance Alarms. Shorten Response Time. Keep Operators Trusting the Screen.
A practical, step-by-step checklist built around how iFactory AI helps manufacturing plants clean up alarm floods and surface the events that need action first.
WHERE YOU STAND
What a Healthy Alarm System Looks Like
Industry guidance such as ISA-18.2 and EEMUA 191 treats roughly one alarm per operator every ten minutes as a manageable average. Many plants run far above it.
Figures are illustrative planning ranges. Your own baseline matters more than any benchmark.
PHASE 1
Baseline Audit Checklist
You cannot reduce what you have not measured. Start by pulling at least 30 days of alarm history from every SCADA node.
Export 30 to 90 days of alarm and event logs
Include acknowledgements, shelving, suppression and return-to-normal timestamps.
Count alarms per operator, per hour, per shift
Averages hide peaks, so chart the busiest ten-minute windows too.
Rank the top 10 bad actors
A handful of tags usually generate a large share of total volume.
Flag chattering and stale alarms
Repeats within seconds and alarms active for days are cleanup candidates.
Measure acknowledgement and response delay
Time from alarm to action is the metric that links alarms to downtime.
PHASE 2
The Rationalization Loop
Every alarm should earn its place by answering one question: what should the operator do about it?
1
Justify
Does the alarm require operator action?
2
Prioritize
Rank by consequence and time to respond.
3
Tune
Set limits, deadbands and delays from real data.
4
Document
Record cause, consequence and response.
5
Review
Re-measure and repeat each quarter.
Want to see your top bad actors ranked in minutes?
iFactory AI can analyze a sample of your alarm history and show which alarms are noise and which deserve a faster response.
PHASE 3
Fixes That Remove Nuisance Alarms
Match the fix to the symptom. Most noise comes from a short list of causes.
| Symptom | Likely Cause | Typical Fix |
|---|---|---|
| Alarm repeats every few seconds | Signal noise near the limit | Add a deadband or on-delay |
| Dozens of alarms after one trip | Cascading symptoms | State-based suppression and grouping |
| Alarm active for days | Abnormal but accepted condition | Fix the condition or retire the alarm |
| Alarms during startup or changeover | Static limits for all modes | Mode-dependent limits |
| Operators acknowledge without acting | No clear response defined | Remove it or document the action |
PHASE 4
KPIs to Track Every Month
Good alarm management is measured, not assumed. These targets give your team a shared scoreboard.
1 / 10 min
Average alarms per operator
Under 5
Stale alarms active at any time
Top 10
Bad actors reviewed weekly
Minutes
Median time to acknowledge and act
SELF SCORE
Rate Your Alarm Maturity
Count how many checklist items above your plant has completed.
0 to 3 items
Reactive
Alarms are added freely and rarely reviewed.
4 to 7 items
Managed
Bad actors are tracked and tuned regularly.
8 to 10 items
Optimized
Governance, KPIs and analytics run continuously.
90 DAY PLAN
How iFactory AI Supports the Rollout
iFactory connects to your existing SCADA data and adds analytics on top, without a controls replacement project.
Days 1 to 30
Baseline
Connect data sources, ingest history and publish the first bad actor report.
Days 31 to 60
Rationalize
Review alarms with operators, group related events and tune limits.
Days 61 to 90
Govern
Launch KPI dashboards, change control and a quarterly review cycle.
FAQS
Alarm Management Questions Answered
How many alarms per day is too many?
Guidance such as EEMUA 191 treats about one alarm per ten minutes per operator as manageable. Consistently running several times above that, or seeing bursts of ten or more in ten minutes, signals overload. A review of your own logs gives the clearest answer. Schedule a walkthrough to compare your numbers.
Do we need to replace our SCADA system?
No. Alarm analytics work from the event data your current system already records. The effort goes into analysis and tuning rather than new controls hardware. Your existing operator screens stay familiar to the team. Ask our support team about your platform.
Is it safe to suppress or remove alarms?
It is safe when done through a documented rationalization process with operations and safety input. Safety-critical alarms are never removed to cut volume. Each change should be reviewed, recorded and re-measured afterwards. Discuss your change process with our team.
How quickly will we see fewer nuisance alarms?
Removing chattering and stale alarms often shows a visible drop within the first weeks, because a few bad actors drive most of the volume. Deeper gains from prioritization and grouping build over the following months. Tracking the KPIs above keeps progress visible. Reach out to support for a realistic timeline.
Who should own alarm management?
Treat it as a shared responsibility between operations, engineering, maintenance and safety, with one named owner for the process. Regular reviews stop alarm counts from creeping back up. A monthly report keeps everyone aligned. Plan your governance model with an iFactory specialist.
Give Operators a Screen They Can Trust
Book a session with iFactory AI and turn your alarm history into a clear, prioritized action plan.