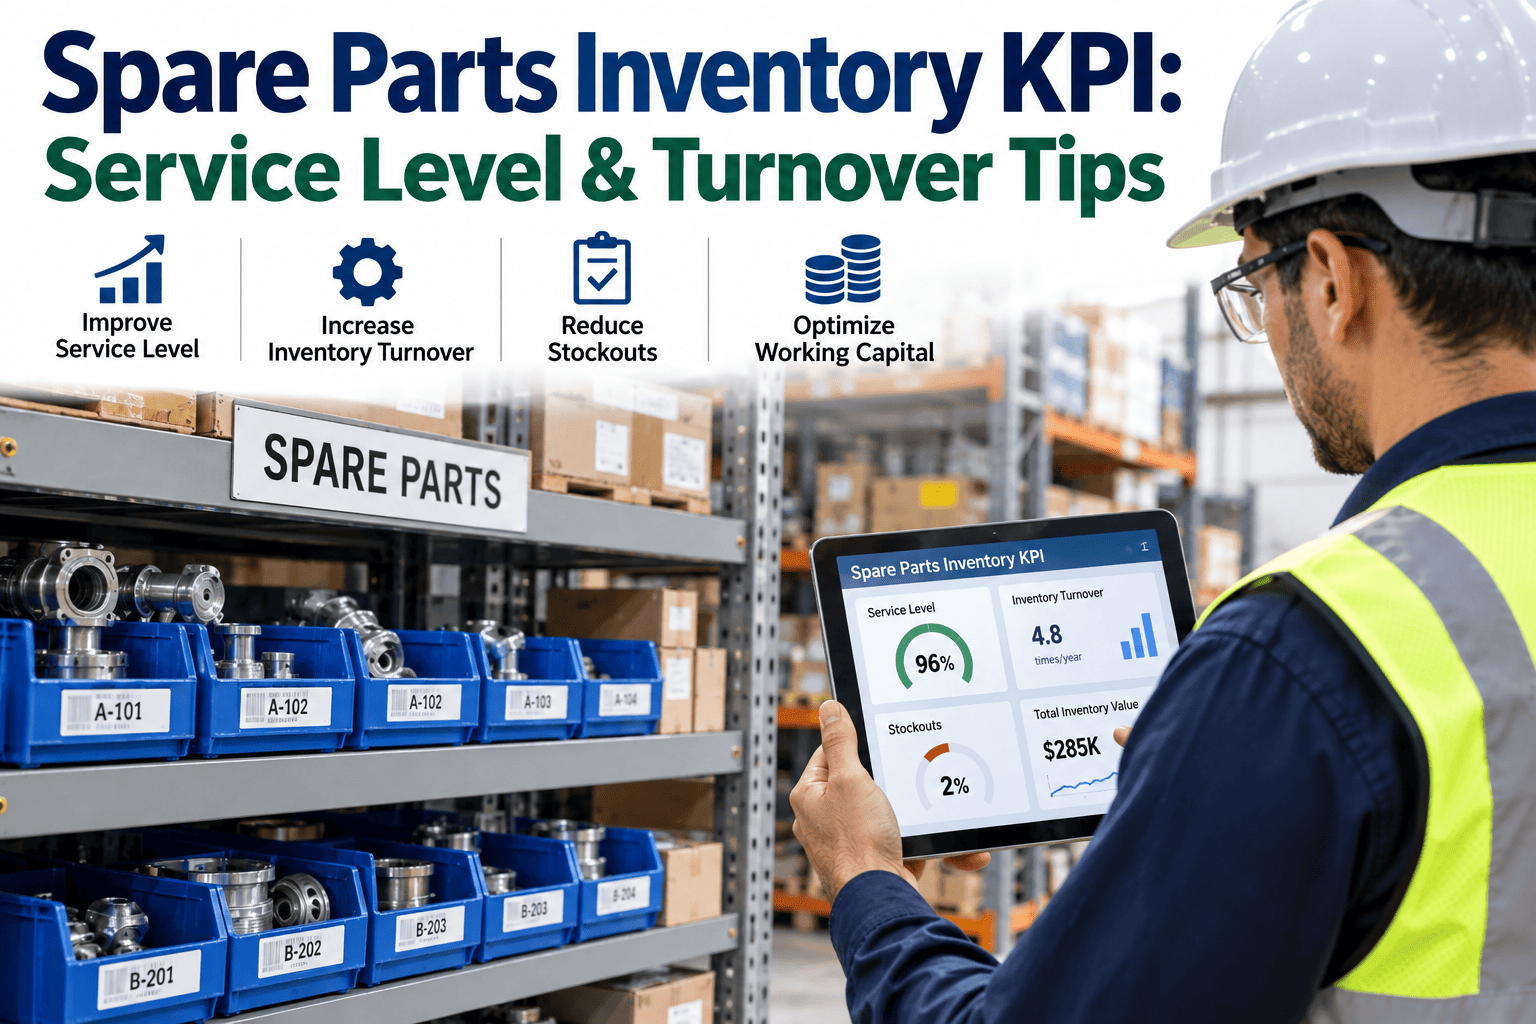
Ask a warehouse manager whether high inventory turnover is good, and the answer is almost always yes. Ask a maintenance manager the same question about critical spares, and the correct answer is often no — a main drive motor that turns over every few months means it keeps failing, not that inventory is being managed well. This is the single most common mistake in spare parts KPI programs: importing retail inventory logic wholesale into a storeroom where the goal for insurance spares is deliberately low turnover, while the goal for consumables is deliberately high turnover, and treating both categories with one blended target produces a scorecard that looks fine while masking real risk. Service level, stockout frequency, and turnover only mean something once they are measured by criticality tier, not as a single storeroom-wide average. If you want to see how your own spare parts KPIs break down by criticality, book a demo with iFactory's team.
MAINTENANCE KPI · SPARE PARTS · MRO INVENTORY
A Single Turnover Number Hides More Than It Reveals — Here's What to Track Instead
iFactory tracks service level, stockout frequency, and turnover by criticality tier, so your spare parts scorecard reflects the actual difference between a filter that should turn over four times a year and a spindle motor that shouldn't turn over at all.
95–97%
Typical service level target for a well-managed storeroom overall
32%
Operations leaders reporting frequent stockouts of critical spare parts
20–30%
Typical annual carrying cost as a share of total inventory value
1.0–1.5
Healthy blended MRO turnover ratio for an aggregate storeroom
THE TURNOVER INVERSION
Why "Higher Turnover Is Better" Is Wrong for Half Your Storeroom
Inventory turnover measures how many times a part's stock is consumed and replaced over a year. In retail, higher is almost always better — it means less capital tied up on the shelf. In a maintenance storeroom, that logic only holds for consumables. A critical insurance spare, kept specifically to prevent extended downtime if a low-probability failure occurs, is supposed to sit on the shelf unused for years. A high turnover rate on that category is not efficiency — it is a sign that the underlying equipment is failing far more often than it should. Reading both categories against one blended target is how a storeroom ends up simultaneously overstocked on dead consumables and understocked on the critical spares that actually prevent downtime.
CONSUMABLES
3.0–4.0+ turns/yr
Filters, lubricants, gaskets, fasteners
Goal: high turns, minimal working capital tied up
Low turnover here signals bloated stockpiles
GENERAL SPARES
1.0–2.0 turns/yr
Bearings, standard motors, common couplings
Goal: balanced availability against carrying cost
Wide acceptable range depending on lead time
CRITICAL SPARES
< 0.5 turns/yr
Main drives, custom gearboxes, PLC cards
Goal: near-zero turns, held as insurance
High turnover here signals a reliability problem
See Your Own Turnover Broken Down by Criticality Tier
iFactory classifies spare parts automatically and tracks turnover, service level, and stockout frequency against the right target for each tier — not one blended number.
THE CORE KPI SET
Six Metrics That Actually Tell You How Your Storeroom Is Performing
Spare parts inventory has dozens of possible metrics, but six form the core scorecard most maintenance-mature organizations track together, because each one checks a different failure mode the others miss on their own.
Service Level (Fill Rate)
Target: 95–97% overall, 99%+ for critical items
The percentage of parts requests fulfilled immediately from existing stock. This is the headline availability number, but it needs to be read separately for critical versus routine parts.
Stockout Frequency
Target: under 2% for critical parts
How often a needed part is unavailable when a work order calls for it. This is the leading indicator that predicts the emergency purchases and downtime a lagging financial report will show later.
Inventory Turnover
Target: varies sharply by criticality tier
Value of parts issued divided by average inventory value on hand. Meaningless as a single storeroom-wide figure; essential when segmented by ABC/VED classification.
Carrying Cost Percentage
Target: 20–30% of inventory value annually
The annual cost of holding inventory — capital, storage, insurance, obsolescence risk — expressed as a share of total inventory value. This is the counterweight that keeps service-level improvements honest.
Emergency Order Percentage
Target: under 5% of total purchase orders
The share of parts purchases made on a rush basis instead of through planned procurement. Emergency orders typically carry a significant price premium over the same part sourced normally.
Obsolescence Rate
Target: under 10% of total inventory value
The share of stocked value tied to parts for decommissioned equipment or items with no usage in the past 12 to 24 months. This is where dead capital hides in plain sight on the storeroom shelf.
CLASSIFYING BEFORE YOU MEASURE
ABC and VED: The Two Filters That Make These KPIs Meaningful
Before any of the six KPIs above can be interpreted correctly, every part needs to be classified along two independent dimensions. ABC analysis sorts parts by financial value — which SKUs consume the most spend regardless of how often they are used. VED analysis sorts parts by operational criticality — what actually happens to production if the part is unavailable when needed. Combining both into a single matrix is what tells a storeroom manager not just what to stock, but how tightly to control it.
WHERE THE PROBLEM ACTUALLY HIDES
The Storeroom That Looks Fine on Paper
Combining service level, turnover, and criticality reveals a pattern that a single average number always conceals: a storeroom can hit a healthy blended service level while systematically failing on exactly the parts that matter most, because the volume of routine parts requests drowns out the smaller number of critical stockouts in the average.
Healthy Average, Hidden Critical Gap
A 96% overall fill rate can coexist with a 70% fill rate on the dozen SKUs that actually cause extended downtime, because thousands of routine requests dilute the average.
Dead Stock Funding Nothing
Parts with no usage in 24 months, often for equipment already decommissioned, sit on the books as inventory value while contributing nothing to actual availability.
Misclassified Critical Parts
A significant share of stockouts occur specifically on parts that were classified as non-critical and therefore never got a reorder point set, until the moment they were needed.
Emergency Premium as a Recurring Cost
Every stockout on a genuinely critical part converts a planned purchase into a rush order at a markup, and that premium repeats every time the same classification gap causes the same late discovery.
FREQUENTLY ASKED QUESTIONS
Questions Maintenance Managers Ask About Spare Parts KPIs
Is it true that most unplanned downtime is caused by parts stockouts?
This specific figure is widely repeated but does not trace back to a locatable primary study, so it should be treated with caution rather than cited as an established fact. What is well documented is that a meaningful share of operations leaders report frequent stockouts specifically on critical spares, which is a more precise and better-sourced way to frame the risk.
Book a demo to see how stockout risk breaks down for your own equipment.
Should every part in our storeroom have a reorder point set?
Not necessarily — low-criticality, low-value parts classified as desirable are often better managed with lean or zero stock and on-demand ordering, since the cost of holding them exceeds the risk of a short delay. Reorder points matter most for vital and essential parts, where a stockout has real production consequences.
Contact support to discuss reorder policy by classification tier.
What inventory turnover ratio should we be targeting for our storeroom overall?
A blended aggregate turnover of roughly 1.0 to 1.5 is typical for a healthy MRO storeroom, but this figure only makes sense as a sanity check — the meaningful targets are by category, with consumables turning several times a year and true critical insurance spares turning well under once a year. Chasing a higher blended number by depleting critical stock is how service levels quietly erode.
How often should ABC/VED classification be reviewed once it's set up?
Consumption patterns, equipment age, and production mix all shift over time, so classification set once and never revisited tends to drift out of date, particularly as equipment is decommissioned or replaced. A parts list reviewed only every few years is a common source of the dead-stock and misclassified-critical-part problems this KPI set is designed to catch.
Book a demo to see how classification stays current automatically.
Does tracking these KPIs by criticality tier require a lot of manual setup work?
The classification itself requires an initial pass to score parts by value and criticality, but ongoing tracking does not need to be manual — consumption data, work order history, and reorder triggers can be captured automatically once classification is in place, keeping the scorecard current without repeated manual review.
Contact support to discuss setup for your parts catalog.
Stop Reading Spare Parts Performance From a Single Blended Number
iFactory tracks service level, stockout frequency, and turnover by criticality tier, so your scorecard shows exactly where availability is at risk before a stockout does.