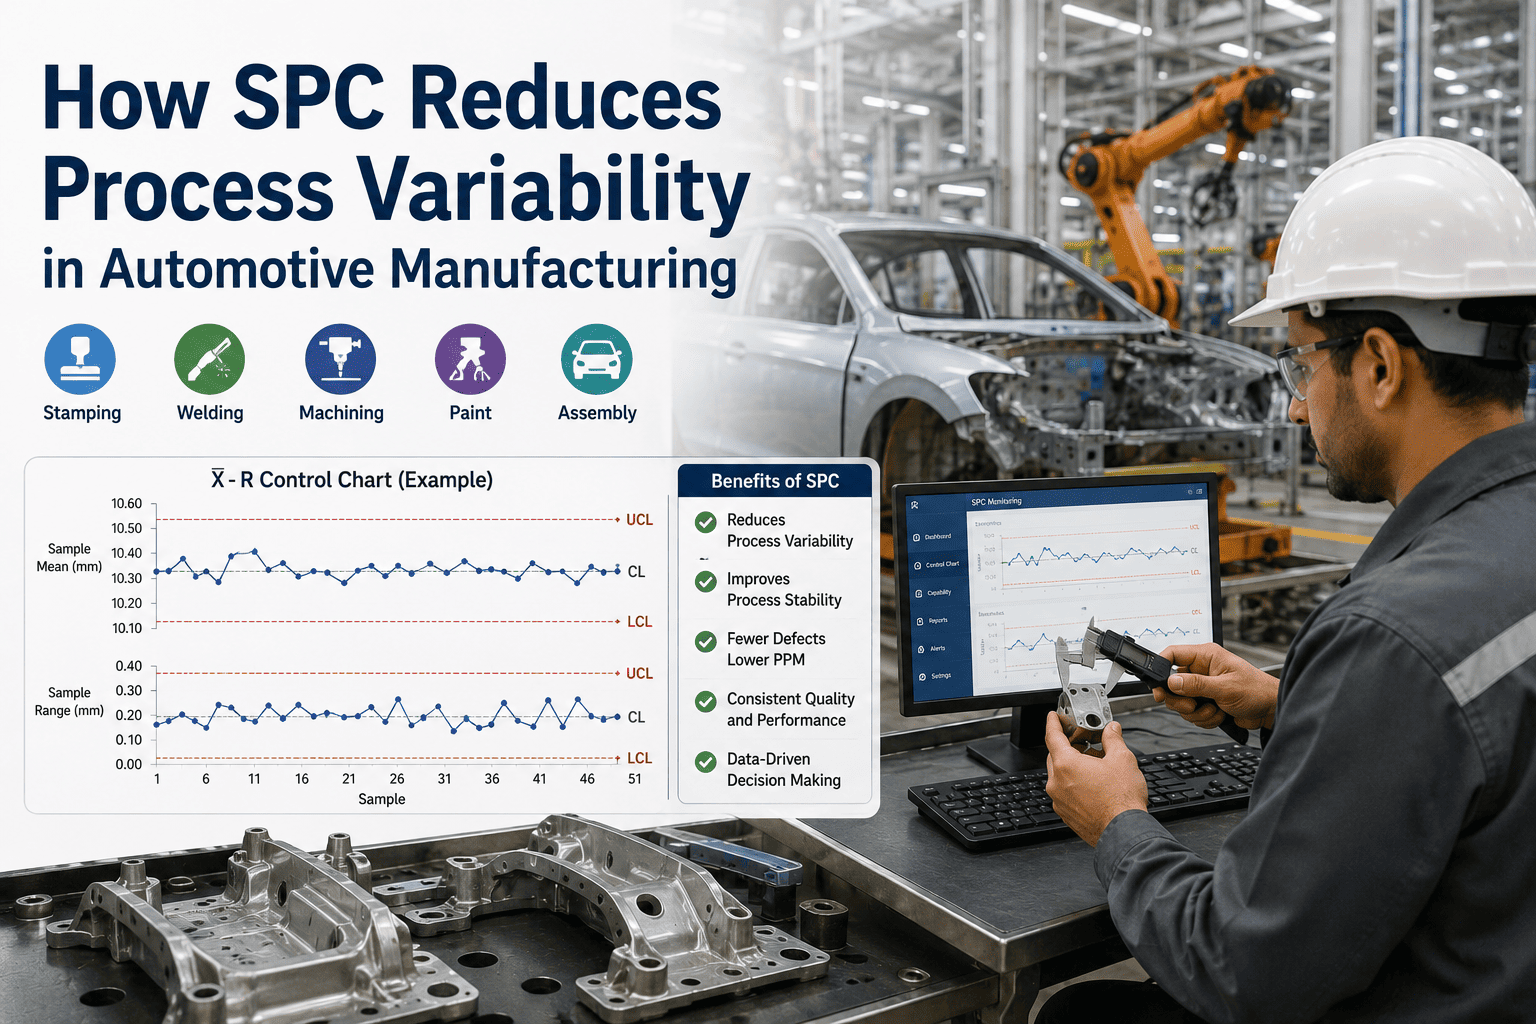
How SPC Reduces Process Variability in Automotive Manufacturing
By Jackson T on June 16, 2026
Every PPM-level reject in an automotive plant traces back to one thing: variation. A stamping that drifts a few microns, a weld whose heat input wanders, a machined bore that creeps as a tool wears — none of these is a dramatic failure, and that's exactly why they're dangerous. They sit inside tolerance until the day they don't, and at automotive volumes a process that's merely "in spec on average" still ships defects by the thousand per million. The discipline that attacks this is Statistical Process Control, and its core insight is almost a century old: most variation is built into the process and reacting to it makes things worse, while a smaller share comes from assignable causes you can actually hunt down. The failure of management to understand that difference, as Deming put it, is the central problem in quality. iFactory's SPC engine charts every critical characteristic live from gauge and PLC data — separating common from special cause and catching drift before it becomes a reject — on a turnkey on-premise NVIDIA stack inside your firewall.
iFactory SPC Engine · Automotive
Narrow the Variation Behind Every PPM Reject.
Live control charts and capability indices across stamping, welding, machining, paint, and assembly — separating common-cause noise from special-cause signal, catching tool wear and drift before they breach spec. On a turnkey on-premise NVIDIA stack inside your firewall.
The whole of SPC rests on a single distinction. Common-cause variation is the inherent noise of a stable process — minor swings in material, machine, and environment that are always present. Special-cause variation is a signal that something changed: a worn component, a bad batch, a wrong setting. The response strategies are opposite, and confusing them is how plants make quality worse. Reacting to common-cause noise as if it were a signal — adjusting a centered process because one part ran high — is over-adjustment, and it adds variation rather than removing it.
Common cause
Inherent, always present
Material lot-to-lot micro-variation
Machine vibration, normal play
Ambient temperature swing
Response: improve the process or tighten inputs — never react part-to-part
Special cause
Assignable, something changed
Tool wear trending out
Contaminated or wrong material
Incorrect setting or fixture slip
Response: investigate and correct the specific cause immediately
Deming's first principle: the central problem in lack of quality is the failure of management to understand variation. React only to assignable cause; leave a stable process alone. The SPC engine makes the distinction automatically, so operators stop chasing noise.
The Control Chart Is the Instrument
A control chart plots a characteristic over time against statistically derived control limits — and the key point automotive teams miss is that control limits are not specification limits. Spec limits come from the drawing; control limits come from the process itself. A point inside the control band is common cause and you leave it; a point outside, or a non-random pattern like seven rising points, is a special-cause signal to investigate. The chart below shows a process drifting toward its upper limit — the classic signature of tool wear — caught before any part breaches spec.
Control limits (UCL / LCL) — from the process
Center line — process mean
Measured subgroup means
Seven consecutive rising points is a special-cause signal — a systematic drift, usually tool wear — flagged here while every reading is still inside spec. Catch it now and you change the tool; miss it and the next subgroup ships rejects.
Control Is Not Capability
A process can be perfectly stable and still make bad parts. Control means the process is consistent and predictable; capability means that consistent output actually fits inside the tolerance. The two are different concepts, and capability is measured by Cpk — how well the process centers within the spec band relative to its spread. Automotive sets the bar high: a Cpk of 1.0 barely fits and still leaks about 2,700 PPM, which is why the industry-standard minimum is 1.33 and critical characteristics often demand more.
Cpk
Approx. PPM
Automotive read
1.00
~2,700
Barely fits — not acceptable for most characteristics
1.33
~63
Industry-standard minimum capability
1.67
~0.6
Often required on safety-critical features
2.00
~0.002
Six Sigma capability target
Need to know your real Cpk per characteristic? Get a turnkey AI quote and we'll compute live capability on your critical features in the pilot.
Variability Has a Different Face in Each Shop
SPC is one method, but the variation it hunts looks different at every station in the plant. The engine charts the right characteristic and the right signal for each, so a stamping press and an assembly torque gun are both watched in the terms that matter to them.
Stamping
Dimensional drift, springback, and thinning. Watch panel dimensions and die wear; the signal is a slow trend, not a jump.
Welding
Heat input, current, and weld-nugget consistency. Variation shows as wandering energy and electrode wear across thousands of spots.
Machining
Bore and feature dimensions on X̄-R charts — subgroups of five every 25 to 50 parts catch tool wear and thermal drift early.
Paint
Film thickness, color match, and defect rate. Variation in booth and cure conditions drives appearance rejects and rework.
Assembly
Torque, fit, and gap. Fastener torque distributions and gap-and-flush measures reveal fixture and operator variation.
Across all five
One engine, one statistical language — so capability rolls up consistently from a single weld to a whole vehicle.
The Trap: Don't React to Noise
The most expensive SPC mistake isn't missing a signal — it's manufacturing one. When an operator adjusts a stable, centered process because a single part ran a little high, they're treating common-cause noise as if it were special cause, and the correction injects variation the process didn't have. Deming demonstrated this with the funnel experiment: chasing every deviation makes the spread worse. The engine's job is to hold the line — alert only on real signals, and explicitly tell the operator when a reading is just noise to leave alone.
Over-adjustment
Tweaking a centered process part-to-part. Each "correction" responds to noise and widens the distribution — variation goes up, capability goes down.
SPC discipline
Leave a stable process alone; act only on a true out-of-control signal. Variation stays at its natural minimum and capability holds or climbs.
Ask the Copilot
The SPC engine answers plain language too — for the quality engineer deciding whether a reading is signal or noise without misreading the chart.
Plant Copilot — SPC Engine
Quality Engineer
Op 40 bore just measured near the top of the range. Do I adjust the offset?
Copilot
Not on that single point — it's inside the control limits, so it reads as common cause. But don't dismiss it either: the last seven subgroups on Op 40 are trending up steadily, which is a special-cause signal even though no point has breached a limit yet. That pattern on a bore is almost always tool wear. The recommendation isn't an offset tweak — it's a tool change. Current Cpk on this feature has slipped from 1.52 to 1.34 over those seven subgroups, still above the 1.33 floor but heading for it.
Quality Engineer
If I do nothing, when do I start making bad parts?
Copilot
At the current drift rate, the projected mean crosses the upper spec limit in roughly three to four more subgroups — so within the next 75 to 200 parts you'd expect the first out-of-spec bore. Changing the tool now resets the mean to center and pulls Cpk back above 1.5. I've staged the tool-change work order and tagged the trend chart to it. Adjusting the offset instead would just mask the wear for a few parts and then drift again.
Turnkey: Hardware, Software, Live in 6-12 Weeks
iFactory ships a pre-configured NVIDIA AI server — racked, software pre-loaded. Rack it, plug in power and Ethernet, and the SPC engine is live inside your firewall. The engagement covers gauge, PLC, and CMM integration, characteristic and subgroup setup, control-limit and capability configuration, Western Electric rule tuning, engineer training, and 24×7 remote monitoring. Your existing gauging and control systems are inputs, not migration targets.
Phase 1 · Weeks 1-4
Ship & Connect
Edge server on-prem; gauges, PLCs, and CMMs connected. Critical characteristics and subgroup plans defined per station.
Phase 2 · Weeks 5-8
Baseline & Pilot
Control limits established from stable runs; capability baselined; rules tuned on a pilot line to alert on signal, not noise.
Phase 3 · Weeks 9-12
Roll Out & Go Live
Live charts and Cpk across shops, drift alerts and CAPA links, engineer training, 24×7 monitoring at 99.9% uptime.
1000+
clients running iFactory
99.9%
platform uptime
6-12 wks
to live operation
On-prem
inside your firewall
What the Quality Team Gets
Common cause separated from special cause automatically, drift caught before it breaches spec, live capability per characteristic, and an end to the over-adjustment that quietly widens every distribution on the floor.
Signal
Not noise
alerts only on true assignable cause
Early
Drift caught
tool wear flagged before spec breach
Live Cpk
Per characteristic
capability tracked, not quarterly-audited
Air-gapped
On-prem deployment
measurement data stays in your firewall
Frequently Asked Questions
What's the difference between common and special cause variation?
Common cause is the inherent noise of a stable process — small, ever-present swings in material, machine, and environment. Special cause is a signal that something specific changed, like tool wear or a bad batch. They demand opposite responses: common cause needs process improvement, special cause needs immediate investigation. Treating one as the other is the most common SPC error.
Are control limits the same as specification limits?
No, and conflating them causes real damage. Specification limits come from the engineering drawing and define what's acceptable to the customer. Control limits are calculated from the process's own variation and define what's normal for it. A process can run inside its control limits yet still be incapable of meeting spec — which is why control and capability are measured separately.
Why is 1.33 the automotive Cpk minimum?
Because of the PPM math. A Cpk of 1.0 means the process just barely fits the tolerance and still produces about 2,700 defects per million. At automotive volumes that's unacceptable, so 1.33 — roughly 63 PPM — is the standard minimum, with safety-critical characteristics often requiring 1.67 or higher. Capability targets are set by the defect rate the part can tolerate.
Can reacting to a chart actually make variation worse?
Yes. Adjusting a stable, centered process in response to normal common-cause noise — over-adjustment, or tampering — injects variation the process didn't have. Deming's funnel experiment showed that chasing every deviation widens the distribution. Good SPC explicitly tells operators when a reading is just noise to leave alone, and alerts only on genuine out-of-control signals.
Where does our measurement data live?
Entirely on-premise inside your firewall on the pre-configured NVIDIA server — read-only and inbound-only to your gauges and control systems. Charts, limits, and capability data never leave the plant, with 24×7 remote monitoring and 99.9% uptime. The deployment can be fully air-gapped where required.
Common vs Special Cause. Live Cpk. Drift Caught Early. On-Prem.
See Your Variation Separated From Your Noise
Bring one line and a few critical characteristics. We'll chart them live, set control limits from your real process, compute capability per feature, flag the tool-wear drift your spec checks miss, and show the over-adjustment trap in your own data — then scope the 6-to-12-week turnkey deployment, on-prem, inside your firewall.