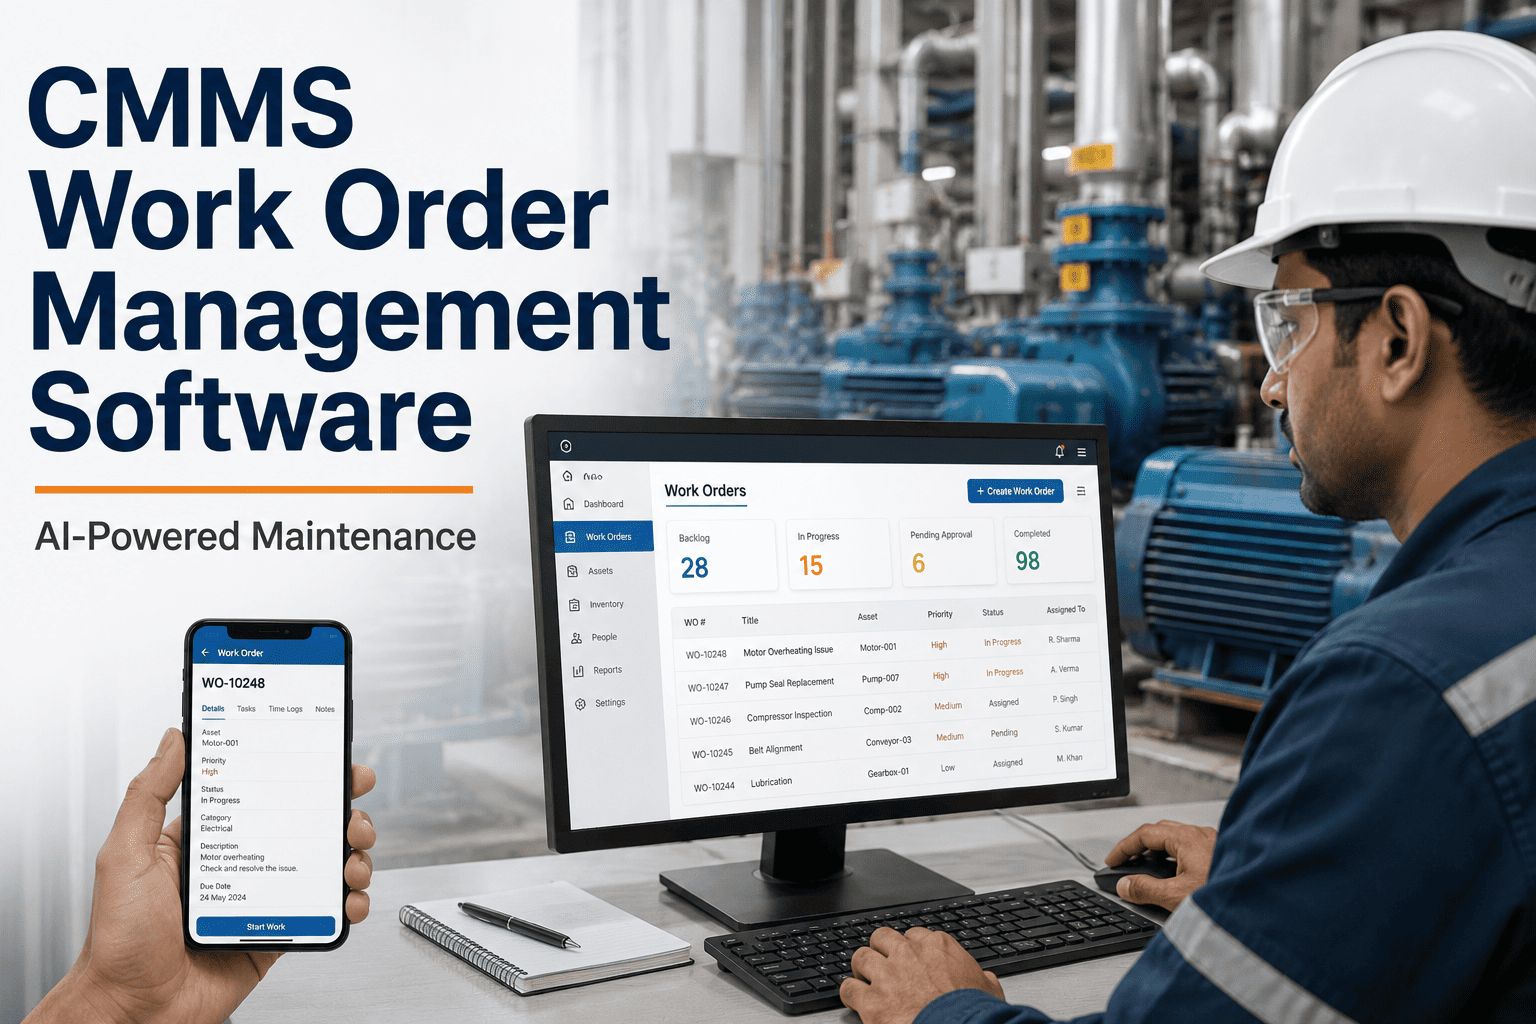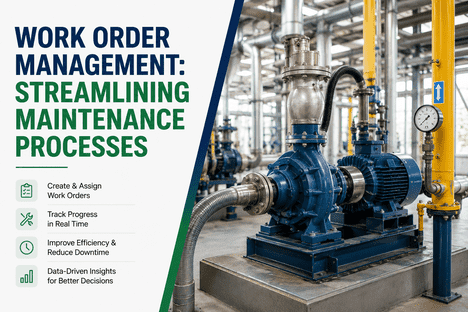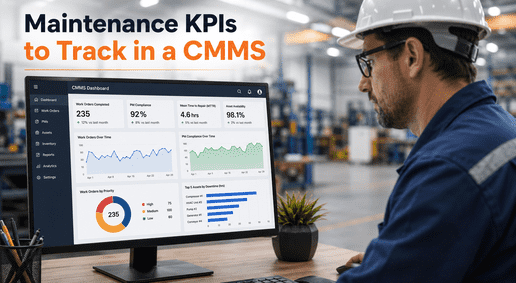
Maintenance KPIs are the operational language that separates a maintenance organization running on intuition from one running on intelligence. In 2026, the CMMS platforms that deliver measurable operational outcomes are not the ones with the longest feature lists — they are the ones where the right KPIs are tracked automatically from live IoT sensor data and work order records, surfaced in role-appropriate dashboard views, and connected to AI predictive models that shift the KPI conversation from what happened to what will happen. The most important maintenance KPIs to track in a CMMS — MTBF, MTTR, PM Compliance Rate, OEE, Planned Maintenance Percentage, Work Order Backlog, Predictive Alert Conversion Rate, and Cost Per Asset — each measure a specific dimension of maintenance performance that, when tracked correctly, tells a maintenance organization exactly where to act next. The majority of facilities that fail to improve on these KPIs after CMMS deployment are not failing because of data availability — they are failing because KPIs are defined inconsistently across teams, calculated from manual inputs rather than automated system records, and reviewed in quarterly PDFs rather than live dashboards. iFactory solves each of these failure modes by connecting every KPI directly to live IoT sensor streams, AI model outputs, and CMMS work order records — delivering automatic calculation, real-time visibility, and role-based reporting for every maintenance stakeholder from floor technician to plant director. Book a Demo to see iFactory's maintenance KPI dashboard running live on real industrial asset data from your sector.
Why Most CMMS KPI Programs Fail to Deliver Operational Improvement
The Gap Between KPI Tracking and KPI-Driven Action
Tracking maintenance KPIs and improving maintenance performance are not the same thing. Facilities that track MTBF in a spreadsheet updated at end-of-shift are working with data that is already 8 to 24 hours stale when a reliability engineer reviews it. PM Compliance Rates calculated from manual inspection logs rather than automated work order timestamps are systematically overstated because incomplete tasks are marked complete rather than overdue. OEE values compiled from production system exports and CMMS records that do not share a timestamp reference produce reconciliation arguments rather than operational decisions. The failure mode is consistent: KPIs defined loosely, calculated manually, and reviewed too infrequently to drive the interventions they are supposed to trigger. iFactory's CMMS architecture removes each of these failure modes by connecting KPI calculation directly to live IoT sensor data, AI predictive model outputs, and CMMS work order timestamps — ensuring the number on the dashboard reflects what is happening on the plant floor right now, not what happened last week according to a manual log.
| KPI | Manual / Spreadsheet Tracking | iFactory Automated CMMS Tracking | Operational Impact |
|---|---|---|---|
| MTBF | Calculated monthly from end-of-shift logs; 8–24 hr data lag | Calculated automatically from IoT failure timestamps; real-time trend visibility | Catch declining MTBF before next failure, not after |
| MTTR | Self-reported repair times; understated by 15–30% on average | Calculated from AI alert timestamp to work order closure; no manual input required | Accurate repair time baseline drives workflow improvement |
| PM Compliance Rate | Manually marked complete; overdue tasks understated; real rate inflated | Calculated from scheduled due dates vs. work order closure timestamps in real time | True compliance visibility triggers intervention before backlog accumulates |
| OEE | Compiled from multiple system exports with manual reconciliation; weekly at best | Calculated from SCADA production data and CMMS downtime records in real time per unit | Per-shift OEE visibility enables same-day corrective action |
| Predictive Alert Conversion | Not tracked; no mechanism to measure AI alert accuracy | Tracked from alert generation through work order closure with inspection outcome attached | Drives AI model threshold refinement; maintains technician trust |
| Cost Per Asset | Calculated quarterly from finance system exports; delayed and incomplete | Calculated in real time from CMMS labor, parts, and contractor cost records per asset | Live cost visibility enables asset replacement vs. repair decisions |
The 12 Maintenance KPIs Every CMMS Should Track — Definitions, Formulas, and Benchmarks
From Reliability Fundamentals to AI-Driven Predictive Intelligence
The following twelve maintenance KPIs represent the core performance measurement framework for industrial CMMS deployments in 2026. Each is defined with a formula, a benchmark target, and a description of how iFactory calculates and surfaces it from connected work order, IoT sensor, and AI model data without manual input. KPIs are organized in three tiers — strategic, tactical, and operational — reflecting the organizational level at which each drives action.
Leading vs. Lagging KPIs — Why Your CMMS Needs Both to Drive Predictive Action
The KPI Architecture That Shifts Maintenance From Reactive to Predictive
One of the most consequential decisions in maintenance KPI program design is the balance between leading and lagging indicators. Lagging indicators — MTBF, MTTR, OEE, unplanned downtime — measure outcomes that have already happened. They confirm whether the maintenance program is working, but they cannot prevent the events they measure. Leading indicators — PM Compliance Rate, Planned Maintenance Percentage, predictive alert backlog, and AI-predicted failure probability — signal what will happen next and can be acted upon before the consequence occurs. An effective CMMS KPI program tracks both. Leading indicators catch problems before failures happen; lagging indicators confirm whether interventions are working and provide the trend data that validates the value of the predictive maintenance investment to plant directors and finance stakeholders. iFactory's dashboard architecture separates leading and lagging KPI views by organizational role — giving reliability engineers the leading indicator signals they need to prioritize interventions, while giving plant directors the lagging indicator trends that demonstrate maintenance program ROI.
How iFactory AI Vision Monitoring Adds Visual Anomaly KPIs to the CMMS Dashboard
Computer Vision Metrics That Extend Predictive Coverage Beyond Sensor Data
The most complete maintenance KPI picture requires data from both sensor-derived condition monitoring and visual inspection of physical asset surfaces, structural components, and process connections. AI Vision monitoring applied to pipeline infrastructure, wellhead equipment, rotating machinery, and processing units detects leaks, corrosion progression, mechanical misalignment, and surface defects that IoT sensors alone cannot capture. iFactory's AI Vision module connects computer vision anomaly detection directly to the CMMS KPI layer — adding visual inspection coverage percentage, anomaly detection rate by asset class, time-to-work-order from visual finding, and false positive rate as tracked KPIs in the maintenance dashboard. These visual KPIs close the inspection coverage gap that exists in any maintenance program that relies exclusively on parameter-based condition monitoring. When a visual anomaly finding feeds into the same CMMS work order and asset record as a sensor-derived predictive alert, the reliability engineer sees both the measured condition and the visual evidence in a single asset health view — producing the most complete predictive maintenance intelligence picture available without a physical inspection round.
| KPI Type | Sensor-Based Only | AI Vision Added | Combined iFactory Platform |
|---|---|---|---|
| Bearing Degradation Detection | 3–4 weeks ahead via vibration AI | Limited (no surface sensor) | Vibration + thermal visual combined |
| Pipeline Leak Detection | Pressure drop detection only | Visual leak detection in hours | Pressure + visual; −28% response time |
| Corrosion Progression Tracking | Not detectable by sensor alone | AI Vision detects surface corrosion continuously | Surface visual + wall thickness integration |
| Mechanical Misalignment | Vibration signature only | Visual shaft alignment anomaly detection | Vibration + visual corroboration |
| Inspection Coverage Rate KPI | Limited to sensor-equipped assets only | Extends coverage to all camera-visible assets | 100% coverage across connected assets |
Role-Based KPI Dashboard Configuration — The Right Metrics for Every Operational Audience
Why One Dashboard View Serves No Operational Audience Well
The operational value of CMMS KPIs is not realized when data is available — it is realized when the right person sees the right KPI at the moment they can still act on it. A maintenance floor technician overwhelmed by executive financial KPIs stops checking the dashboard. A plant director presented with work order queue details cannot see the fleet-level patterns that inform capital decisions. iFactory's role-based KPI dashboard architecture delivers tailored views to each operational audience — with iFactory automatically populating each view from the same connected live data layer. The four primary CMMS dashboard audiences and their KPI requirements are structured below for facilities configuring role-based views for the first time. Book a Demo to see iFactory's role-based KPI dashboard configuration for your operational structure.
Common KPI Tracking Mistakes That Undermine CMMS ROI
The Configuration and Governance Errors That Produce KPIs Nobody Acts On
| Failure Pattern | Operational Consequence | iFactory Prevention |
|---|---|---|
| KPI definitions inconsistent across teams and facilities | Benchmark comparisons invalid; management debates definition instead of acting on data | Standardized KPI definitions applied platform-wide; mathematical formula confirmed at configuration before go-live |
| Tracking too many KPIs simultaneously | Dashboard information overload; no KPI receives sufficient management attention to drive action | Role-based dashboard views limit each audience to 5–7 relevant KPIs; configuration guided by stakeholder interview |
| No baseline documented before deployment | Impossible to validate ROI; maintenance improvement invisible to plant director and finance | Pre-deployment baseline capture is Phase 1 of iFactory implementation program; ROI measurement begins at week 3 |
| AI alert thresholds set before baseline establishment | False positive rate above 20%; technicians ignore dashboard alerts within weeks of deployment | Alert thresholds validated with reliability team after 7–30 days of sensor baseline learning; <3% false alert rate confirmed before autonomous alert activation |
| KPIs reviewed monthly rather than in real time | PM compliance decay, MTBF decline, and backlog growth are invisible between review cycles | All KPIs calculated in real time; threshold alerts fire automatically when KPIs breach configured bounds, not on a review calendar |
| No automated report distribution to stakeholders | KPI visibility depends on someone compiling and distributing reports; frequently delayed or skipped | Automated daily, weekly, and monthly report distribution to configured stakeholder lists; zero manual compilation required |
Frequently Asked Questions
What are the most important maintenance KPIs to track in a CMMS?
The core maintenance KPIs are MTBF, MTTR, PM Compliance Rate, OEE, Planned Maintenance Percentage, Unplanned Downtime Percentage, Work Order Backlog, Cost Per Asset, and Predictive Alert Conversion Rate. In 2026, AI-powered CMMS platforms like iFactory also track AI-specific KPIs — Predicted Failure Probability per asset, Remaining Useful Life, and AI model accuracy — that traditional CMMS platforms do not calculate. All should be calculated automatically from connected system records, not manually from spreadsheets.
What is the difference between a leading and a lagging maintenance KPI?
Leading KPIs predict future performance and can be acted on before failures occur — PM Compliance Rate, Planned Maintenance Percentage, predictive alert backlog, and asset condition scores from IoT sensor trending. Lagging KPIs measure outcomes that have already happened — MTBF, MTTR, OEE, unplanned downtime percentage. An effective CMMS KPI program tracks both: leading indicators catch problems before failures happen; lagging indicators confirm whether interventions are working and validate maintenance program ROI to plant directors and finance.
How does iFactory calculate maintenance KPIs without manual data entry?
iFactory connects to existing SCADA, DCS, historian, and IoT sensor infrastructure via OPC-UA, MQTT, and REST APIs, ingesting live sensor data and CMMS work order records automatically. MTBF is calculated from IoT-confirmed failure timestamps and asset runtime hours. MTTR is calculated from AI alert generation to work order closure. PM Compliance Rate is calculated from scheduled PM due dates versus work order closure timestamps. OEE is calculated from SCADA production data and CMMS downtime records. All KPI calculations are automatic — no manual input required at any stage.
What PM Compliance Rate should a maintenance organization target?
A target PM Compliance Rate above 85 percent is the industry benchmark for effective preventive maintenance programs. Facilities below 70 percent are typically operating in a reactive maintenance cycle where unplanned downtime and emergency repair costs are significantly elevated. iFactory's automated PM scheduling, condition-based trigger conversion, and real-time compliance dashboard with threshold alerts support PM Compliance Rate improvement to above 85 percent within 12 months of deployment on structured implementations.
How does iFactory's AI Vision module contribute to maintenance KPI tracking?
iFactory's AI Vision module adds visual inspection coverage percentage, anomaly detection rate by asset class, time-to-work-order from visual finding, and visual false positive rate as tracked CMMS KPIs — extending predictive maintenance coverage to leaks, corrosion, mechanical misalignment, and surface defects that IoT sensors alone cannot detect. AI Vision findings feed directly into the same CMMS work order and asset record as sensor-derived predictive alerts, giving reliability engineers complete visual and parameter intelligence in a single asset health view.
Conclusion
Maintenance KPIs tracked in a CMMS deliver operational value only when they are defined consistently, calculated automatically from live connected data, surfaced to the right operational audience in real time, and connected to the AI predictive intelligence layer that converts KPI signals into planned interventions before they become unplanned failures. The twelve KPIs covered in this guide — from MTBF and OEE through predictive alert conversion rate and emissions intensity — represent the complete performance measurement framework for industrial maintenance organizations in 2026. iFactory delivers all of them automatically from connected IoT sensor, AI model, and CMMS work order data, with role-based dashboard views configured for each operational audience and automated report distribution that closes the loop between maintenance intelligence and organizational decision-making. Facilities that track the right KPIs, calculated correctly, in real time — and connect those KPIs to AI predictive models that identify failure precursors 3 to 4 weeks ahead of mechanical failure — are the facilities that achieve the 30 to 50 percent unplanned downtime reductions and 20 to 30 percent maintenance cost improvements that transform maintenance from a cost center into a competitive operational advantage. Book a Demo with iFactory to receive a facility-specific KPI program assessment mapped to your operational requirements and asset classes.