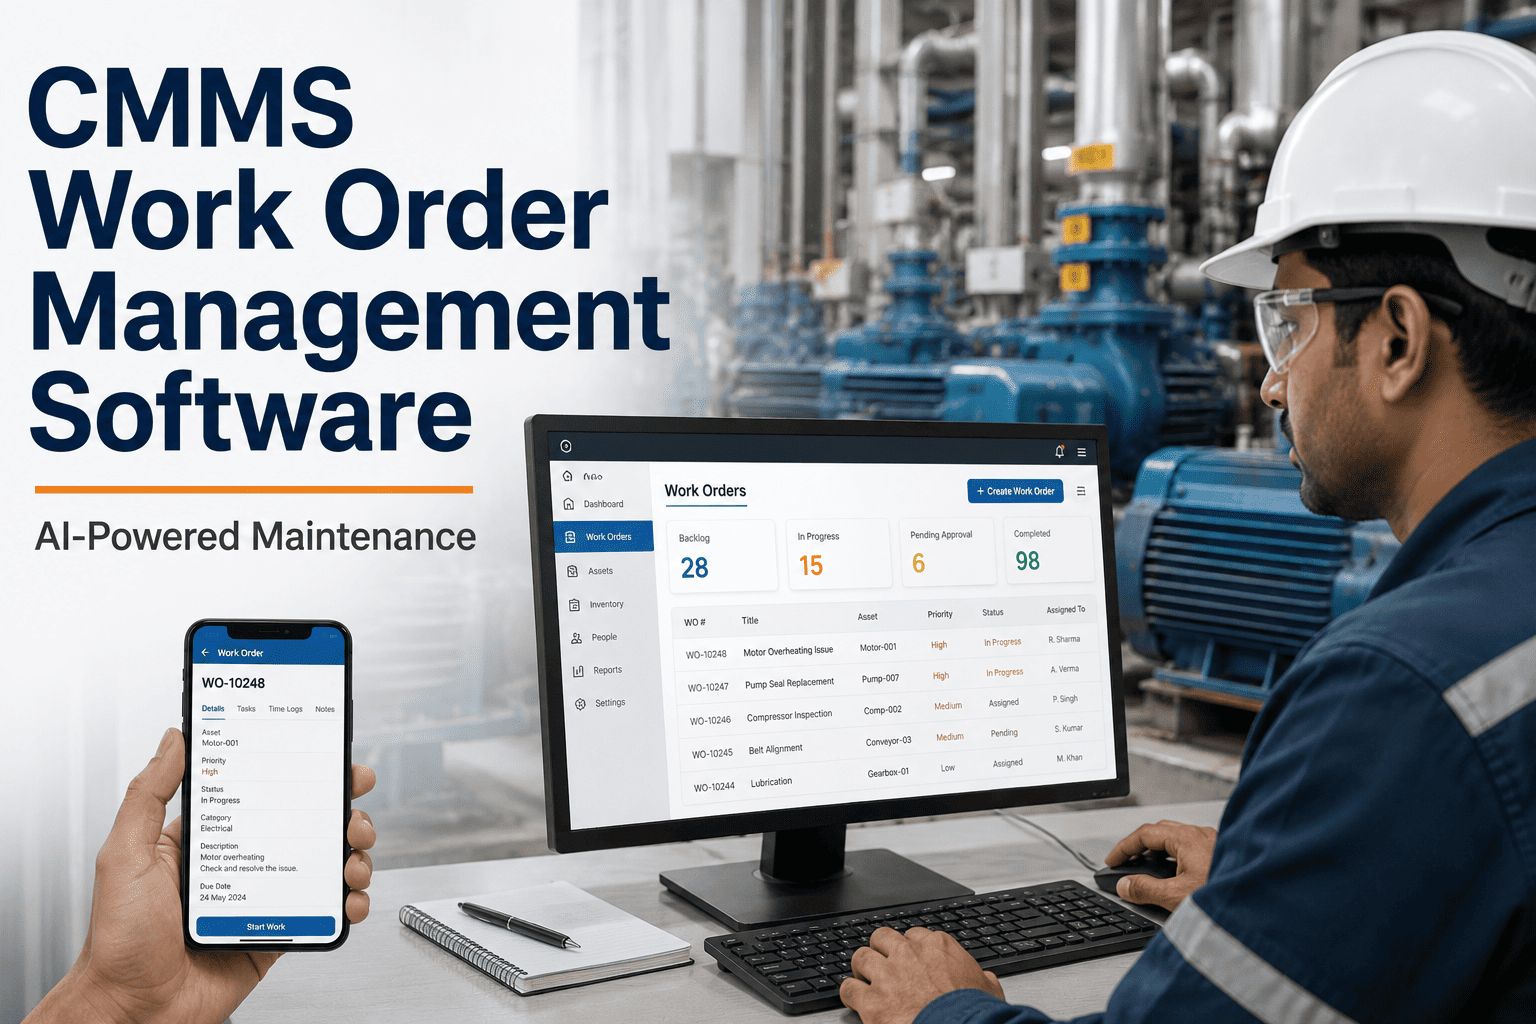
CMMS Work Order Management Software | AI-Powered Maintenance

By James C on August 17, 2026

work-order-management

A work order is where a maintenance problem either becomes a completed, documented job — or disappears into a phone call, a sticky note, and a shared inbox nobody follows up on. That gap is expensive. Teams running work orders on paper and spreadsheets lose an average of 3.4 hours per technician every week to pure administrative overhead, watch skill-mismatched assignments push mean time to repair up by 30 percent, and let chronic backlog quietly raise their emergency repair rate by 40 percent. The lifecycle itself is the fix: when creation, prioritization, assignment, execution, and closure each run digitally instead of by memory, the same work order that used to take 3.6 days to complete closes in under one. iFactory digitizes that entire lifecycle — with AI generating and routing work, mobile execution capturing data at the point of work, and real-time dashboards that build themselves from every closure. To see the full pipeline run on your own asset hierarchy, book a demo.

iFactory CMMS · WORK ORDER MANAGEMENT

Every Work Order, From Request to Closure, on One Intelligent System.

Automated creation from sensors and requests, AI priority routing, skill-matched technician assignment, offline-capable mobile execution, and real-time tracking — the complete maintenance work order lifecycle, digitized so nothing slips through the cracks between a problem and a fix. One connected system replaces the phone calls, sticky notes, and disconnected spreadsheets that let work disappear.

3.6d → 1d Work order lifecycle compressed with digital workflows
+22% Wrench time gained from mobile execution
28–35% Maintenance cost reduction within 18 months
94% PM compliance reported on modern digital platforms

What Manual Work Orders Actually Cost You

Manual work order management — paper logs, spreadsheets, whiteboards, and verbal coordination — works fine in a small facility with a few dozen assets. It stops working the moment complexity scales. As operations spread across shifts, lines, and sites, visibility collapses, tasks slip, backlog swells, and the team drifts from planned maintenance into permanent reactive firefighting. The costs don't arrive as one dramatic failure; they accumulate in the gaps, one lost paper form and one delayed assignment at a time.

The pattern is remarkably consistent across facilities. Managers first notice trouble when downtime starts rising unexpectedly, preventive tasks begin slipping, and the backlog expands faster than the team can work it down. By then the root cause is structural, not personal: a manual system simply cannot provide the real-time visibility a modern operation needs, so failures that gave clear warning signs get missed because nobody was positioned to connect the data to a work order. Root cause analysis turns into guesswork, recurring failures quietly become accepted as normal, and audit preparation becomes a scramble because historical records are scattered and slow to retrieve.

Administrative Time Bleed
Technicians lose an average of 3.4 hours per week to administrative overhead — chasing paperwork, transcribing notes, walking back to the office to update a job. That's time that produces zero repair value, multiplied across every technician on every shift, and it's the first thing mobile execution wins back the moment the office trip disappears.
Lost and Corrupted Records
Paper work orders are lost or damaged in roughly 15 percent of field cases, and paper-based closure relies on technicians transcribing notes hours or days later — introducing errors and omissions that corrupt the asset history every reliability decision depends on.
The Wrong Technician on the Job
When planners assign work without visibility into skill certifications, workload, or location, the wrong technician gets the job. Skill-mismatched assignments increase mean time to repair by 30 percent and lower first-time fix rates — every mismatch is a return trip waiting to happen.
Backlog That Feeds Itself
An unmanaged backlog is the leading indicator of a maintenance program sliding backward. Chronic backlog increases emergency repair rates by 40 percent, and each emergency displaces the planned work that would have prevented the next one — a loop that compounds every week until the team is doing almost nothing but reacting. Breaking that loop starts with seeing the backlog clearly by priority and age.
Manual data processing costs roughly $28,500 per employee per year once you account for labor, error correction, and lost revenue from unbilled or uncaptured work. The paper itself is cheap. Everything the paper fails to do is what costs the money.

The Complete Work Order Lifecycle, Digitized

A work order isn't a single event — it's a lifecycle with five distinct stages, and a failure at any one of them undermines all the others. A perfectly executed repair documented on a paper form that gets lost produces no asset history. A well-documented job assigned to the wrong technician still takes a return trip. iFactory closes every stage in one connected flow, so the output of each step feeds the next automatically — a sensor trigger becomes a prioritized order, which becomes a matched assignment, which becomes a mobile-executed repair, which becomes a closed record that updates every downstream metric without anyone re-entering a thing.

STAGE 1
Automated Creation

Work orders generate automatically from three sources: IoT sensor thresholds, time-based PM schedules, and incoming service requests. When a vibration sensor detects bearing degradation or a meter reads outside normal range, the system creates a work order before any human notices the problem — pre-populated with the sensor reading, the AI risk score, and the recommended repair action. Manual creation, when needed, takes seconds from a phone.

STAGE 2
AI Priority Routing

Every work order is classified against a clear priority framework — emergency and safety-critical work at the top, urgent operational-impact work next, then scheduled PM and routine tasks — so the highest-impact jobs are always visible at the top of the queue with zero reliance on subjective, first-come guesswork. Cost-appropriate approvals route automatically through the right tier, with auto-escalation if an approval stalls, cutting approval time from days to minutes for the vast majority of orders while emergencies bypass the queue with a post-completion audit trail.

STAGE 3
Skill-Matched Assignment

The system assigns each work order to the best-available technician based on skill match, certification, location, current workload, and shift schedule — not whoever happens to be free. Electrical work routes to electricians, instrumentation work to instrument specialists, eliminating the skill mismatches that inflate repair time. A mobile push notification delivers the job with full context: asset history, failure description, parts list, safety notes, and navigation.

STAGE 4
Mobile Execution

Everything the technician needs lives on their phone: the priority-sorted queue, navigation, complete asset history, digital checklists, a live parts check, photo capture, and time logging. Labor time, parts consumed, meter readings, and findings are captured at the point of work — documented as the job happens, not reconstructed from memory at the end of the shift. Offline mode keeps work moving in basements, tunnels, and remote yards, syncing the moment signal returns. This alone cuts unplanned downtime substantially through faster, unrestricted response times, and eliminates the manual data-entry errors that corrupt asset records.

STAGE 5
Closure & Analytics

On closure, the work order does five things at once: it updates the asset's maintenance history, triggers a parts reorder if stock fell below threshold, feeds MTBF and MTTR calculations, allocates cost to the asset record, and updates the PM compliance tracker. Requiring a failure code on every corrective and emergency order turns closure into analytical fuel — the data reliability engineers need to spot repeat failures and justify condition monitoring, all without a single end-of-period spreadsheet.

Watch the Full Pipeline Run on Your Assets

Bring your asset hierarchy, technician skill matrix, and a typical week of work orders to the call. iFactory engineers will show the sensor-to-dispatch-to-closure flow mapped onto your operation — and where your current process is leaking time.

Where AI Actually Changes the Work

Automation follows fixed rules — generate a PM order every 30 days. AI learns and adapts, and on a work order platform that difference shows up in four specific places where a human decision used to create a bottleneck or a delay. This isn't AI for its own sake; each capability removes a concrete point of friction from the lifecycle.

01
Predictive Creation
When a sensor detects impending failure, AI generates the work order before the failure becomes visible — a predictive job for a problem no human has noticed yet, complete with the behavioral-model deviation and a recommended action. The team gets lead time that a reactive process never provides, turning what would have been an unplanned breakdown into a scheduled repair during a planned window.
02
Intelligent Classification & Routing
AI categorizes each request, assigns a priority level, and routes it to the right technician or team based on trade, location, availability, service history, and SLA rules — so no supervisor spends time deciding who should take a job the system can already match correctly.
03
Repeat-Failure Detection
Embedded models flag repeat issues, unusual spending patterns, and recurring asset failures that warrant human review or escalation. Instead of recurring failures quietly becoming accepted as normal, they surface as a flagged pattern a reliability engineer can act on.
04
Status & Escalation Alerts
Delayed work orders, stalled approvals, and high-priority jobs at risk of missing their window surface automatically to the right person's mobile device — breaking the information silos that let a critical order sit unnoticed until it becomes an emergency.

Manual vs iFactory: The Same Work Order, Two Journeys

The clearest way to see the difference is to follow one corrective work order — a bearing showing early wear — through both processes side by side. The equipment is identical. Only the system carrying the work is different, and that difference decides whether the fix happens on a planned schedule or as a 2 a.m. emergency.

Lifecycle Stage Manual Process iFactory CMMS
Detection Noticed on next manual round, if at all Sensor threshold triggers auto work order
Prioritization First-come, or loudest requester wins AI priority score, ranked in queue
Assignment Whoever is free, skill unchecked Skill, certification, workload matched
Dispatch Verbal, no asset context Mobile push with history and parts list
Execution record Notes transcribed hours later Captured at point of work, timestamped
Closure Paper filed, maybe entered Auto-updates history, MTTR, parts reorder
Typical lifecycle 3.6 days Under 1 day
Digital work orders cut task errors by 55 to 60 percent and reduce the work order lifecycle from 3.6 days to under one. The manual column isn't a story about lazy technicians — it's a story about a process that forces good people to spend their time on administration instead of repair.

Reports That Build Themselves

In a manual operation, KPIs are a monthly chore — someone compiles spreadsheets, reconciles conflicting logs, and produces a report about a period that's already over. When work orders are digital, every closure feeds the metrics automatically, so program health is a live view rather than a backward-looking assembly job. And because the data comes straight from closed work orders rather than manual entry, the numbers are trustworthy enough to actually drive decisions instead of being second-guessed in every review meeting.

MTTR & MTBF
Mean time to repair and mean time between failures calculate continuously from closed work order data — no separate data entry, no month-end reconciliation. A rising MTTR surfaces as a trend, pointing to parts delays or planning gaps before it becomes a pattern.
PM Compliance
The percentage of scheduled preventive work completed on time, tracked in real time across the entire equipment portfolio. Falling compliance is an early warning that the team is being pulled into reactive work faster than it can keep up.
Backlog by Priority & Age
A live view of total backlog broken down by priority, age, and asset class, with weekly schedule compliance calculated automatically. Trend data shows whether the program is improving or drifting back toward reactive mode.
Planned vs Reactive Ratio
The share of work that's planned versus corrective firefighting — the single clearest signal of maintenance maturity. When more than 60 percent of orders are corrective, the ratio itself tells you PM is constantly being postponed to fight fires, and the trend line shows whether recent effort is actually pulling the program out of reactive mode or just holding ground.

How iFactory Work Order Management Deploys

Work order management is one module of a full CMMS, and it's designed to go live fast — the difference between software that gets adopted and software that collects dust is whether it fits how technicians actually work in the field, not just how managers view a desktop dashboard. The rollout below reflects how a typical operation moves from paper to a fully digital lifecycle, front-loading the setup that makes AI routing and mobile execution work correctly from day one.

1
Asset & Skill Setup
Your asset hierarchy is registered with maintenance history, and technician profiles are loaded with skills, certifications, and shift schedules — the foundation that lets AI routing and skill-matched assignment work from day one rather than after months of tuning.
2
Trigger & Priority Configuration
Automated creation triggers are wired to your PM schedules, IoT sensors, and service-request channels, and the priority framework and approval tiers are configured to your operation's thresholds so the right work rises to the top automatically.
3
Mobile Rollout to Technicians
The native mobile app is deployed to field technicians with offline capability, QR asset check-in, and photo capture. Adoption is the real test — if a technician can create, photograph, and close a work order in under three minutes without help, the rollout succeeds.
4
Live Dashboards & Integration
Real-time KPI dashboards go live for supervisors and reliability engineers, and the work order module connects to inventory so parts consumption, reorder triggers, and cost allocation flow automatically alongside every closure.

Frequently Asked Questions

The questions maintenance managers and reliability engineers ask most often before deciding to digitize their work order process across their operation.

What's the difference between work order software and a full CMMS?
Basic work order software creates and tracks repair requests — it's a digital replacement for paper. A full CMMS connects those work orders to asset records, PM schedules, parts inventory, technician skill profiles, and analytics dashboards, which is what lets it tell you what needs repair before it fails, who should do it, and whether the fix worked. For most operations beyond a few hundred assets, a full CMMS with strong work order management delivers far better return than a standalone tool. To see where your operation sits on that line, book a demo.
Will technicians actually use the mobile app, or will it become shelf-ware?
Adoption is exactly where most implementations fail, so the mobile experience is the first thing to evaluate — not the desktop dashboard. The test is simple: ask a real technician to create a work order in a trial, attach a photo, and close it. If it takes more than three minutes or any help, that's your adoption risk. iFactory is built so the app disappears into the workflow rather than imposing a new one, with offline capability, QR check-in, and one-tap capture, because technicians spend far more time in the mobile app than managers spend on the desktop. Scanning a QR code instantly pulls up OEM specs, warranty status, and repair history, which is what lets a technician diagnose accurately on the first visit and cut return trips.
How does AI priority routing decide what comes first?
Each work order is classified against a structured priority framework rather than first-come-first-served, so safety-critical and emergency work always ranks above operational-impact work, which ranks above scheduled and routine tasks. The AI weighs the asset's criticality, the nature of the failure, and the operational impact to produce a ranking that keeps the highest-impact jobs at the top of the queue. Approvals then route automatically through cost-appropriate tiers, which is how approval time drops from days to minutes for the large majority of orders while emergencies bypass the queue entirely with a full audit trail.
We already have sensors and a BAS. Can this generate work orders from them?
Yes — automated creation from existing IoT sensors, building automation systems, and meter readings is a core capability, not an add-on. When a vibration sensor detects bearing degradation, a temperature anomaly appears, or consumption drifts outside normal range, the system generates a work order automatically, populated with the sensor reading, the model deviation, and a recommended action. The result is a predictive work order for a problem before any human notices it, which is the difference between planning a repair and reacting to a breakdown. Contact iFactory support to review which of your existing signals can drive automated creation.
How quickly do the cost and reliability improvements show up?
The lifecycle compression is immediate — digital workflows cut the average work order from 3.6 days to under one, and mobile execution adds roughly 22 percent of wrench time back to technicians from the first week they stop walking to the office to update jobs. The larger financial gains build over time: operations on modern digital platforms report maintenance cost reductions in the 28 to 35 percent range within about 18 months, alongside PM compliance climbing toward 94 percent as reactive firefighting gives way to planned work. Actual timelines depend on your starting point and asset count, but the early wins in wrench time and lifecycle speed are typically visible within the first month, which is what tends to carry technician adoption through the rest of the rollout.
CLOSE THE GAP BETWEEN A PROBLEM AND A FIX

Stop Losing Work Orders to Paper, Memory, and the Wrong Assignment.

Digitize the complete lifecycle — automated creation, AI priority routing, skill-matched assignment, mobile execution, and self-building dashboards. Give your technicians their wrench time back and give your reliability engineers the data they've never had, all in one system that closes the gap between a problem and its fix.


Share This Story, Choose Your Platform!