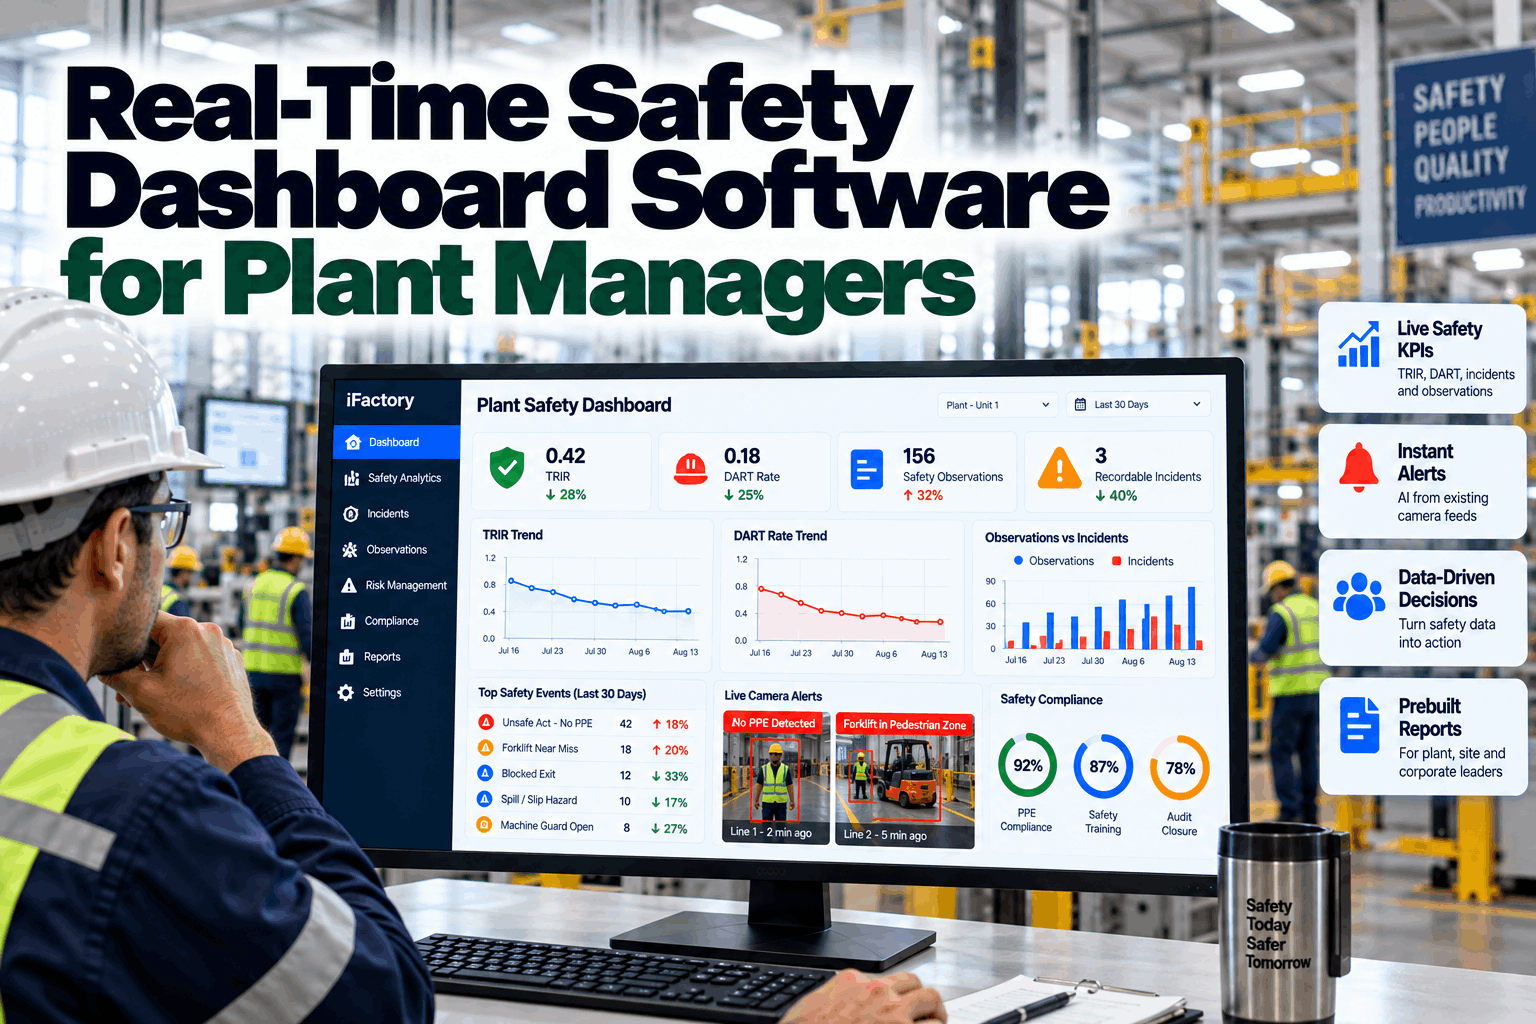
Plant managers are usually handed safety performance as a monthly slide: a TRIR number, a DART number and a few incident summaries, all describing what already went wrong. By the time the slide is built, the conditions behind next month’s injury are already on the floor. iFactory’s real-time safety dashboards put leading and lagging indicators in one live view, from near misses, observations and hazard alerts to recordables, DART cases and overdue corrective actions, so leaders can see where risk is building and act this week, not next quarter. Book a 30-minute walkthrough of a live safety dashboard built on your own data.
One live view of leading and lagging safety indicators, calculated the same way at every site and drillable from plant to line to shift.
At a Glance
Why Monthly Safety Reports Leave Managers Reacting
Most safety reporting is assembled by hand. Incident data sits in one system, observations in another, training records in a learning platform, hours worked in payroll, and corrective actions in spreadsheets. Someone in EHS pulls it together at month end, and the result is accurate but late. It tells the plant manager how many people were hurt, but not which area is drifting, which shift stopped reporting near misses, or which corrective actions have been sitting open for sixty days.
The benchmark context matters too. The Bureau of Labor Statistics reported a private-industry total recordable case rate of 2.3 per 100 full-time workers for 2024, with a DART rate of 1.4, and a manufacturing nonfatal injury rate of 2.5. A plant tracking below those averages can still be carrying serious risk, because rates at a single site move on a handful of cases. That is why leaders need the leading indicators next to the lagging ones, updated as events happen.
TRIR and DART, Calculated the Same Way Everywhere
Rates only compare fairly when every site uses the same formula, the same hours source and the same recordability decisions. The dashboard applies OSHA’s standard normalization, where 200,000 hours represents 100 full-time employees working 40 hours a week for 50 weeks.
The example also shows how sensitive a single-site rate is: two more recordables would move TRIR from 1.8 to 2.2. The dashboard shows rolling twelve-month rates alongside the monthly figure so one bad week does not trigger a false alarm, and one good month does not hide a trend.
Leading and Lagging Indicators, Side by Side
- Total recordable incident rate (TRIR)
- DART rate and lost-time cases
- Severity: days away and restricted days
- First-aid cases by area
- Serious injury and fatality (SIF) events
- Near-miss reports by area and shift
- Safety observations and at-risk behaviors
- Vision AI hazard alerts and repeat locations
- Corrective action closure time and overdue count
- Inspection, audit and training completion
- Permit and LOTO compliance checks
OSHA’s guidance on leading indicators makes the same point: lagging measures show whether past efforts worked, while leading measures show whether today’s controls are being used and are effective. The dashboard is designed to make the connection visible, for example by showing that near-miss reporting on night shift fell by half in the same quarter that night-shift recordables rose.
One Dashboard, Four Audiences
| Role | What they see first | Typical decision | Cadence |
|---|---|---|---|
| Plant manager | Rolling TRIR and DART, top open hazards, overdue actions by owner | Where to put engineering or staffing effort this week | Daily glance, weekly review |
| EHS manager | Near-miss and observation trends, repeat locations, OSHA log status | Which hazards need a formal investigation or program change | Live |
| Area supervisor | Open alerts and actions for their area and shift | What to fix before the end of the shift | Every shift |
| Operations VP | Site comparison on normalized rates, leading-indicator health | Where to send support and how to allocate capital | Weekly and monthly |
Bring an export of last year’s incidents, observations and hours. We show how the dashboard calculates your rates, where leading indicators are thin and which views your team would use first.
From Chart to Decision
A dashboard earns its place only when it changes what someone does. These are the patterns plant leaders most often act on once leading and lagging data sit together.
Usually a reporting problem, not a safer plant. Check supervisor engagement and whether reports are being closed with feedback.
A layout or engineering fix is due. Repeat forklift-pedestrian conflicts in one aisle rarely respond to another toolbox talk.
Escalate by owner. Open actions are known hazards the plant has chosen to live with.
Review the job hazard analysis and procedure for that task, such as die changes, jam clearing or manual handling.
OSHA Recordkeeping, Ready Without the Year-End Scramble
The same records that feed the dashboard feed your OSHA logs. Cases are classified as they are entered, so the OSHA 300 log, the 300A annual summary and 301 incident reports stay current through the year rather than being rebuilt in January. The 300A must be posted from February 1 to April 30, and covered establishments submit their data through OSHA’s Injury Tracking Application by March 2. Since 2024, establishments with 100 or more employees in designated high-hazard industries also submit their 300 and 301 case data electronically, which puts a premium on clean, consistent records.
Recordability decisions stay with your EHS professionals. The dashboard makes those decisions visible and consistent across sites, and keeps the audit trail of who classified each case and when.
What iFactory Delivers
Incidents, observations, hours, training, inspections, actions and vision AI alerts combined from the systems you already use.
TRIR, DART, LTIR and severity calculated on one standard basis at every site, with rolling and monthly views.
Plant, area, supervisor and executive dashboards with drill-down to the underlying event.
Corrective actions with owners, due dates and escalation when they age.
OSHA 300, 300A and 301 kept current, with the classification audit trail.
Ask why a rate moved and get the explanation with the records behind it.
The pre-configured NVIDIA AI server arrives racked with software loaded. We connect cameras and systems, confirm data access and agree the first zones and rules.
Models are tuned to your site, lighting and layouts, then piloted on one area with supervisors reviewing every alert and marking false positives.
Rollout to the agreed zones, operator and supervisor training, and handover to 24×7 remote monitoring of the system itself.
What Data You Need to Get Started
You do not need a perfect data estate to launch a useful dashboard. Most plants start with what they already collect and add sources as the value becomes clear. The first build usually draws on five inputs.
From your EHS system or OSHA logs, with case type, date, area and recordability.
From payroll or timekeeping, by site and ideally by department, so rates can be normalized below plant level.
From forms, apps or spreadsheets. Even inconsistent history is useful for setting a baseline.
Owner, due date and status, wherever they are tracked today.
If iFactory vision AI is running, reviewed camera alerts flow in as a continuous leading indicator.
The first weeks usually surface data-quality issues worth fixing anyway, such as areas coded differently at two sites or hours reported only at plant level. Resolving them once is what lets every later comparison be trusted.
Frequently Asked Questions
TRIR equals the number of OSHA-recordable cases multiplied by 200,000, divided by total hours worked in the period. The 200,000 figure represents 100 full-time employees working a year, which lets sites of different sizes be compared.
TRIR counts all recordable cases. DART counts only cases that resulted in days away from work, restricted duty or job transfer, so it is a better signal of severity. Both use the same 200,000-hour basis.
Common choices are near-miss reports, safety observations, hazard alerts, corrective action closure time, inspection and training completion, and permit or LOTO compliance checks. Start with a few that your team will act on, then expand.
From the systems you already run: incident and EHS software, HR or payroll for hours, learning systems for training, CMMS or spreadsheets for actions, and iFactory vision AI for hazard alerts. Connections are confirmed during scoping.
It keeps OSHA 300, 300A and 301 data current and consistent through the year, which makes posting and Injury Tracking Application submission straightforward. Recordability decisions remain with your EHS team.
Yes. Every site uses the same formulas, the same hours source and normalized rates, and the dashboard shows rolling twelve-month figures so small sites are not judged on a single month.
Real-time safety dashboards put leading and lagging indicators in one view, so plant managers act on this week’s hazards instead of last month’s injuries.