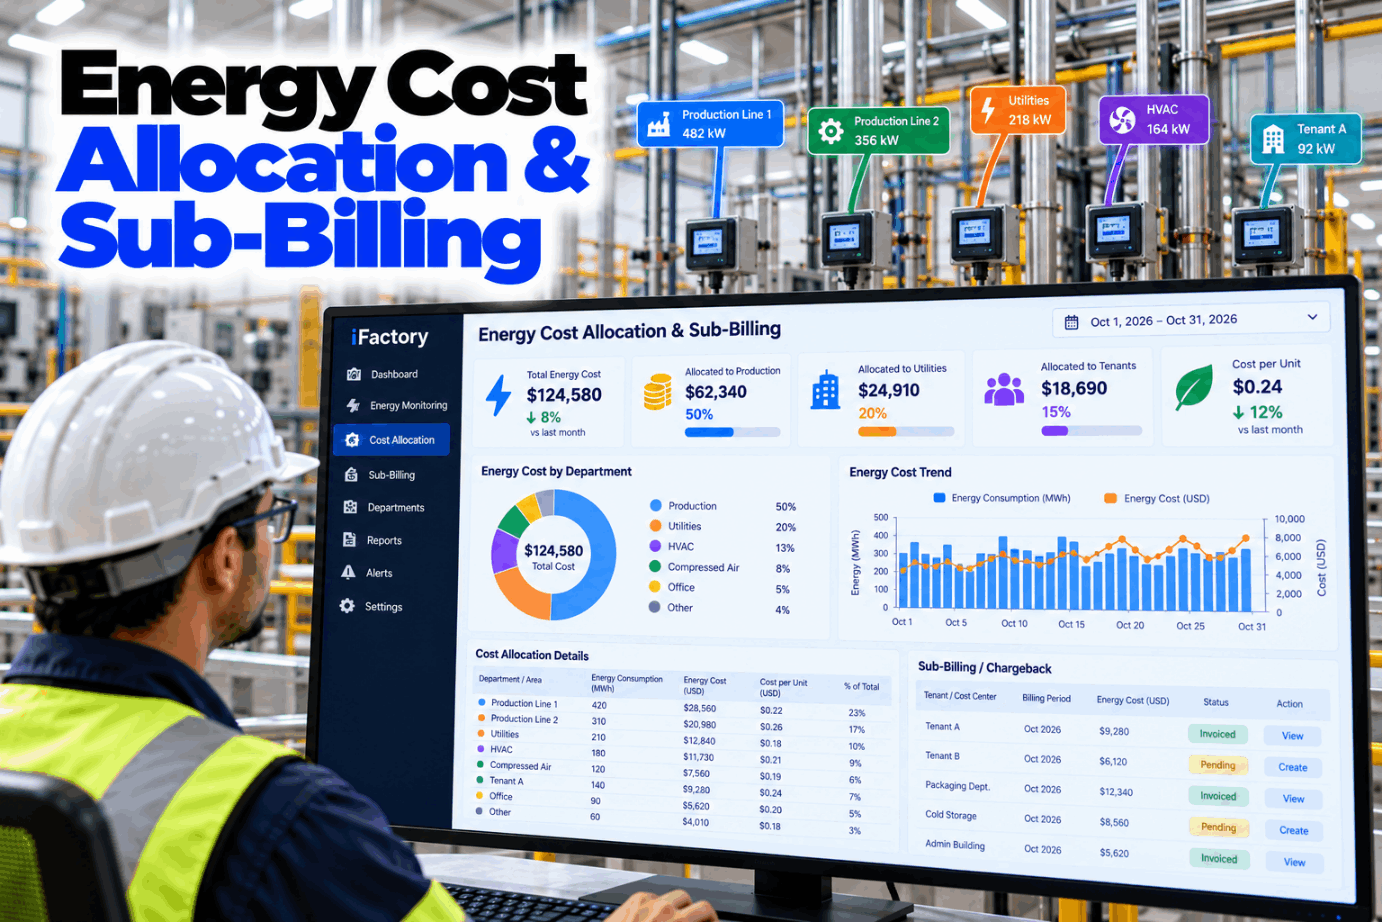
Energy Cost Allocation & Sub-Billing

By Jackson T on October 24, 2026

energy-cost-allocation-sub-billing

Most plants pay one electricity bill and then guess who spent it. A floor-area split or a fixed percentage keeps the books tidy, but it hides which line, department or tenant actually drove the energy use and the demand peak. Energy cost allocation from sub-metered data fixes that, as long as every number adds back to the utility bill. See a full month worked through in a short allocation demo.

ENERGY COST ANALYTICS · SUB-BILLING

Charge Every kWh and Every kW to the Cost Centre That Used It

iFactory Energy Cost Analytics builds a meter tree from the utility meter down to each asset, applies the allocation rules your finance team signs off and produces chargeback statements that add back to the bill. Gaps, faulty meters and unmetered load stay visible instead of hiding in overhead.

October bill · allocationReconciled
Main meter 1,200,000 kWh · peak 4,000 kW
Utility bill$170,400
Line A$82,200
Line B$54,120
Line C$34,080
Remainder 5.0%Demand by coincident peak
Difference to bill $0.00 · ready for finance sign-off
SUB-METERING BILLING HIERARCHY

Four Levels From the Utility Meter to the Asset

Allocation starts with a meter tree. The US Department of Energy's Metering Best Practices guide describes a hierarchy that runs from the most aggregate meter down through sub-systems and branch circuits to end uses, and lists cost allocation and tenant billing among the main uses of metered data. Every meter in the tree should have one parent, and the children should add up to the parent, less losses. Map your own tree with our metering team.

L1
Main utility meterThe revenue meter on the bill. The number everything else must add back to
Utility owned
L2
Feeders and switchboardsIncomers, transformers and main distribution boards serving each building or area
Plant revenue-grade
L3
Lines and departmentsMotor control centres and sub-boards that map to one cost centre
Billing-grade sub-meters
L4
AssetsLarge drives, compressors, chillers, ovens and furnaces worth tracking on their own
Monitoring meters
The sum check

Each month, compare every parent with the sum of its children. A gap that jumps from one month to the next usually means a failed meter, a wrong CT ratio or a new unmetered load, not a change in losses.

ENERGY ALLOCATION METHODS

Metered First, Estimated Only Where You Must

Every allocation method answers the same question: how much of the bill belongs to each cost centre. They differ in how close they come to what was actually used. Metered data wins where meters exist. Estimates fill the gaps, and each one should be written down with its basis so that finance and cost centre owners can check it. Compare methods on your own site in an allocation session.

Closest to useMetered kWh and kWInterval data from a sub-meter on the cost centre's own feeder or asset
Good estimateRun hours × measured kWHours from the PLC or CMMS times a spot-measured average load
Rough estimateNameplate × load factorRated kW times an assumed load factor and hours. Often far from real use
Rough estimateFloor areaFair for lighting and comfort HVAC, poor for process loads
Rough estimateProduction unitsSimple, but it rewards inefficient lines and punishes busy ones
MixedMetered plus driverDirect loads metered, shared loads spread by an agreed driver
ENERGY COST DISTRIBUTION

Losses, Common Areas and the Unmetered Remainder

Sub-meters never cover the whole bill. Some energy is lost in transformers and cables, some feeds shared services such as compressed air, lighting and offices, and some reaches loads nobody metered. In the illustration below, those three together make up 200,000 kWh of a 1,200,000 kWh month. The rule is to keep each slice visible, give it a treatment and set a tolerance. Agree the treatments with our cost team.

October · 1,200,000 kWh on the main meterIllustrative month
Line A500,000
Line B300,000
Line C200,000
Common, metered140,000
Unmetered remainder60,000
LossesTransformer and cable losses sit inside the remainder unless you meter both sides. Spread them with the energy that caused them
Common servicesMeter shared plant such as compressed air where you can. Spread the rest by a driver that reflects use, not by headcount
RemainderSpread by metered share within a tolerance you set. Above it, investigate before you allocate
DEMAND CHARGE ALLOCATION

Coincident or Non-Coincident Peak, Two Fair Answers

Energy is easy to split because kWh add up. Demand is harder because each cost centre peaks at a different time. Coincident peak allocation splits the charge by each one's kW in the interval that set the bill. Non-coincident peak allocation uses each one's own monthly maximum, whenever it happened. Both add up to the same $60,000 here, from an assumed 4,000 kW at $15 per kW. Work through both methods in a demand review.

Cost centreCoincident peak, kW at bill peakNon-coincident peak, own maximum
Line A
1,800 kW · 45% · $27,000
2,000 kW · 40% · $24,000
Line B
1,400 kW · 35% · $21,000
1,700 kW · 34% · $20,400
Line C
800 kW · 20% · $12,000
1,300 kW · 26% · $15,600
Coincident rewards moving load off the plant peak. Non-coincident rewards a flat profile. Some plants split the charge half and half.

Answers Finance Can Trace Back to a Meter

Ask why a cost centre's charge changed and Energy Cost Analytics shows the intervals, meters and rules behind it. Missing data, failed meters and sum-check gaps are flagged before statements go out.

Month-end · Plant controller and iFactory
ControllerWhy is Line B's charge higher this month?
iFactoryTwo reasons. Its metered kWh rose with the Saturday shift, and its oven warm-up ran in the interval that set the plant's demand peak on the 9th, so its demand share rose too.
ControllerShow me that interval.
iFactoryHere it is: 15-minute data for all three lines at 14:15 on the 9th, with each line's kW and the meter IDs behind them.
REVENUE-GRADE METERED BILLING

Revenue-Grade Meters, ANSI and MID Classes

If a meter's reading turns into an invoice, its accuracy class matters. ANSI C12.20 defines classes 0.2 and 0.5, accurate to within ±0.2% and ±0.5% of true value at full load, and the 2015 revision added class 0.1. ANSI now lists C12.20 as historical, with its content folded into ANSI C12.1-2024. In the EU, the Measuring Instruments Directive 2014/32/EU sets classes A, B and C for active energy meters, with C the tightest. Choose classes for your own meter tree with our metering engineers.

±0.1%
ANSI class 0.1Added in the 2015 revision of C12.20
±0.2%
ANSI class 0.2A tight class for meters whose data drives invoices
±0.5%
ANSI class 0.5Suits many internal chargeback and monitoring points
A · B · C
MID, EUAnnex V errors at normal temperature of about 3.5%, 2% and 1% or tighter
The meter is only part of the error

Current transformers have their own accuracy class, and a wrong CT ratio in the meter set-up is a far bigger error than either class. Check ratios on site when each meter is commissioned.

ENERGY COST ALLOCATION WORKED EXAMPLE

One Month Allocated and Reconciled to the Bill

The figures are illustrative. Energy is priced at a flat $0.09 per kWh for simplicity, the 200,000 kWh of common load and remainder is spread by metered share, demand uses the coincident peak split above and $2,400 of fixed charges is spread by total kWh. The last two rows must match, or the statement does not go out. Run your own last bill through it in a reconciliation session.

Cost centre
Metered kWh
Common and remainder
Energy at $0.09
Demand
Fixed
Total
Line A
500,000
+100,000 (50%)
$54,000
$27,000
$1,200
$82,200
Line B
300,000
+60,000 (30%)
$32,400
$21,000
$720
$54,120
Line C
200,000
+40,000 (20%)
$21,600
$12,000
$480
$34,080
Common and remainder
140,000 + 60,000
Spread above
In lines
In lines
In lines
In lines
Allocated total
1,200,000
200,000
$108,000
$60,000
$2,400
$170,400
Main utility bill
1,200,000
Not split
$108,000
$60,000
$2,400
$170,400 · diff $0
TENANT ENERGY BILLING

Chargeback Inside the Company vs Billing Someone Else

Splitting cost between your own departments is an accounting choice. Billing another business for electricity can be a different matter. In some US states and utility areas, charging a tenant for metered electricity counts as resale and is restricted or prohibited. Others allow it with conditions, such as charging no more than the utility's own rate or using approved meters. Check the rules where each site sits before you invoice anyone, and ask our support team how statements can be set up for each case.

Same legal entity
Internal chargebackDepartments, lines and cost centres. Not a sale, so the rules are your own, agreed with finance.
Another business on your site
Tenant sub-billingMay count as resale. State, utility and lease rules decide whether you can bill, how and at what rate.
EU and UK sites
Third-party billingMeters used to bill another party usually need legal metrology approval, such as MID. National resale rules also apply.
ENERGY CHARGEBACK TEMPLATE

What a Cost Centre Energy Statement Should Show

A statement that a cost centre owner can check line by line gets fewer disputes than a single number. Use these fields as an energy invoicing template, whether or not software produces it. See a filled statement in a short statement demo.

Cost centre and periodLine B, October, cost centre code
Meters usedMeter IDs, CT ratios, data coverage
Metered energykWh by tariff period
Allocated shareCommon and remainder, method named
Energy costRate basis from the tariff
Demand sharekW, coincident or non-coincident
AdjustmentsEstimated intervals flagged
ReconciliationDifference to bill and approver
ENERGY SUB-BILLING CHECKLIST

Eight Checks Before the First Statement Goes Out

Most disputes over energy charges come from set-up, not from arithmetic. Work through these checks with operations and finance before the first month is allocated. Request the full set-up guide from our support team.

Sub-billing readiness
TURNKEY AI DEPLOYMENT

Energy Cost Analytics, Meter Connectors and AI Server in One Package

iFactory delivers Energy Cost Analytics as a turnkey bundle. A pre-configured NVIDIA AI server ships racked and ready with the meter connectors, allocation engine and data-quality models pre-loaded, so interval data stays on site. You rack it, plug in power and Ethernet, and the AI is live. To scope it for your site, request a turnkey quote.

What's Included
  • Pre-configured NVIDIA AI edge server, racked and ready
  • Connectors for revenue meters, sub-meters and the BMS
  • Meter tree mapped from the main meter to each asset
  • Allocation rules for common loads, losses and remainder
  • Demand charge split, coincident or non-coincident
  • Monthly cost centre statements reconciled to the bill
  • 24×7 remote monitoring of models and hardware
Live in 6–12 weeks
Wk 1–4
Map and Connect

Server installed, meter tree built, CT ratios checked, interval data flowing.

Wk 5–8
Reconcile and Pilot

Two past bills allocated in shadow mode, rules agreed with finance.

Wk 9–12
Go-Live and Training

Monthly statements issued, cost centre owners and finance trained.

HOW iFACTORY FITS

Energy Allocation Software Finance Can Audit

Energy Cost Analytics turns meter data into charges that people can check, question and sign. Our support team can walk you through a pilot plan.

1
A meter tree you can audit. Every meter has a parent, a cost centre and a monthly sum check.
2
Rules finance signs. Methods for common loads, remainder and demand are written down and versioned.
3
Reconciled every month. Allocated totals must match the utility bill before statements go out.
4
Gaps flagged by AI. Failed meters, missing intervals and odd sum-check gaps are caught early.
1000+
Industrial clients running iFactory
99.9%
Platform uptime for month-end reporting
6-12 wks
From racked server to reconciled statements
FREQUENTLY ASKED QUESTIONS

What Plant Managers Ask About Energy Cost Allocation

What is energy cost allocation?
It is splitting the utility bill across the departments, lines, cost centres or tenants that used the energy. The best allocations use sub-metered kWh and kW, spread shared and unmetered load by written rules, and add back exactly to the bill.
How should we handle energy that no sub-meter sees?
Keep it as its own line. Measure the unmetered remainder each month as the main meter minus the sum of sub-meters, spread it by metered share while it stays inside a tolerance you set, and investigate when it moves outside it.
Should demand charges follow the coincident or non-coincident peak?
Coincident peak follows what actually set the bill and rewards moving load away from the plant peak. Non-coincident peak uses each cost centre's own maximum and rewards a flatter profile. Both are defensible. Pick one, write it down and keep it for the year.
What meter accuracy do we need for sub-billing?
It depends on the use. Where readings turn into invoices, many sites specify ANSI class 0.2 or an MID-approved meter in the EU. For internal chargeback, class 0.5 is often enough. Correct CT ratios matter more than the class in practice.
Can we bill tenants for the electricity they use?
Sometimes. In some places billing a tenant for metered electricity counts as resale and is restricted or not allowed, and elsewhere it is allowed under conditions on rates and meters. Check state, utility and lease rules before you invoice. Internal chargeback is not resale.
How do we start?
Map your existing meters into a tree, check CT ratios and run the sum check on two past bills. That shows where the remainder sits and which meters to add first. Our support team can help you plan it.

Every Cost Centre Charged for What It Used

Build the meter tree, agree the rules once and send statements that add back to the bill every month. The full system is delivered turnkey and goes live in 6 to 12 weeks.
Example month · Cost centre statements
Meters in treeMain, feeders, lines, assets
Remainder5.0%, inside tolerance
Demand splitCoincident peak
Difference to bill$0.00
Signed off by finance before release

Share This Story, Choose Your Platform!